Digital Signage Wiki/Smart analytics dashboards
3 min read
Jul 10, 2025
Smart analytics dashboards
Smart analytics dashboards are interactive tools used in digital signage to collect, analyze, and visualize data, enabling informed decision-making and enhanced audience engagement.
What is Smart analytics dashboards?
Smart analytics dashboards are revolutionizing the way businesses and organizations utilize digital signage by providing comprehensive insights into audience behavior and content performance. These advanced tools integrate seamlessly with digital signage systems to offer real-time data visualization and analysis. By leveraging these dashboards, users can make informed decisions, optimize content strategies, and ultimately enhance the overall impact of their digital signage networks. This technology is becoming increasingly essential for businesses looking to maximize their return on investment in digital signage.
Data Integration and Visualization
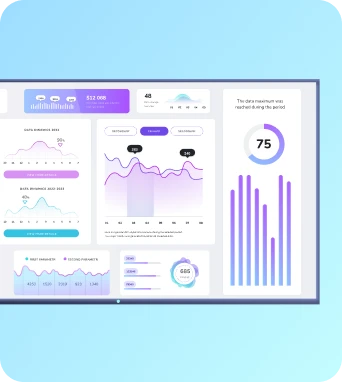
Smart analytics dashboards are designed to seamlessly integrate with various data sources, allowing users to collect and analyze a wide range of information. This integration can include data from social media platforms, customer feedback systems, sales data, and more. By consolidating this information into a single platform, users can gain a holistic view of their digital signage performance. The dashboards offer advanced visualization tools that transform raw data into easy-to-understand charts, graphs, and heatmaps. These visualizations help users identify trends, patterns, and anomalies in their data, enabling them to make data-driven decisions. Furthermore, smart analytics dashboards often include customizable features that allow users to tailor the presentation of data to meet their specific needs and objectives. This level of customization ensures that the insights provided are relevant and actionable, empowering users to optimize their digital signage strategies effectively.
Implementation in Digital Signage
Implementing smart analytics dashboards in digital signage involves several key steps. First, it is crucial to identify the specific goals and objectives that the organization aims to achieve through the use of digital signage. This could range from increasing brand awareness to driving sales or enhancing customer engagement. Once these goals are established, the next step is to select the appropriate analytics dashboard that aligns with these objectives. The chosen platform should offer the necessary features and integrations to support the organization's data collection and analysis needs. After selecting the right tool, the implementation process involves integrating the dashboard with existing digital signage systems and data sources. This may require collaboration with IT teams and digital signage providers to ensure seamless connectivity and data flow. Once integrated, users can begin configuring the dashboard to display relevant metrics and insights. Training sessions may be necessary to familiarize staff with the dashboard's functionalities and ensure they can effectively interpret and act upon the data presented. By following these steps, organizations can successfully implement smart analytics dashboards and unlock the full potential of their digital signage networks.
Maximizing Impact and Engagement
Learn more about Smart analytics dashboards - schedule a demo at https://calendly.com/fugo/fugo-digital-signage-software-demo or visit https://www.fugo.ai/
Keep the learning going...
Signal extender
A signal extender is a device used in digital signage to amplify and extend the reach of audio-visual signals over long distances without degradation.
3 min read
Jul 10, 2025
Single-board computers for signage
Single-board computers for signage refer to compact, all-in-one computing devices used to drive digital signage displays, offering a cost-effective and efficient solution for managing and displaying multimedia content in various environments.
4 min read
Jul 10, 2025
Smart city signage
Smart city signage refers to the integration of digital signage technology into urban environments to enhance communication, information dissemination, and interaction between the city and its residents or visitors.
4 min read
Jul 10, 2025


