You know what a TV is (almost definitely, anyway) and you (hopefully) also know what a dashboard is, but a TV dashboard might be a new term to your ears. If so, buckle in, make yourself comfy - we’re gonna take you through some of the basics:
- What is a TV dashboard?
- What are the different types of dashboard?
- How do you create TV dashboards?
- What are the benefits of putting your data on screen anyway?
Let’s dig in.
What exactly is a TV dashboard?
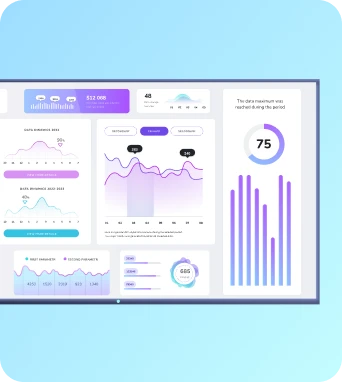
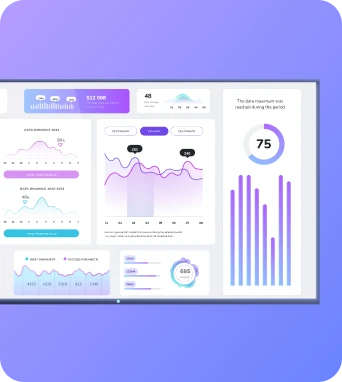
TV dashboards are exactly what they sound like - dashboards that have been put up on TV screens in your workplace to display your metrics and key performance indicators (KPIs.)
They’re an easy and fantastic way to visually inform, motivate, and educate your small team or your multi office conglomerate across various departments. No matter what industry you deal in, TV dashboards are a fantastic internal communications tool, from sales dashboards to HR dashboards, all of them can benefit from being shared up on the big screen.

What is the difference between a dashboard and a TV dashboard?
In short, collaboration and prioritization.
Collaboration
Sharing critical company data across teams is a pain at the best of times, but with a TV dashboard you can replace unnecessary meetings, interruptions, emails & link sharing by keeping data & KPIs front-of-mind at every level of your organization, so your conversations can start being about the data, instead of getting the data. So in a nutshell, a dashboard circulated via email or DM is often not as collaborative as a TV dashboard that the whole team can view and interact with.
Prioritization
You’re probably already circulating reports among your team(s), which are good for going in depth with analysis and showing great detail for a lot of metrics. Whereas TV dashboards are snapshot summaries of your most important (or most critical data.
Because of the limited space of the display medium, TV dashboards force you to prioritize the data you want your team to see to that which is easily understood and actionable.
What are the key benefits of a TV dashboard?
Engagement
Employees are happier, healthier, and more engaged when they have the information they need to succeed at their jobs. Employee engagement is something companies must be willing to invest in, as those with an engaged workforce outperform those with an unengaged workforce by a whopping 202%

And with employees feeling more email fatigue and over-saturation of communication channels than ever, how do you make sure that they’re actually getting the data they need without further burdening and alienating them with more work tools?
TV screens present a great opportunity to use your work tech in ways that actually engage your employees because:
- They surface information in an ambient way that’s not disruptive to workflows
- They provide a canvas for really dynamic content - things like 4K video, animations, or split screen content
- They can integrate with tools you already use, so your employees can simply look up at the TV for the latest updates from your G Suite, analytics tools, and more
- Instead of emails and DMs that typically just get read once, TVs can loop content for greater uptake and recall
Motivation
This is especially true for sales-focused teams: having your KPIs and targets up for the whole team to view creates a healthy sense of competition and can motivate everyone to work harder and faster towards their objectives and goals.
Alignment
Teamwork makes the dreamwork, so they say!
Because a TV dashboard is usually on a wall in a shared work space, your data and goals become transparent. It makes it clear to your whole team (or org) which metrics and goals are most important. And when everyone knows what metrics are most important, they can all work together to improve them.
Perhaps most importantly, when TV dashboards are designed well, they show the correlation between the work your team is doing and the outcomes they produce, allowing everyone to understand how they’re contributing to your company’s success.
Easy Data Access
Making your data obtainable to the relevant staff saves time and enables your workforce to be more productive. We always like to put it simply as this - let your team focus on the data, not on getting the data.
Sharing data with every employee who needs it impacts decisions at every level of the business, from the C-Suite down to front line workers, uniting everyone around your goals & mission and giving them the information they need to make performance-boosting real time decisions.
Remote Management
With a cloud-based TV dashboard software like Fugo, you can also manage your screens and content remotely, meaning you can update your screens from anywhere at any time.
What kinds of data can you display on a TV dashboard?
With Fugo TV dashboards, any data that lives beyond a login on your dashboard can be displayed on your screen securely.
Organizations in all industries use dashboard tools - from logistics companies that need to quickly adapt their transportation fleets to changes in operations, to software companies that need to focus and align teams during times of rapid growth.
However, your industry won’t necessarily determine the content of your dashboards. When it comes to what you’ll display, you should think about specific use cases and objectives, and base your TV dashboards on those.
Here are some examples of how organizations can use their TV dashboards:
Sales Dashboards
Motivate your sales or support teams by showing deals closed, revenue earned, target tracking and commissions/rewards to motivate more sales!
Marketing Dashboards
Track your ad budget, social media impressions & view online performance metrics in real-time so your team can see the direct impact their hard work has on the business.
Customer Support Dashboards
Display your ticket response times and customer satisfaction scores to let your team know the impact they make.
Logistics Dashboards
Streamline operations among your transportation fleet by tracking useful metrics on screen such as driver locations, deliveries made/remaining, and whatever else you need.
How can I set up a TV dashboard?
We thought you’d never ask!
1.Choose your hardware
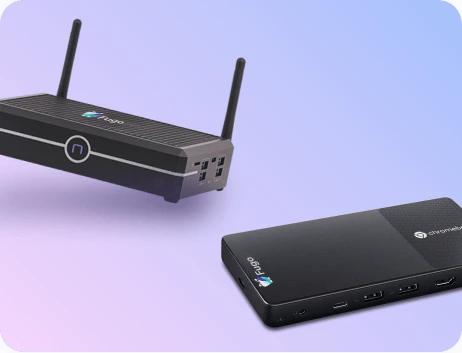
You don’t need to run out and buy specialist hardware here. The easiest way to connect your dashboards to a screen is with a smart TV. But if you don’t have a smart TV, you can use a “dumb” screen combined with an external media player like an Amazon Fire TV Stick or Chromebit - this will act as the brain for your TV, telling it what to display based off the instructions it gets from a connected TV dashboard software. Which brings us to our next step:
2. Choose your TV dashboard software
Whether you’re using a smart TV or a combination of hardware, something is going to have to tell your screen what dashboards to display - this is where TV dashboard software comes in. It will allow you to integrate with your preferred dashboard tool and connect to your screen so that you can publish your dashboards to your TV.
But choosing the right software here can be tricky. Many of the solutions available work by exposing your dashboard login credentials to your device, leaving your data wide open to hackers & any bad actor able to carry off your player.
Fugo’s secure TV dashboard feature removes this issue with a completely different approach; integrating with business intelligence tools like Tableau and Power BI, our software allows your dashboard to be displayed on a screen without creating a public URL or decrypting encrypted credentials from a shared login and storing them on a device.
3. Design your dashboard(s)
Monitoring the pulse of your business means tracking several different metrics. Pick the KPIs you want to put on screen based on your goals and what you want to communicate to your teams to help them succeed. Often, there are too many metrics to put on just one dashboard. It may be worth considering more than one TV dashboard in your office.
Beautiful TV dashboards means that the dashboard software itself has been optimized for a great experience. But they also mean you’ve considered best practices when it comes to building and displaying dashboards on screen (more on that in a minute.)
Note that your TV dashboards should be placed in close proximity to the team it’s intended to lead. If you have multiple, place them adjacent to wherever that team is located in the office. Alternatively, if you have a smaller office or team, consider setting up your TV dashboard in a common area and display the dashboards on an automatic rotation. Remember, TV dashboards are meant to drive performance, not divert attention away from critical work.
Our top 6 tips for creating awesome TV dashboards
- Go beyond just dashboards: TV dashboards don’t have to just be a basic dashboard on screen, using Fugo, your display can be enriched with other complimentary media via our design studio. Add a news headline strip to the bottom, pop the local weather up in the corner, or even add your company logo or a world clock - it is up to you!
- Schedule your dashboards: You might have data that is more useful or relevant at certain times of the day/week/year so go ahead and create a schedule with this in mind to optimize your dashboard TV screen to the max!
- Create a playlist with your dashboard: Have an awesome sales team that you want to keep motivated and engaged? Great! Why not create a playlist that incorporates not only your sales dashboard, but also loops in an awesome rewards page (you can create one using our 100’s of free templates) to remind your team what they are working towards.
- Pull data from all your dashboards: We get that lots of you use more than one app for your dashboard data. With Fugo you can easily pull data from multiple dashboards and mix your data from various sources such as Looker with Power Bi, Tableau, and more to create a super dashboard TV!
- Capture specific sections: Lots of TV dashboard software only allows you to show the full screen version of your dashboard, but with Fugo you can capture specific sections of your dashboard allowing you to highlight certain aspects and omit others as required.
- Embed your dashboards on company intranets and co-working portals: It’s great having your data up on the big screen, but with Fugo you can share your dashboards/playlist via an embedded channel too, meaning WFH staff don’t miss out on the fun. You can also embed your Fugo channel in Notion or Confluence.
What else can you display with Fugo?
Having a secure screen sharing solution will inevitably open up your organization to new ways of thinking about how workplace screens can bring your entire workforce together around your culture - even those employees who don’t sit at desks or check their email.
With a powerful tool like Fugo, you have the flexibility to create and share content that can best motivate and meet the needs of your employees. Think of it like a company TV channel.
Along with business intelligence dashboards and KPI boards, you can consider a range of other content in various information categories:
News: Company announcements, social media, national & global news, RSS feeds, stocks, weather, industry news, sports
People: Praise, project management boards, OKRs, work anniversaries, birthdays, meet-the-team, benefits, polls, event reminders
Functional: Way-finding, desk booking, room booking, directories, menus

Fugo Professional Services
If you are an Enterprise client, Fugo Professional Services can help your organization to plan and execute a digital signage strategy aligned with your business goals. Working together, we can assist you in planning a screen network deployment and intentional content strategy with digital signage as the heartbeat of your connected workplace. Learn more about our Pro Services here.
Get started with TV dashboards!
Fugo Dashboards is one of the most secure, scalable options in the industry when it comes to sharing your BI dashboards with your teams.
If you’d like to get started, you can go ahead and sign up for a Fugo account to create one dashboard during your free trial.
Alternatively, you can book a demo with our team. We’d love to show you how Fugo Dashboards might work inside your organization!


