Digital Signage Wiki/Real-time performance dashboards
3 min read
Oct 23, 2025
Real-time performance dashboards
Real-time performance dashboards are digital interfaces that display live data and metrics, enabling immediate insights and decision-making in various business environments.
What is Real-time performance dashboards?
Real-time performance dashboards are powerful tools used in digital signage to provide immediate access to critical data and performance metrics. These dashboards are designed to display live information, allowing businesses to monitor operations and make informed decisions quickly. By integrating various data sources, real-time performance dashboards offer a comprehensive view of performance indicators, enhancing operational efficiency and strategic planning.
Key Features of Real-time Performance Dashboards
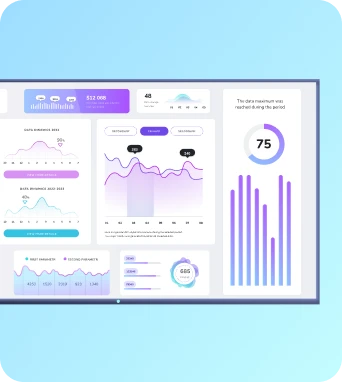
Real-time performance dashboards are characterized by their ability to integrate and display data from multiple sources in a cohesive and user-friendly interface. One of the primary features is data visualization, which transforms complex datasets into understandable graphics such as charts, graphs, and gauges. This visualization capability is crucial for identifying trends, patterns, and anomalies at a glance. Another significant feature is the ability to customize dashboards to meet specific business needs. Users can select which metrics to display, set thresholds for alerts, and choose the layout that best suits their workflow. Additionally, these dashboards often include interactive elements, allowing users to drill down into data for more detailed analysis. The integration of real-time data feeds ensures that the information displayed is always current, enabling timely decision-making. Furthermore, many real-time performance dashboards offer mobile compatibility, ensuring that users can access critical data from any location, thus supporting remote management and oversight.
Implementing Real-time Performance Dashboards
Implementing real-time performance dashboards involves several key steps to ensure they effectively meet business objectives. The first step is identifying the key performance indicators (KPIs) that are most relevant to the organization's goals. This requires collaboration between different departments to ensure that the selected metrics provide a comprehensive view of performance. Once KPIs are identified, the next step is to integrate data sources. This may involve connecting to databases, APIs, or other data repositories to ensure that the dashboard receives a continuous stream of real-time data. The design phase follows, where the dashboard's layout and visualization elements are configured to present data in the most intuitive and actionable format. User training is also a critical component of implementation, as it ensures that staff can effectively interpret and utilize the dashboard's insights. Finally, ongoing maintenance and updates are necessary to adapt the dashboard to evolving business needs and technological advancements. By following these steps, organizations can leverage real-time performance dashboards to enhance operational efficiency and strategic decision-making.
Final Thoughts on Real-time Performance Dashboards
Real-time performance dashboards are essential tools for modern businesses seeking to enhance their operational efficiency and decision-making capabilities. By providing immediate access to critical data and insights, these dashboards empower organizations to respond swiftly to changing conditions and make informed strategic decisions. Learn more about Real-time performance dashboards – schedule a demo at https://calendly.com/fugo/fugo-digital-signage-software-demo or visit https://www.fugo.ai/.
Keep the learning going...
Real-time data integration
Real-time data integration involves the continuous synchronization and updating of data across systems to ensure immediate accessibility and consistency.
3 min read
Real-time network load balancing
Real-time network load balancing refers to the dynamic distribution of network traffic across multiple servers or resources to optimize performance and ensure reliability in digital signage systems.
3 min read
Real-time social media feeds
Real-time social media feeds refer to the continuous and instantaneous display of social media content on digital signage, allowing audiences to view live updates and interactions as they happen.
3 min read


