Digital Signage Wiki/Data visualization displays
3 min read
May 7, 2025
Data visualization displays
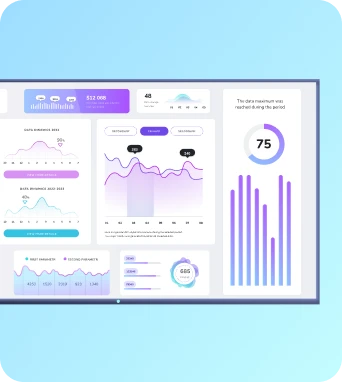
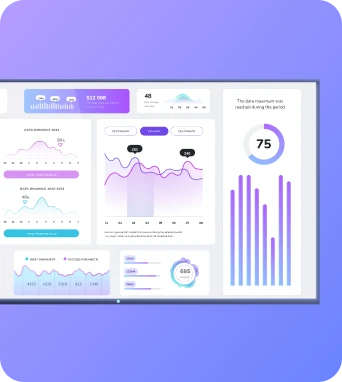
Data visualization displays are digital screens that present complex data in graphical formats, making information easily understandable and accessible in real-time.
What is Data visualization displays?
Data visualization displays are an integral part of modern digital signage solutions, transforming complex datasets into visually engaging and easily digestible formats. These displays leverage graphical elements such as charts, graphs, and maps to present information in a way that enhances understanding and decision-making. By utilizing real-time data feeds, they provide dynamic content that can be tailored to various audiences and environments, making them a powerful tool for businesses and organizations looking to communicate data-driven insights effectively.
The Role of Data Visualization Displays in Digital Signage
Data visualization displays play a crucial role in digital signage by converting raw data into visual formats that are easy to interpret. These displays utilize various graphical representations such as bar charts, line graphs, pie charts, and heat maps to convey information succinctly. The primary advantage of using data visualization in digital signage is its ability to present complex information quickly and clearly, which is essential in environments where time and attention are limited. For instance, in a retail setting, data visualization displays can show sales trends and customer demographics, enabling store managers to make informed decisions on inventory and marketing strategies. Additionally, these displays can integrate with real-time data sources, allowing for the presentation of up-to-date information such as stock prices, weather forecasts, or social media trends. This dynamic capability ensures that the content remains relevant and engaging, capturing the audience's attention and facilitating better communication.
Implementing Data Visualization Displays in Various Sectors
The implementation of data visualization displays spans numerous sectors, each benefiting from the enhanced communication and decision-making capabilities these displays offer. In the corporate sector, data visualization displays are used in boardrooms and offices to present key performance indicators (KPIs) and financial data, aiding executives in strategic planning and performance tracking. In healthcare, these displays can visualize patient data and treatment outcomes, improving patient care and operational efficiency. Educational institutions utilize data visualization to present academic performance metrics and research data, fostering a data-driven learning environment. Furthermore, in the transportation sector, data visualization displays provide real-time updates on schedules and routes, enhancing passenger experience and operational efficiency. The versatility of data visualization displays allows them to be customized to meet the specific needs of each sector, ensuring that the information presented is both relevant and actionable.
Final Thoughts on Data Visualization Displays
Data visualization displays are a transformative tool in the realm of digital signage, offering a powerful means to communicate complex data in an accessible and engaging manner. By integrating these displays into various environments, organizations can enhance their communication strategies and make data-driven decisions with greater confidence. Learn more about Data visualization displays – schedule a demo at https://calendly.com/fugo/fugo-digital-signage-software-demo or visit https://www.fugo.ai/.
Keep the learning going...
Dashboard display
A dashboard display is a digital interface used to visually present key performance indicators (KPIs), metrics, and data points for monitoring business processes or systems.
2 min read
May 7, 2025
Dashboard widgets
Dashboard widgets are interactive and customizable elements used in digital signage systems to display real-time data, metrics, and other relevant information in a visually engaging manner.
3 min read
May 7, 2025
Data-driven content
Data-driven content refers to digital signage content that is dynamically generated or updated based on real-time data inputs, enhancing relevance and engagement.
3 min read
May 7, 2025


