Bandwidth utilization tracking
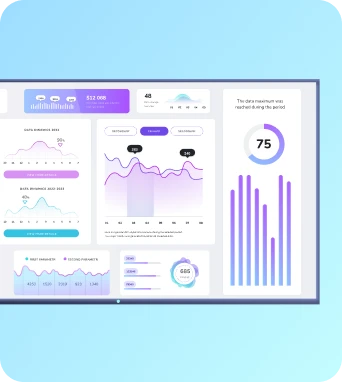
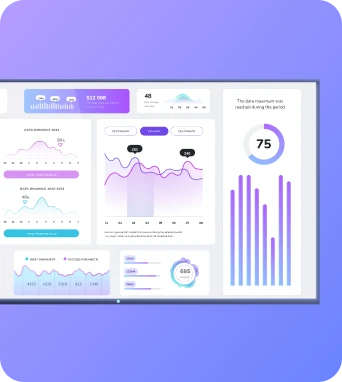
Bandwidth utilization tracking records and analyses the volume, timing and patterns of network traffic used by digital signage devices and TV dashboards. It shows per-player consumption, content-related peaks and trends, enabling operators to detect playback bottlenecks, enforce quotas, and make data-driven decisions for capacity planning and content scheduling.
Bandwidth utilization tracking
How bandwidth tracking works and what it measures
Bandwidth tracking for signage combines several measurement techniques to produce actionable metrics. On-device agents report bytes transferred, connection durations, and transfer rates for every content fetch or streaming session. These agents may log DNS lookups, HTTP requests, and the size and type of files (images, video, firmware). At the network edge, routers and proxies can provide flow-level data that captures aggregate throughput, per-IP or per-VLAN totals, and periods of congestion. When used together, on-device and edge data let operators distinguish between a single large transfer and prolonged streaming that could affect playback quality. Time-based aggregations show peak windows and recurring spikes tied to scheduled updates or external events. Key metrics typically include total bytes transferred, average and peak throughput, per-device and per-content consumption, session counts, and error or retry rates. More advanced setups calculate effective bandwidth per screen during playback, cache hit ratios, and the impact of content resolution on transfer volumes. Combining bandwidth logs with playback logs helps identify whether frame drops or stalls were caused by insufficient upstream capacity, local decoding issues, or intermittent connectivity. For cloud-hosted CDNs and delivery platforms like those integrated with Fugo, delivery logs also indicate response times and geographic distribution, guiding decisions about using regional caching, adaptive bitrate streaming, or scheduled prefetching to reduce real-time demand.
Operational uses and troubleshooting with bandwidth data
In practical terms, bandwidth utilization tracking turns raw numbers into operational rules and fixes. For scheduling, capacity data identifies low-traffic windows when large content packages or software updates can be pushed without disrupting primary displays. Where players use cellular or metered connections, per-device quotas prevent unexpected costs by limiting large downloads outside approved windows or by prioritising low-bandwidth alternatives of the same content. For multi-site deployments, comparing bandwidth profiles across locations highlights under-provisioned networks that need upgrade or alternative delivery tactics such as local caching servers or peer-to-peer distribution. Troubleshooting benefits directly from correlating bandwidth metrics with playback and error logs. When a screen reports buffering, the operator can immediately check recent throughput trends and retry counts to determine whether the issue was network congestion, packet loss, or a corrupted asset requiring re-upload. Alerting rules can notify administrators when throughput drops below a threshold during scheduled playback, enabling remote intervention before audiences notice problems. Over time, historical bandwidth trends inform procurement and SLA discussions with ISPs, justify investment in better connectivity, and support configuration of QoS rules that give signage traffic appropriate priority. Integrations with Fugo’s dashboard enable automated reports, CSV exports for finance or IT teams, and API access to feed bandwidth data into broader network monitoring systems.
Best practices and implementation notes
Keep the learning going...
Bandwidth monitoring
Bandwidth monitoring is the continuous measurement and analysis of network throughput, latency and utilisation across connections serving digital signage. It reveals content delivery bottlenecks, measures streaming stability on TV dashboards and provides data for operators to optimise schedules, content quality and network costs to sustain reliable playback.
Bandwidth-adaptive media delivery
Bandwidth-adaptive media delivery is a method that dynamically adjusts video and image encoding, resolution and bitrate in response to real-time network conditions. Designed for digital signage and TV dashboards, it preserves playback continuity and brand visuals while minimising stalls, data waste and the need for manual quality overrides across distributed display networks.
Bandwidth-efficient streaming
Bandwidth-efficient streaming is an approach to delivering video and visual content that minimises network load while preserving perceived quality. It uses adaptive bitrate encoding, intelligent caching, local playback and smart delivery strategies to reduce bandwidth consumption on digital signage networks while keeping playback smooth and predictable.


