Digital Signage Wiki/Analytics-driven dashboards
3 min read
Jan 22, 2025

Analytics-driven dashboards

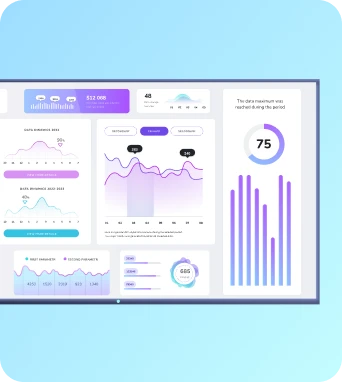
Analytics-driven dashboards are digital interfaces that utilize data analytics to display real-time information and insights, enhancing decision-making and engagement in digital signage.

What is Analytics-driven dashboards?

Analytics-driven dashboards are powerful tools in the realm of digital signage, providing users with the ability to visualize and interpret data in real-time. These dashboards are designed to collect, analyze, and display data in a way that is both accessible and actionable. By integrating analytics into digital signage, businesses can enhance their communication strategies, optimize content delivery, and improve audience engagement. The use of analytics-driven dashboards allows for a more dynamic and responsive approach to digital signage, enabling organizations to make informed decisions based on current data trends and insights.

The Role of Data Visualization

Data visualization is a critical component of analytics-driven dashboards, transforming complex datasets into intuitive and interactive visual formats. This process involves the use of charts, graphs, and other visual elements to represent data in a way that is easy to understand and interpret. In the context of digital signage, data visualization enables businesses to present information in a visually appealing manner, capturing the attention of their audience and conveying key messages effectively. By leveraging data visualization techniques, organizations can highlight trends, patterns, and anomalies within their data, facilitating a deeper understanding of audience behavior and preferences. This, in turn, allows for more targeted and personalized content delivery, enhancing the overall impact of digital signage.

Implementation and Practical Applications

Implementing analytics-driven dashboards in digital signage involves integrating various data sources and analytics tools to create a seamless and efficient system. This process typically begins with identifying the key performance indicators (KPIs) that align with the organization's goals and objectives. Once these KPIs are established, data is collected from various sources, such as social media, web analytics, and customer feedback, to provide a comprehensive view of audience engagement and content performance. The collected data is then processed and analyzed using advanced analytics tools, which generate actionable insights that can be displayed on the dashboard. In practical applications, analytics-driven dashboards can be used in a variety of settings, including retail, corporate environments, and public spaces. In retail, for instance, these dashboards can help store managers monitor foot traffic, sales trends, and customer demographics, enabling them to adjust marketing strategies and optimize product placements. In corporate environments, analytics-driven dashboards can be used to track employee performance, monitor project progress, and facilitate data-driven decision-making. Public spaces, such as airports and train stations, can utilize these dashboards to provide real-time information on schedules, delays, and other relevant updates to travelers.

The Future of Analytics-driven Dashboards

Learn more about Analytics-driven dashboards - schedule a demo at https://calendly.com/fugo/fugo-digital-signage-software-demo or visit https://www.fugo.ai/