Yellowfin BI

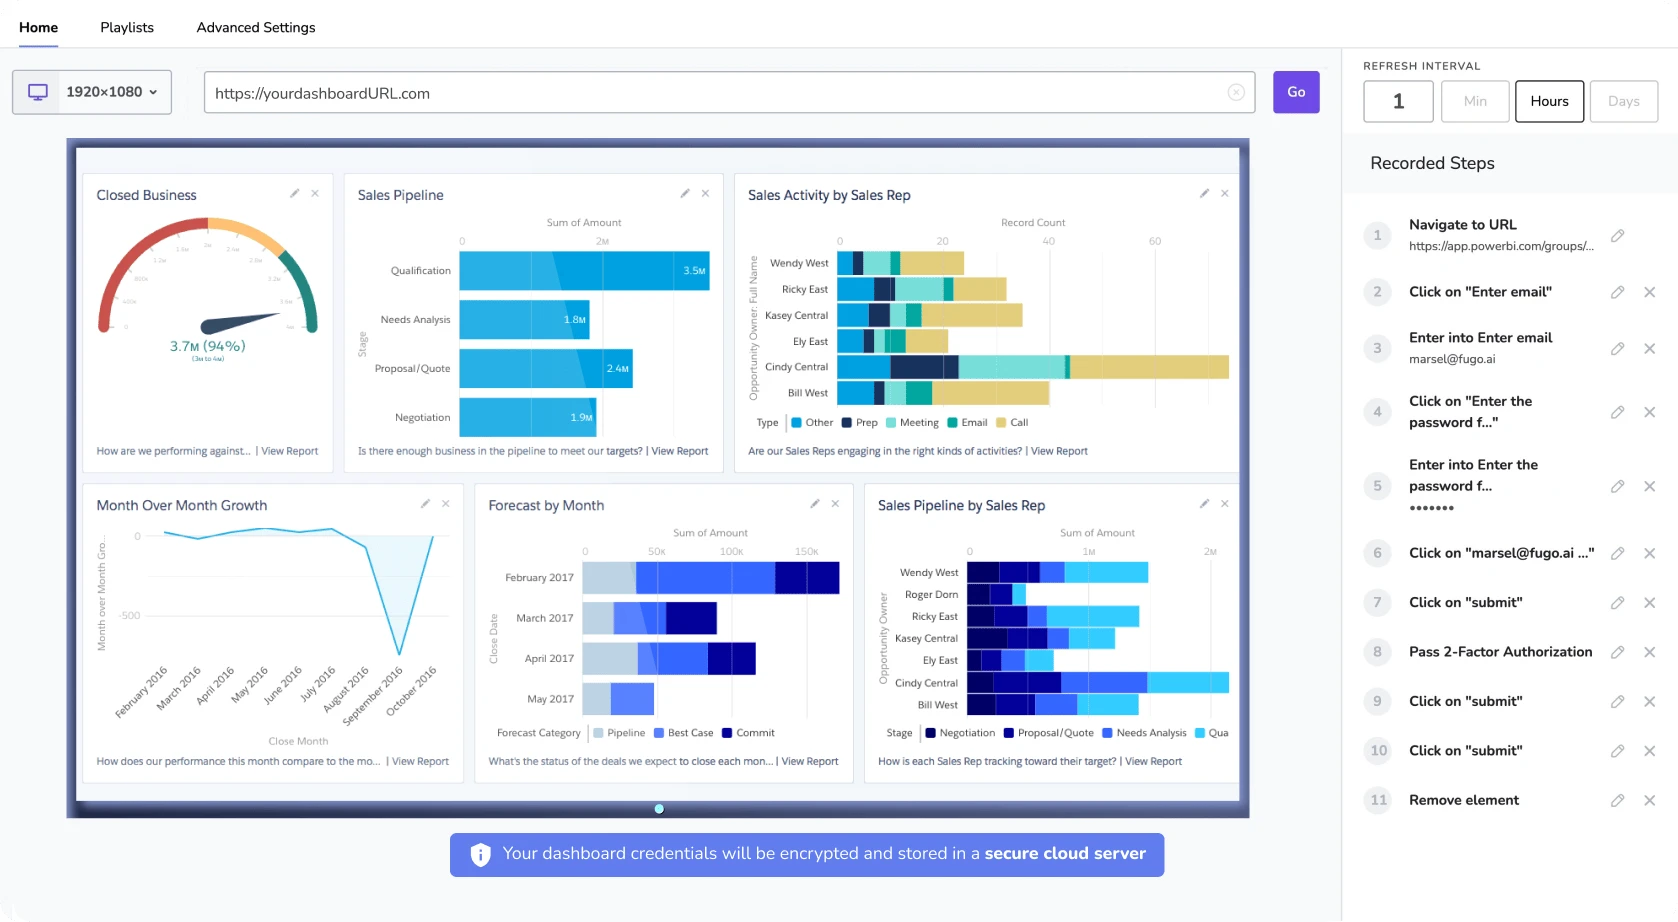
Experience data-driven insights with Yellowfin BI's interactive dashboard, designed for real-time analytics and enhanced decision-making efficiency.

TV Frame
Yellowfin BI illustrationYellowfin BI logo
BUSINESS INTELLIGENCE
Interactive Data Visualization
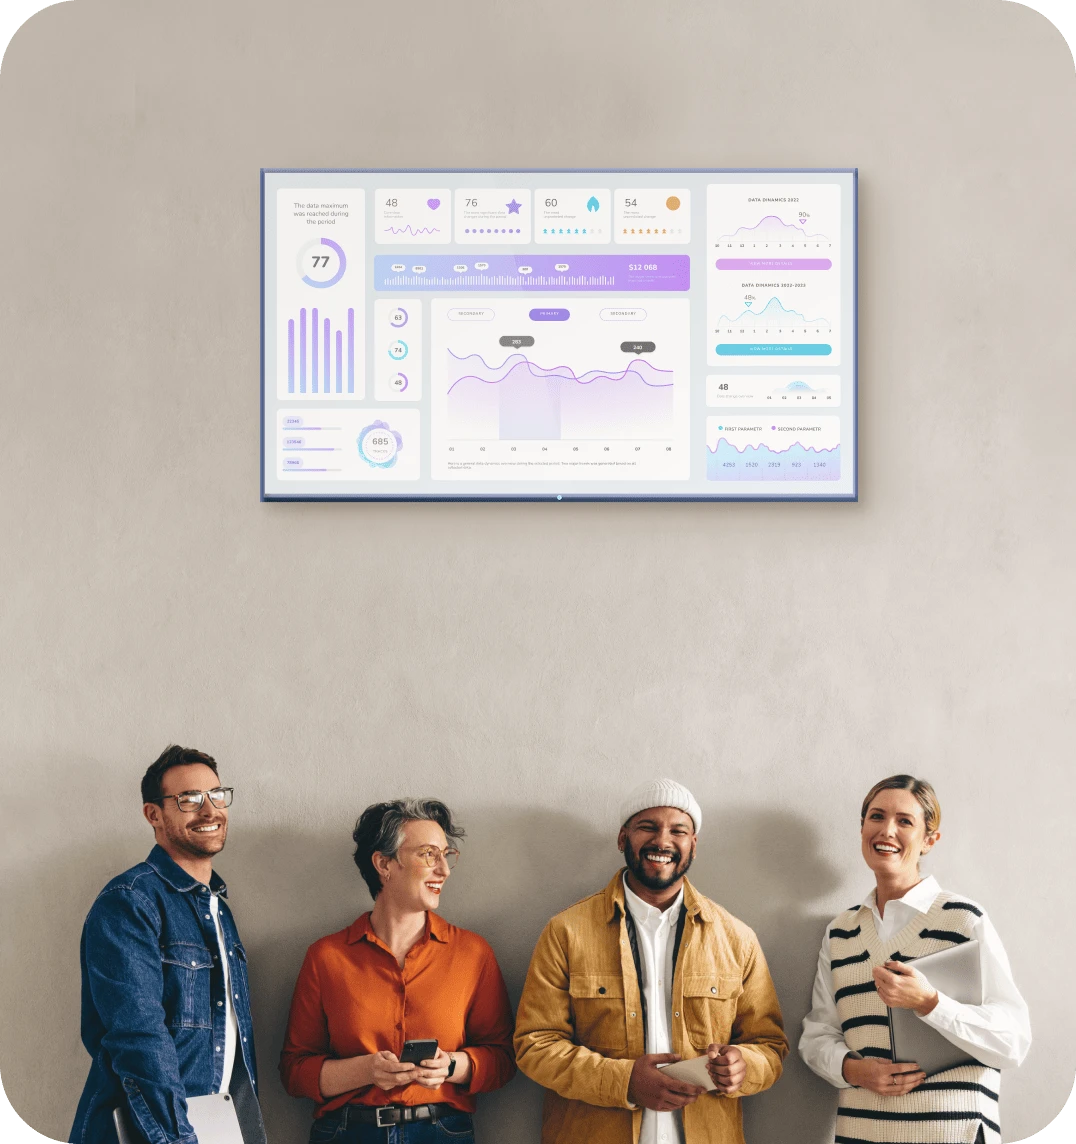
The Yellowfin BI dashboard offers an interactive data visualization experience, allowing users to explore data through dynamic charts, graphs, and maps. With its intuitive drag-and-drop interface, users can easily customize their views and drill down into specific data points for deeper analysis. This feature empowers organizations to uncover hidden patterns and trends, facilitating more informed decision-making processes.
Learn more about workplace screens
Realtime analytics
FEATURES
Key Features of Yellowfin BI Dashboard

Interactive data exploration with drill-down capabilities

Real-time data updates for timely insights

Customizable dashboards and reports

Seamless integration with various data sources

Advanced analytics with predictive modeling

Collaborative features for team-based analysis

Mobile-friendly interface for on-the-go access

Robust security measures to protect data integrity

Intuitive drag-and-drop interface for ease of use

BUSINESS INTELLIGENCE
Who is this Dashboard For?
The Yellowfin BI dashboard is ideal for business analysts, data scientists, and decision-makers across various industries who require robust data analysis tools. It caters to organizations looking to harness the power of data visualization for strategic planning and operational efficiency. Whether you're in finance, healthcare, retail, or any other sector, this dashboard provides the insights needed to drive growth and innovation.
Who is this for
Compliance
Certified secure: SOC 3 Type II
SOC logo
Fugo is SOC 3 Type II certified under the AICPA Service Organization Controls (SOC) framework. This certification demonstrates our commitment to maintaining rigorous organizational & technology controls, which are independently audited on an annual basis.
Learn more about security & compliance
Features
Share Yellowfin BI dashboards at scale throughout your organization
Built for stable performance
Dashboards are displayed via live snapshots, reducing the computing power needed to display them.
Customize the data refresh rate
Adjust the data refresh rate so that Fugo can update your dashboard on screen as often as you need.
Make data TV-screen friendly
Crop & customize your saved dashboards in Fugo to display more effectively on TV screens.
Send it at the right time & place
Make sure the right data reaches the right teams on screens located across departments & locations.
Share
Frequently Asked Questions
How easy is it to integrate Yellowfin BI with existing data sources?

Yellowfin BI supports seamless integration with a wide range of data sources, including databases, cloud services, and third-party applications, ensuring a smooth setup process.

Can I customize the dashboard to fit my specific business needs?

Yes, the dashboard is highly customizable, allowing users to tailor reports, visualizations, and layouts to align with their unique business requirements.

Is Yellowfin BI suitable for small businesses?

Absolutely. Yellowfin BI is scalable and can be adapted to suit businesses of all sizes, providing valuable insights regardless of the organization's scale.

What kind of support is available for Yellowfin BI users?

Yellowfin BI offers comprehensive support, including online resources, community forums, and dedicated customer service to assist users with any queries or technical issues.

PoppinBoston DynamicsLeroy MerlinJ.CrewStruersAsicsBossDieselLululemonRalph LaurenKissterraElisabetta FranchiFuture PlayAssuranceNordwardSkelloEdgewellElkemPumaEstee LauderPoppinBoston DynamicsLeroy MerlinJ.CrewStruersAsicsBossDieselLululemonRalph LaurenKissterraElisabetta FranchiFuture PlayAssuranceNordwardSkelloEdgewellElkemPumaEstee Lauder
Need help?
Similar Dashboards
View all dashboards
ThoughtSpot
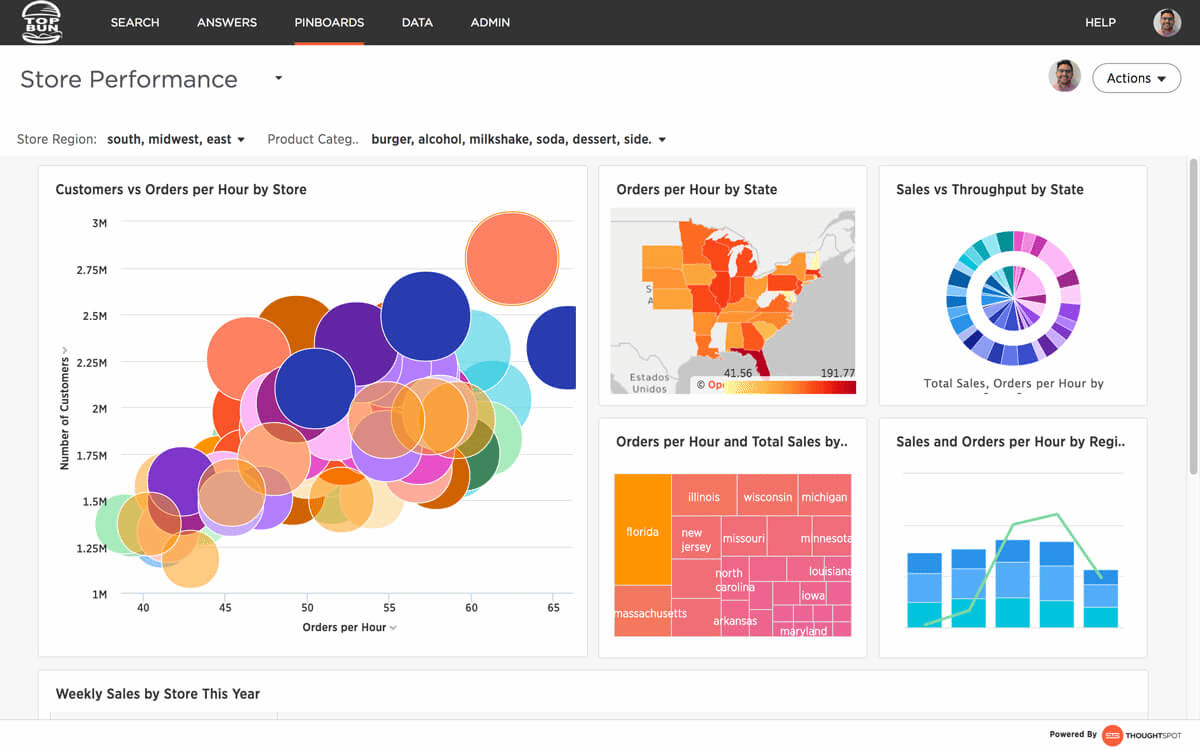
Gain real-time insights and make data-driven decisions with the ThoughtSpot dashboard, featuring intuitive search and AI-driven analytics.
Learn more 🡪
TIBCO Spotfire
This TIBCO Spotfire dashboard provides real-time data visualization and analytics to enhance decision-making and operational efficiency.
Learn more 🡪
Zoho Analytics
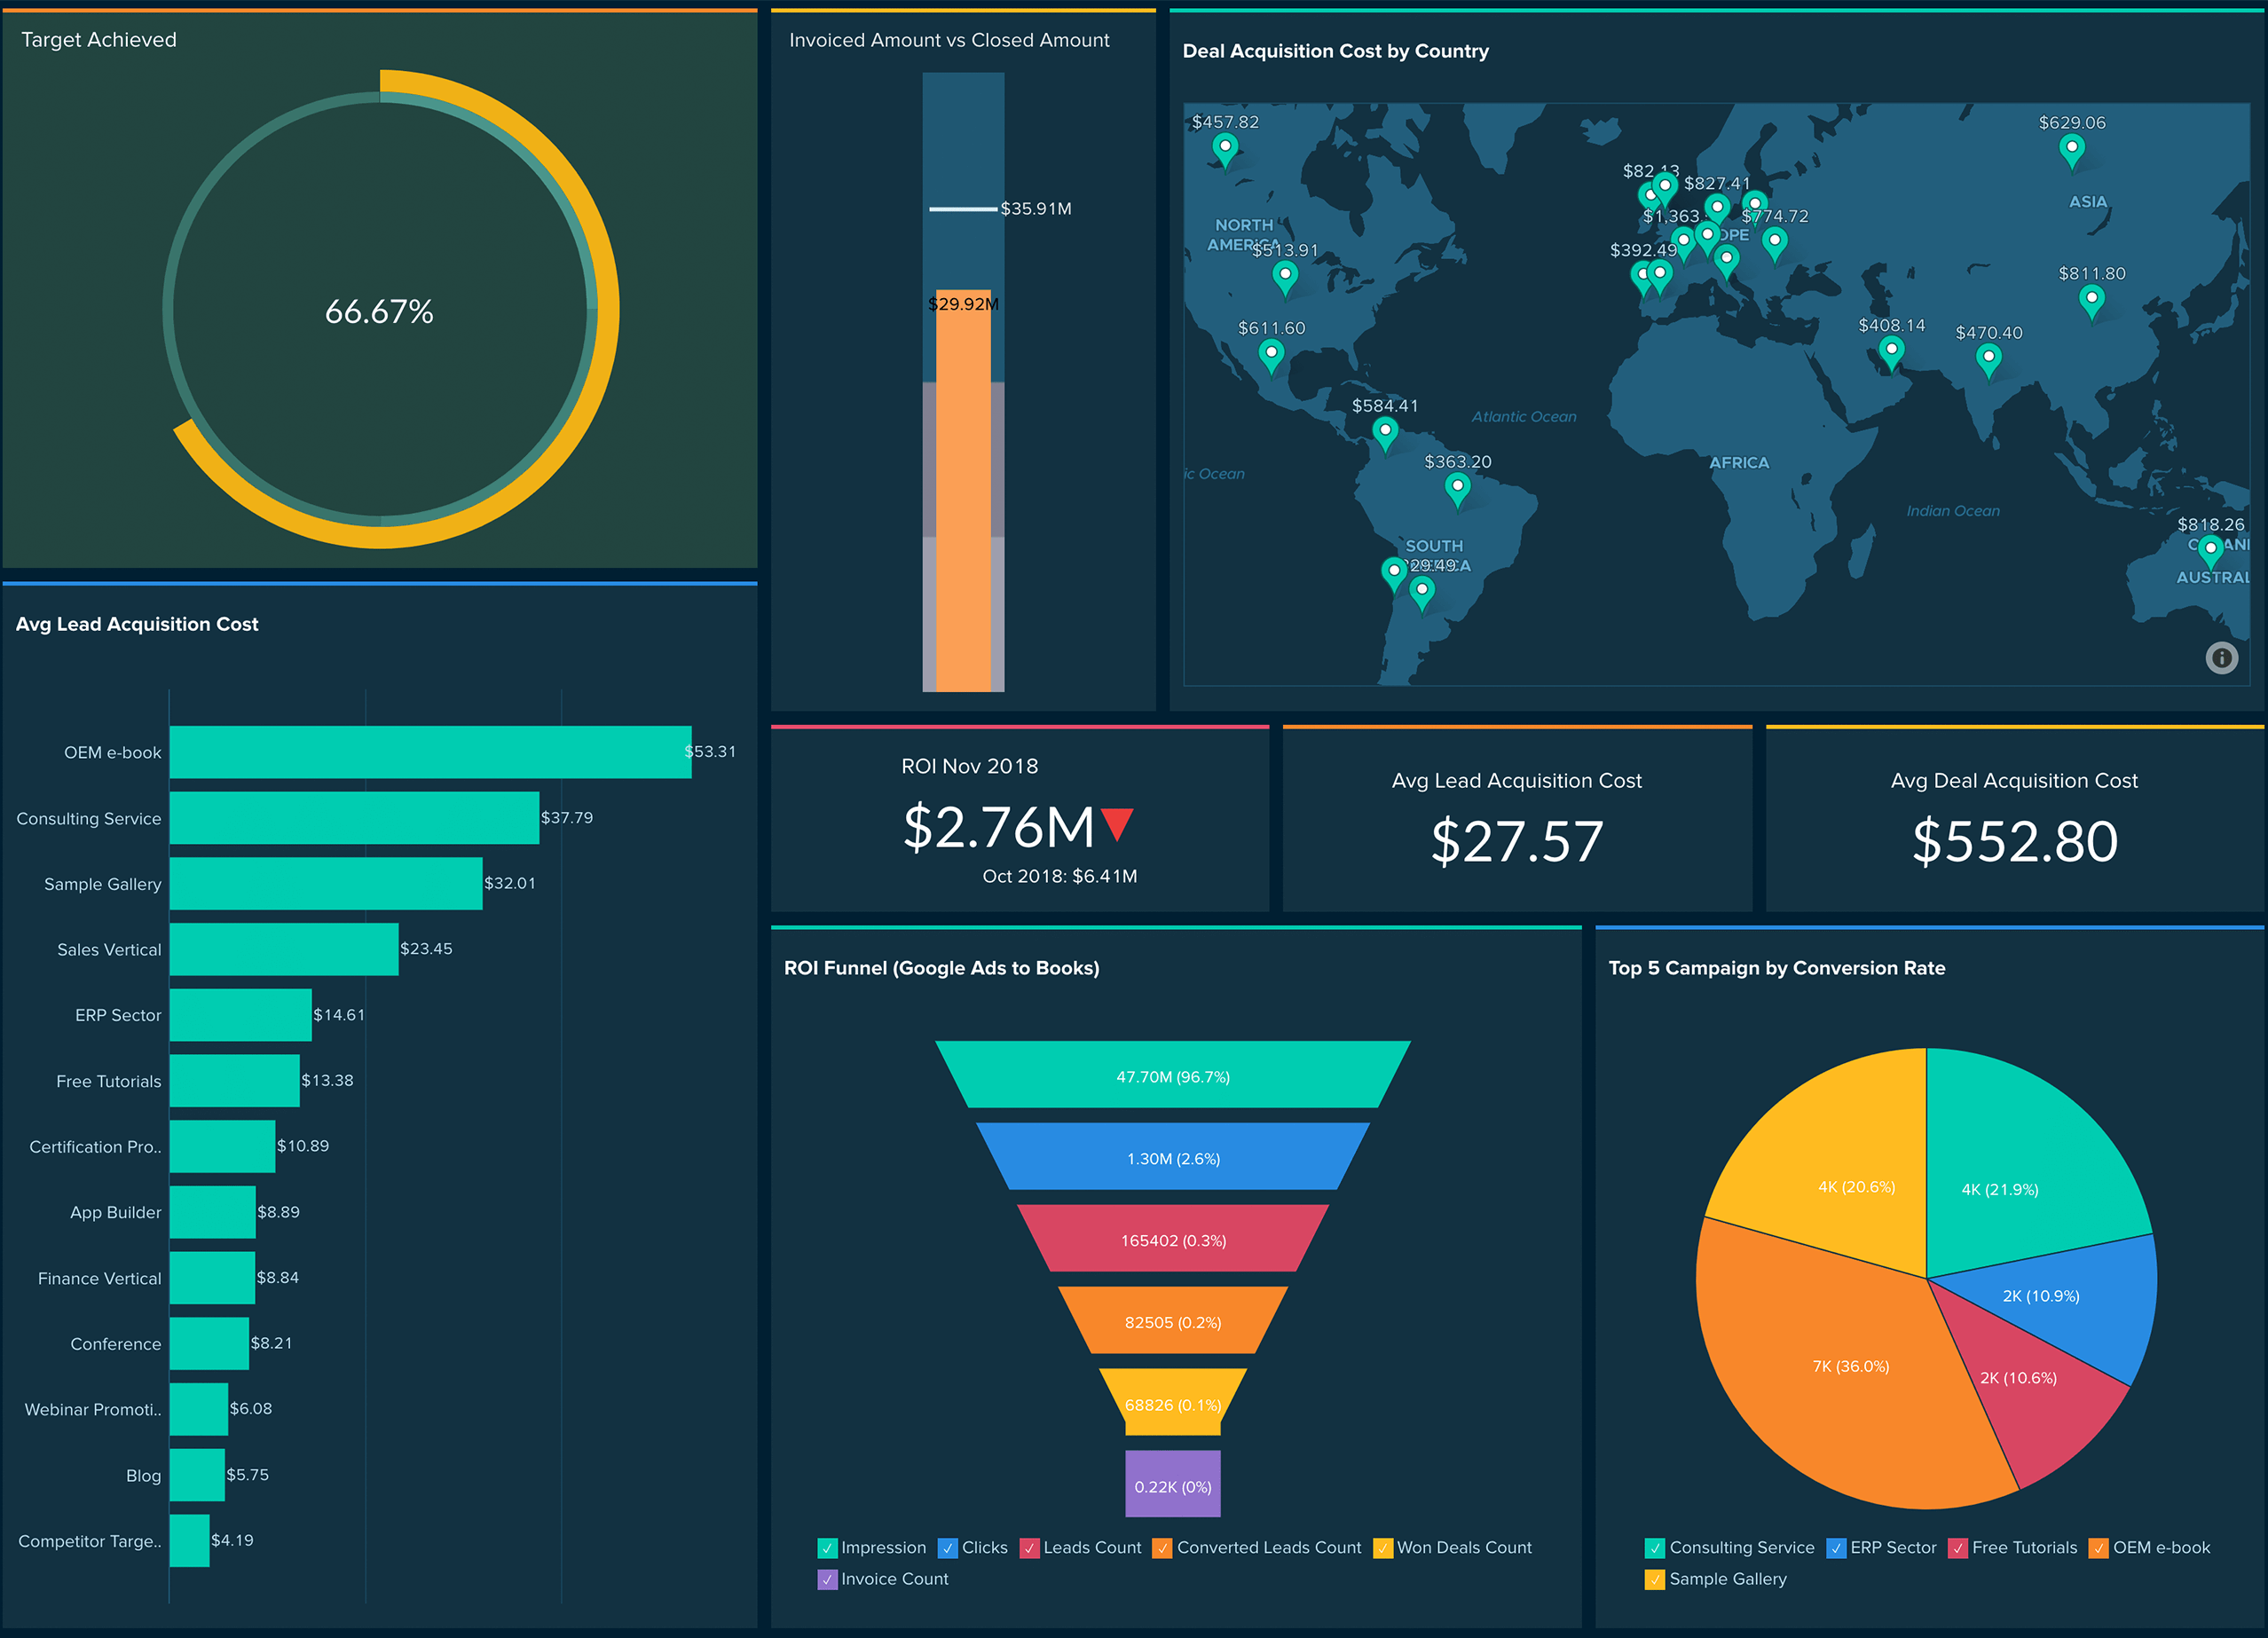
Gain actionable insights with Zoho Analytics, a comprehensive dashboard offering real-time data visualization and customizable reports for informed decisions.
Learn more 🡪
Get Started
Ready to get going with your digital signage?

Start managing your screens today with a free trial, or book a demo to find out how Fugo can work for your organization.