


VTS Analytics
VTS Analytics provides real-time insights into property performance, tenant engagement, and market trends, enhancing decision-making for real estate professionals.


BUSINESS INTELLIGENCE
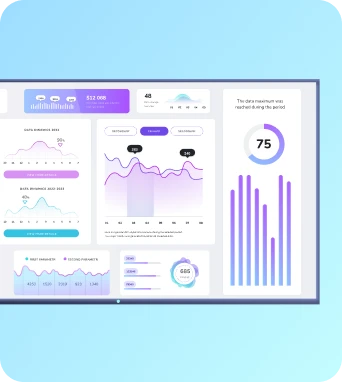
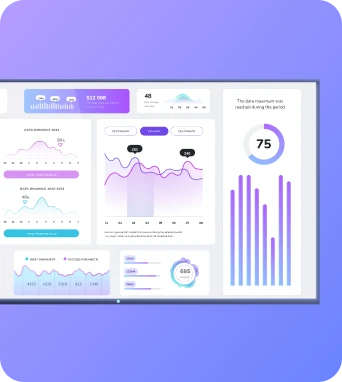
Comprehensive Property Insights
The VTS Analytics dashboard offers a detailed view of property performance metrics, including occupancy rates, lease expirations, and revenue forecasts. Users can easily track tenant engagement and identify trends that impact their portfolio. With intuitive visualizations, stakeholders can quickly assess the health of their assets and make informed decisions to optimize property management strategies.
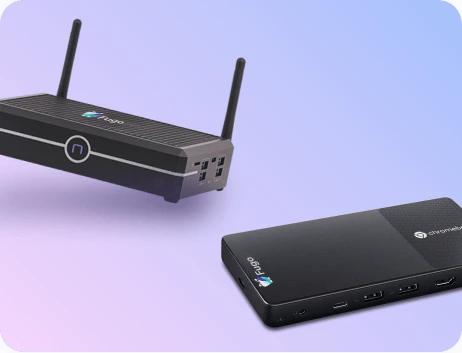
Learn more about workplace screens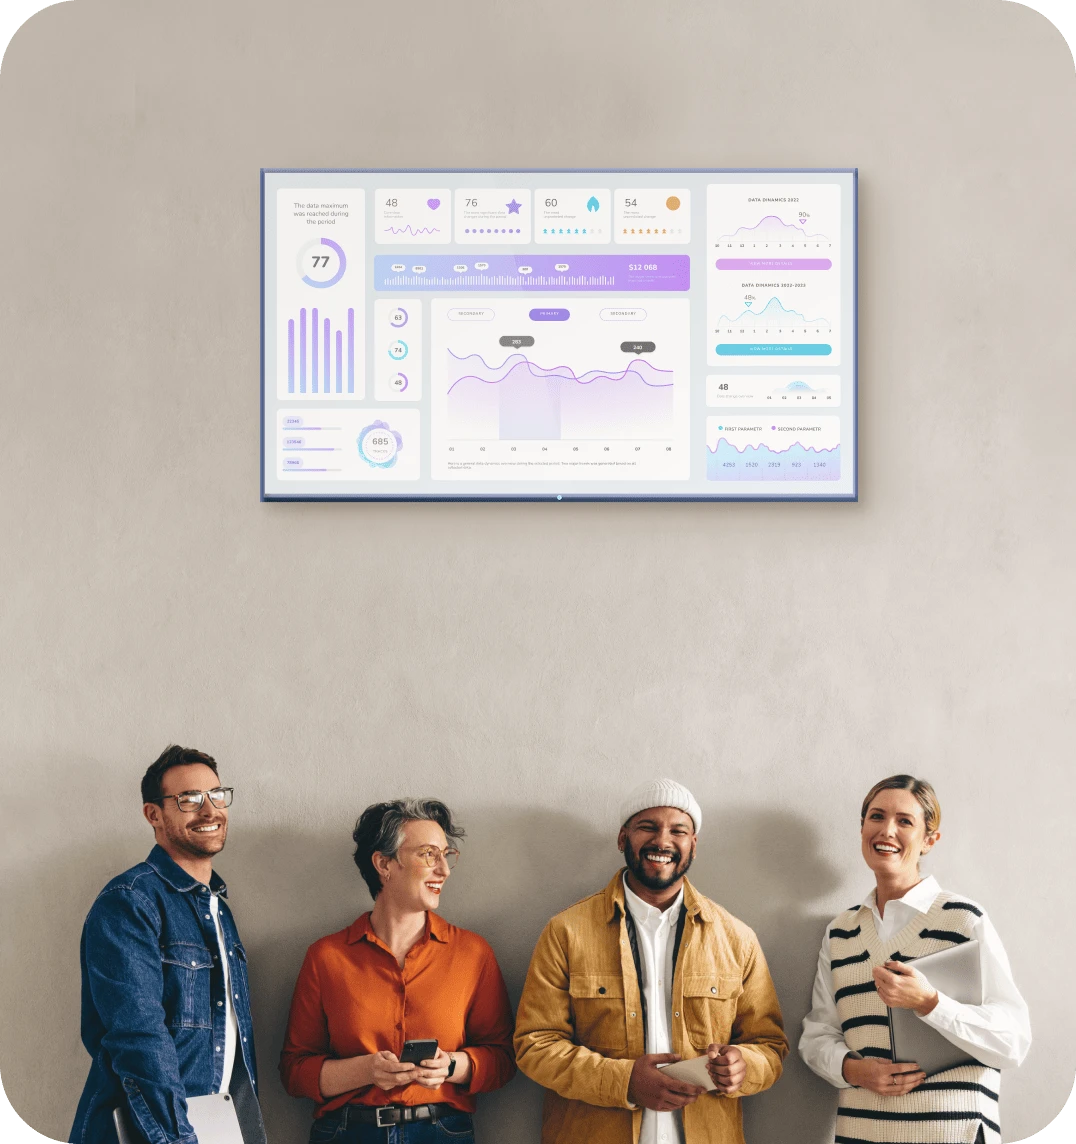
FEATURES
Key Features of VTS Analytics
Real-time data visualization
Customizable reporting tools
Tenant engagement tracking
Lease and revenue forecasting
Market trend analysis
Interactive property maps
Automated alerts and notifications
Integration with existing property management systems
User-friendly interface with mobile access
BUSINESS INTELLIGENCE
Who is this for?
VTS Analytics is designed for real estate professionals, including property managers, asset managers, and leasing agents, who need to make data-driven decisions. It is also beneficial for investors seeking to understand market dynamics and optimize their portfolios. Whether you're managing a single property or a vast portfolio, VTS Analytics provides the insights necessary to drive performance and growth.

Compliance
Compliance certifications

Fugo is SOC 2 Type II, SOC 3, and HIPAA compliant under the AICPA Service Organization Controls (SOC) framework and U.S. healthcare compliance standards. Our SOC 3 report is publicly available for download, and customers can request to review our SOC 2 Type II and HIPAA Self Assessment reports.
Features
Share VTS Analytics dashboards at scale throughout your organization
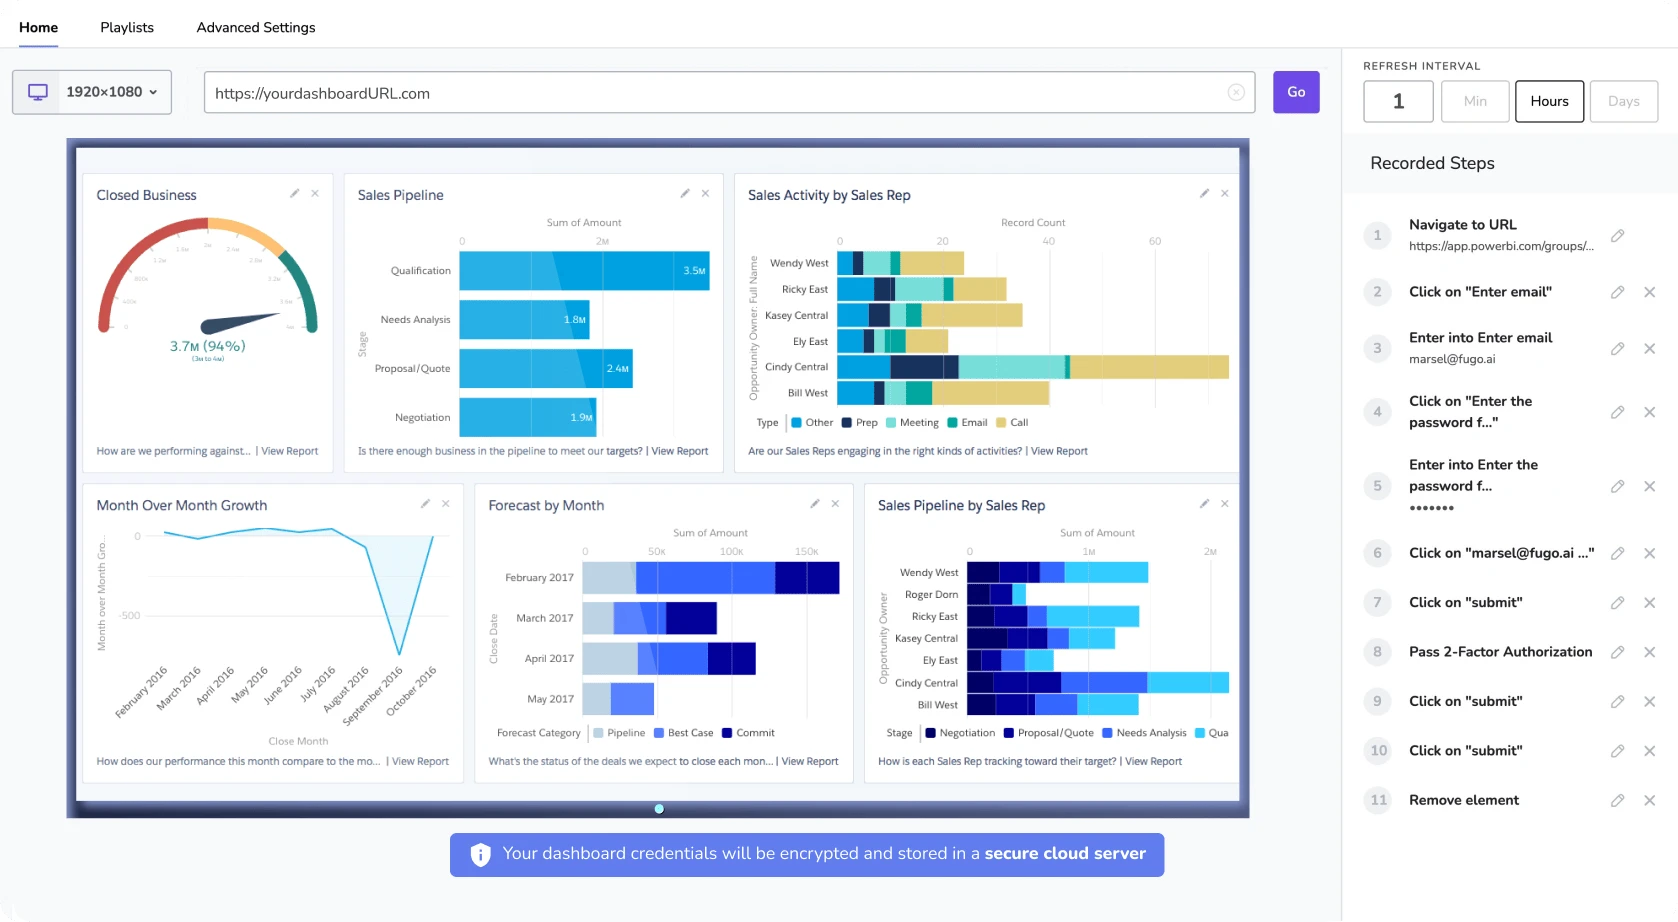
Built for stable performance
Dashboards are displayed via live snapshots, reducing the computing power needed to display them.
Customize the data refresh rate
Adjust the data refresh rate so that Fugo can update your dashboard on screen as often as you need.
Make data TV-screen friendly
Crop & customize your saved dashboards in Fugo to display more effectively on TV screens.
Send it at the right time & place
Make sure the right data reaches the right teams on screens located across departments & locations.
Frequently Asked Questions


Need help?
Similar Dashboards
View all dashboards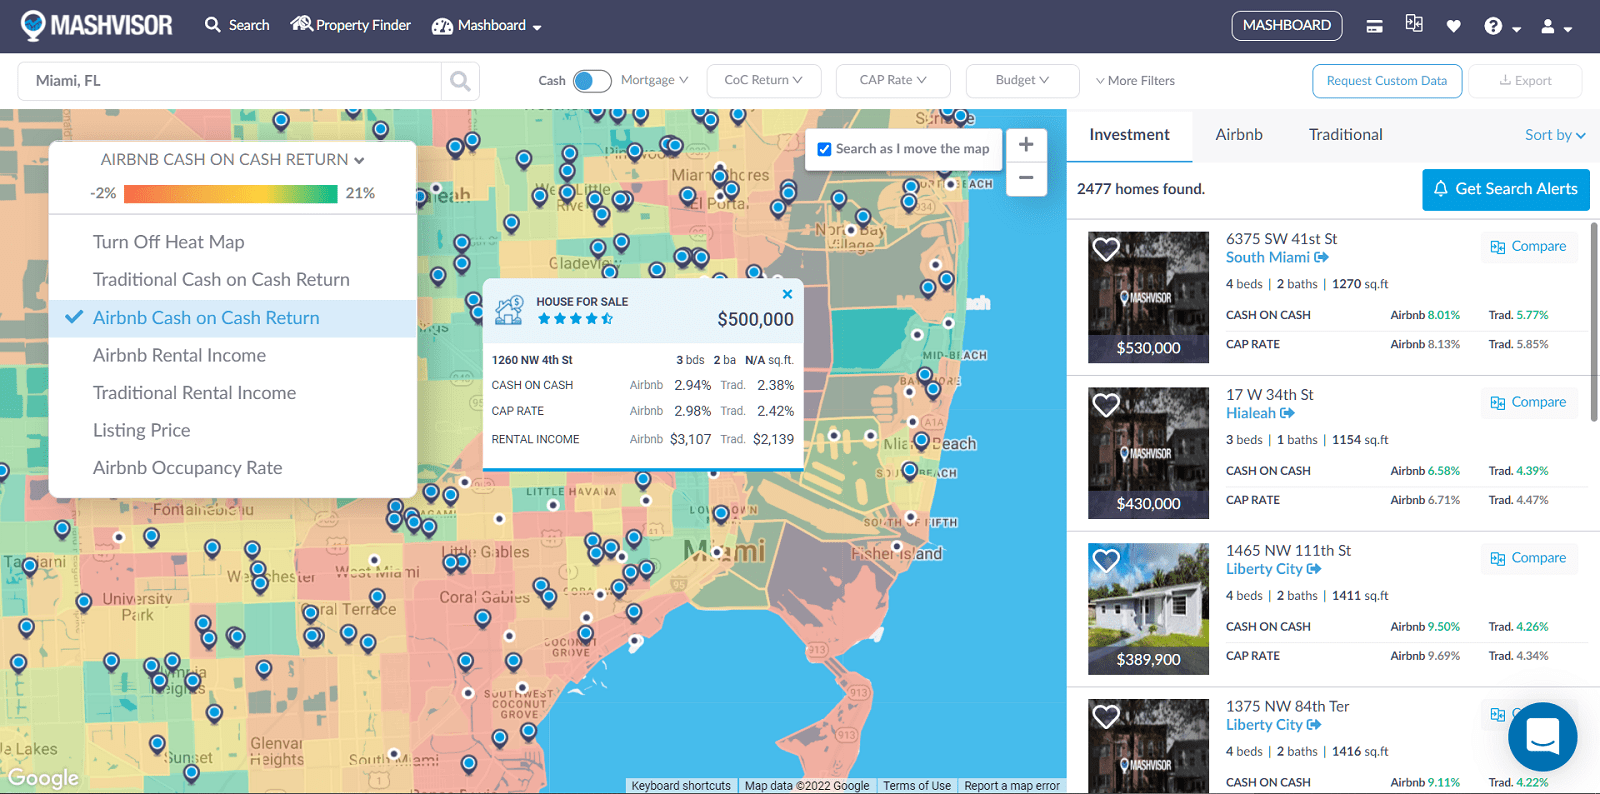
Reonomy
Explore Reonomy's comprehensive dashboard for real estate insights, offering data-driven analytics and property intelligence in a user-friendly interface.
Learn more 
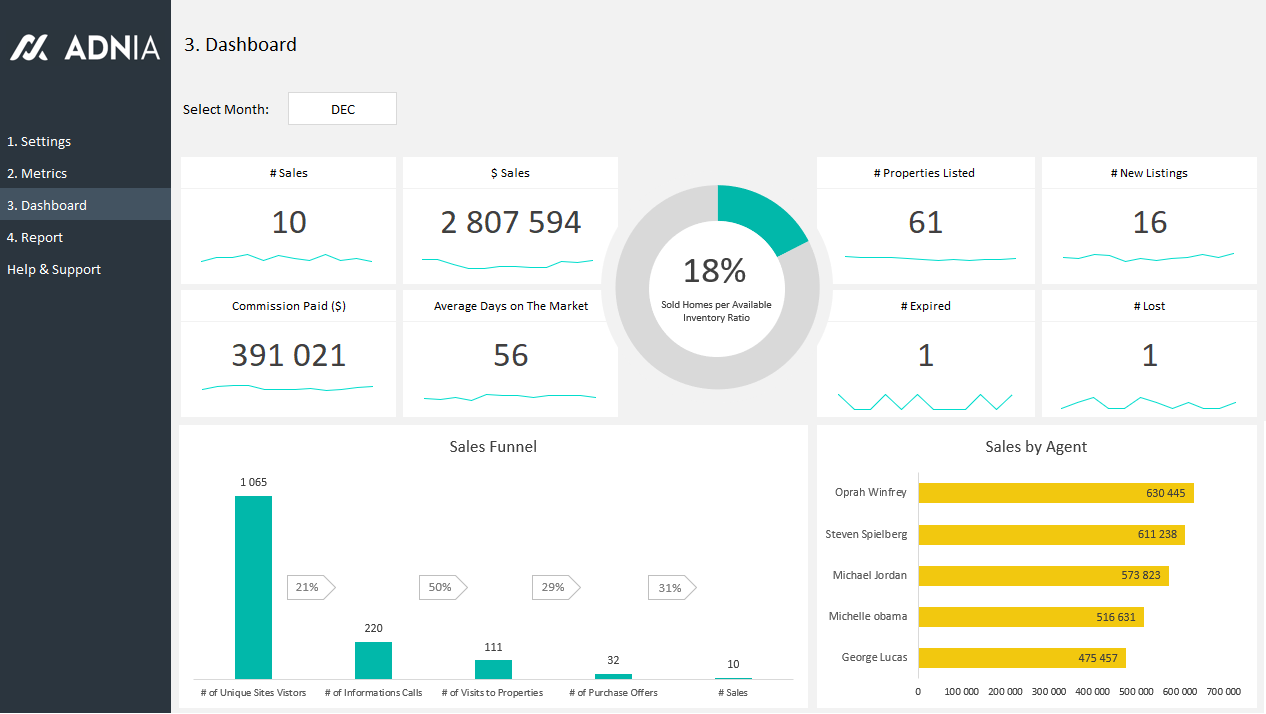
Tableau Real Estate Dashboards
Explore comprehensive insights into real estate trends, property values, and market dynamics with Tableau Real Estate Dashboards for strategic decision-making.
Learn more 
Yardi Matrix
Yardi Matrix dashboard provides comprehensive real estate data analytics, offering insights into market trends and property performance.
Learn more Get Started
Ready to get going with your digital signage?
Start managing your screens today with a free trial, or book a demo to find out how Fugo can work for your organization.