


Prometheus
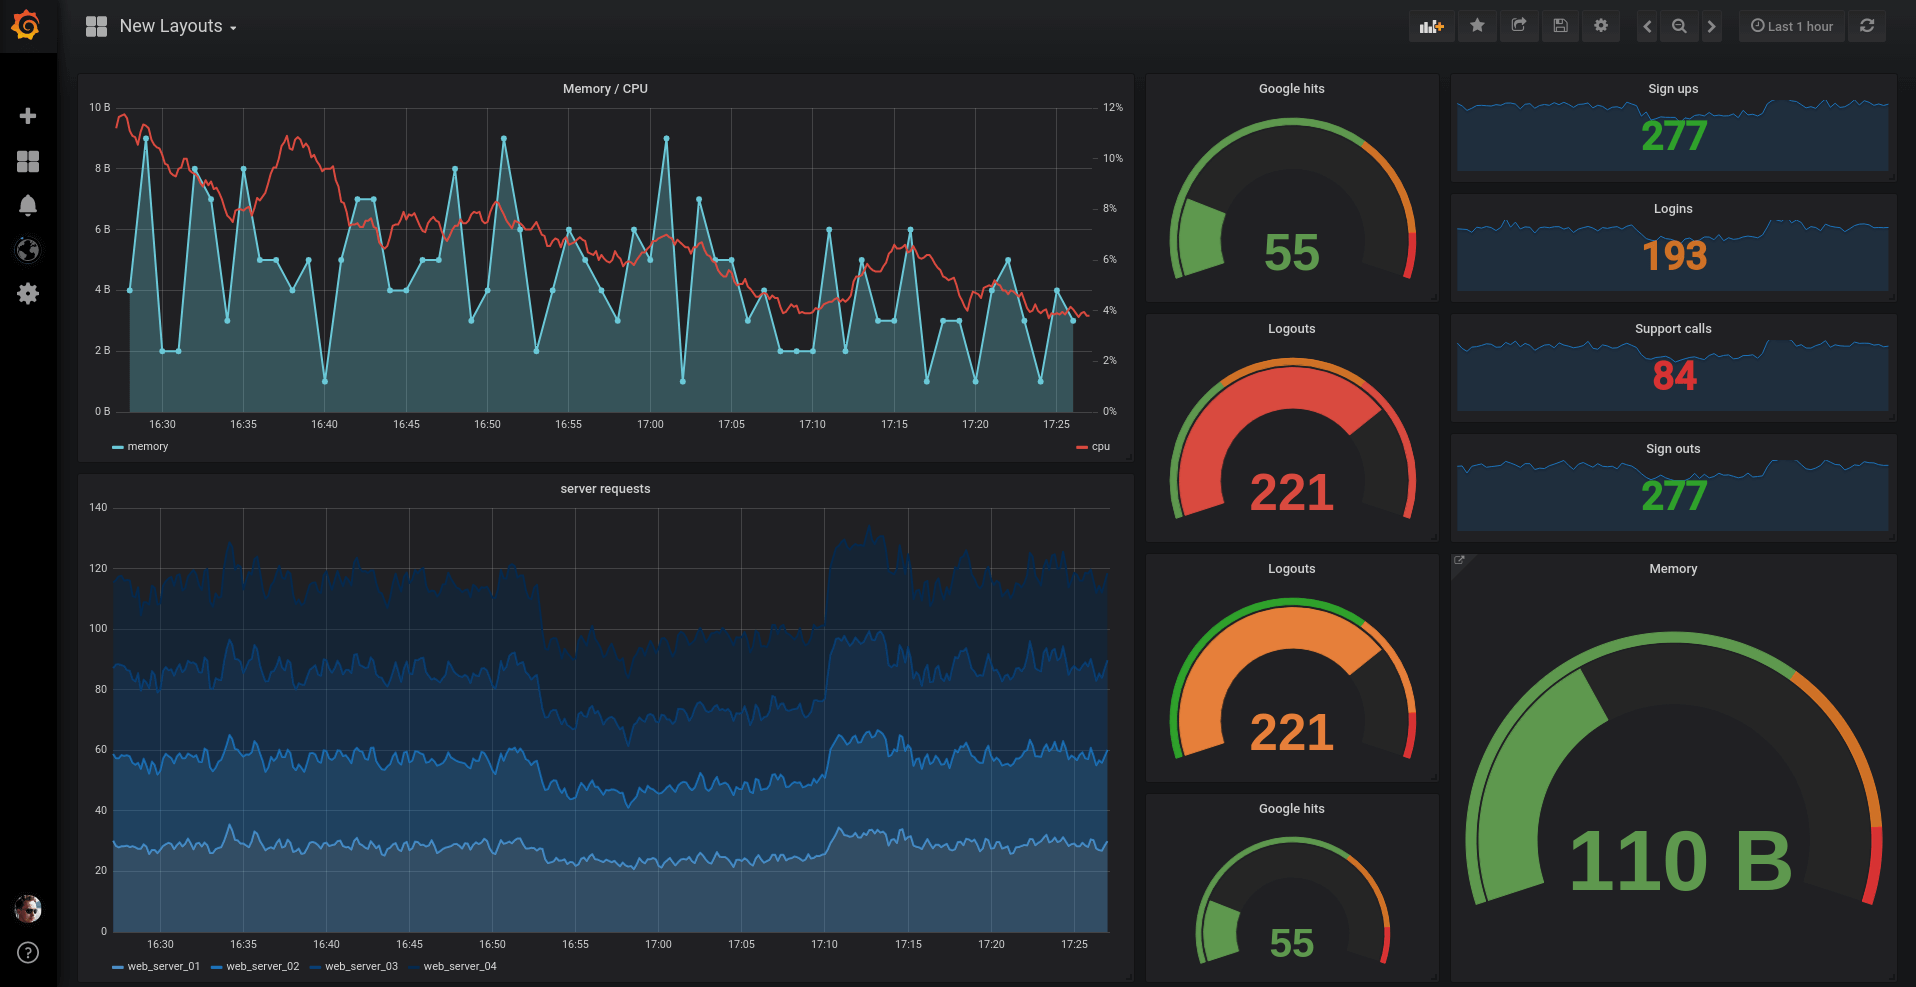
Monitor and visualize metrics efficiently with the Prometheus dashboard, offering real-time insights and alerting for system performance and reliability.


BUSINESS INTELLIGENCE
Comprehensive Metrics Monitoring
The Prometheus dashboard provides a robust platform for monitoring a wide range of metrics across your infrastructure. It collects data from various sources, allowing you to visualize trends, identify anomalies, and gain insights into system performance. With its powerful querying language, PromQL, you can create custom queries to extract specific metrics and display them in an intuitive format. This makes it easier to keep track of resource usage, application performance, and overall system health.
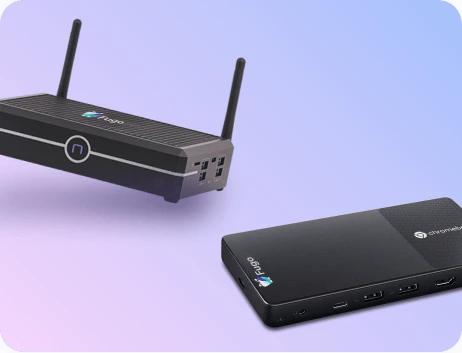
Learn more about workplace screens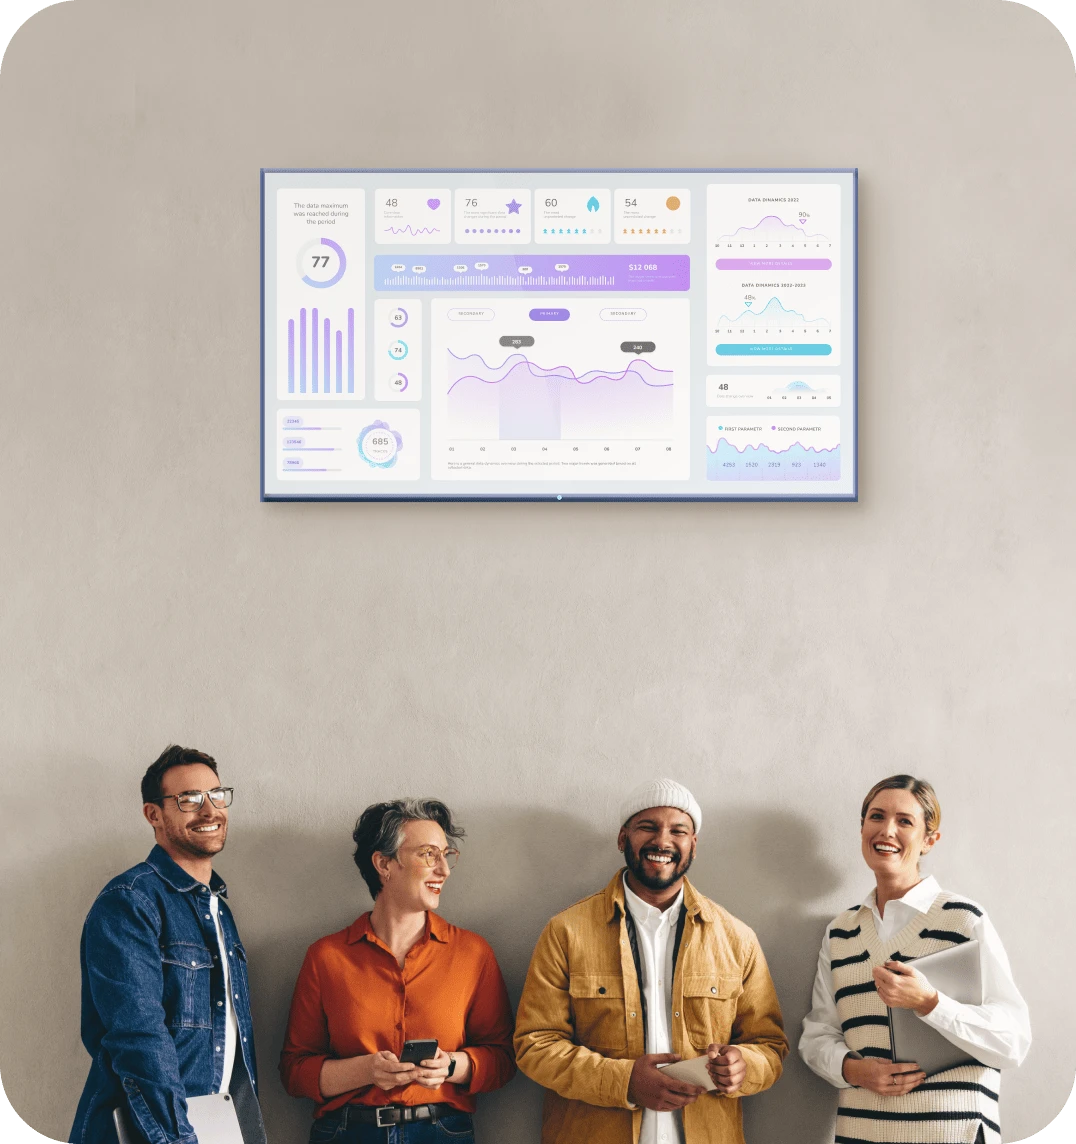
FEATURES
Key Features
Real-time data visualization
Customizable alerting system
Multi-dimensional data model
Powerful query language (PromQL)
Seamless integration with Grafana
High availability and scalability
Support for multiple exporters
Easy setup and configuration
Extensive community support and documentation
BUSINESS INTELLIGENCE
Who is this for?
The Prometheus dashboard is ideal for DevOps teams, system administrators, and IT professionals who need to monitor and manage the performance of their infrastructure. It's also beneficial for developers looking to gain insights into application performance and resource usage. Organizations of all sizes, from startups to large enterprises, can leverage this tool to ensure their systems are running optimally and to quickly address any issues that arise.

Compliance
Compliance certifications

Fugo is SOC 2 Type II, SOC 3, and HIPAA compliant under the AICPA Service Organization Controls (SOC) framework and U.S. healthcare compliance standards. Our SOC 3 report is publicly available for download, and customers can request to review our SOC 2 Type II and HIPAA Self Assessment reports.
Features
Share Prometheus dashboards at scale throughout your organization
Built for stable performance
Dashboards are displayed via live snapshots, reducing the computing power needed to display them.
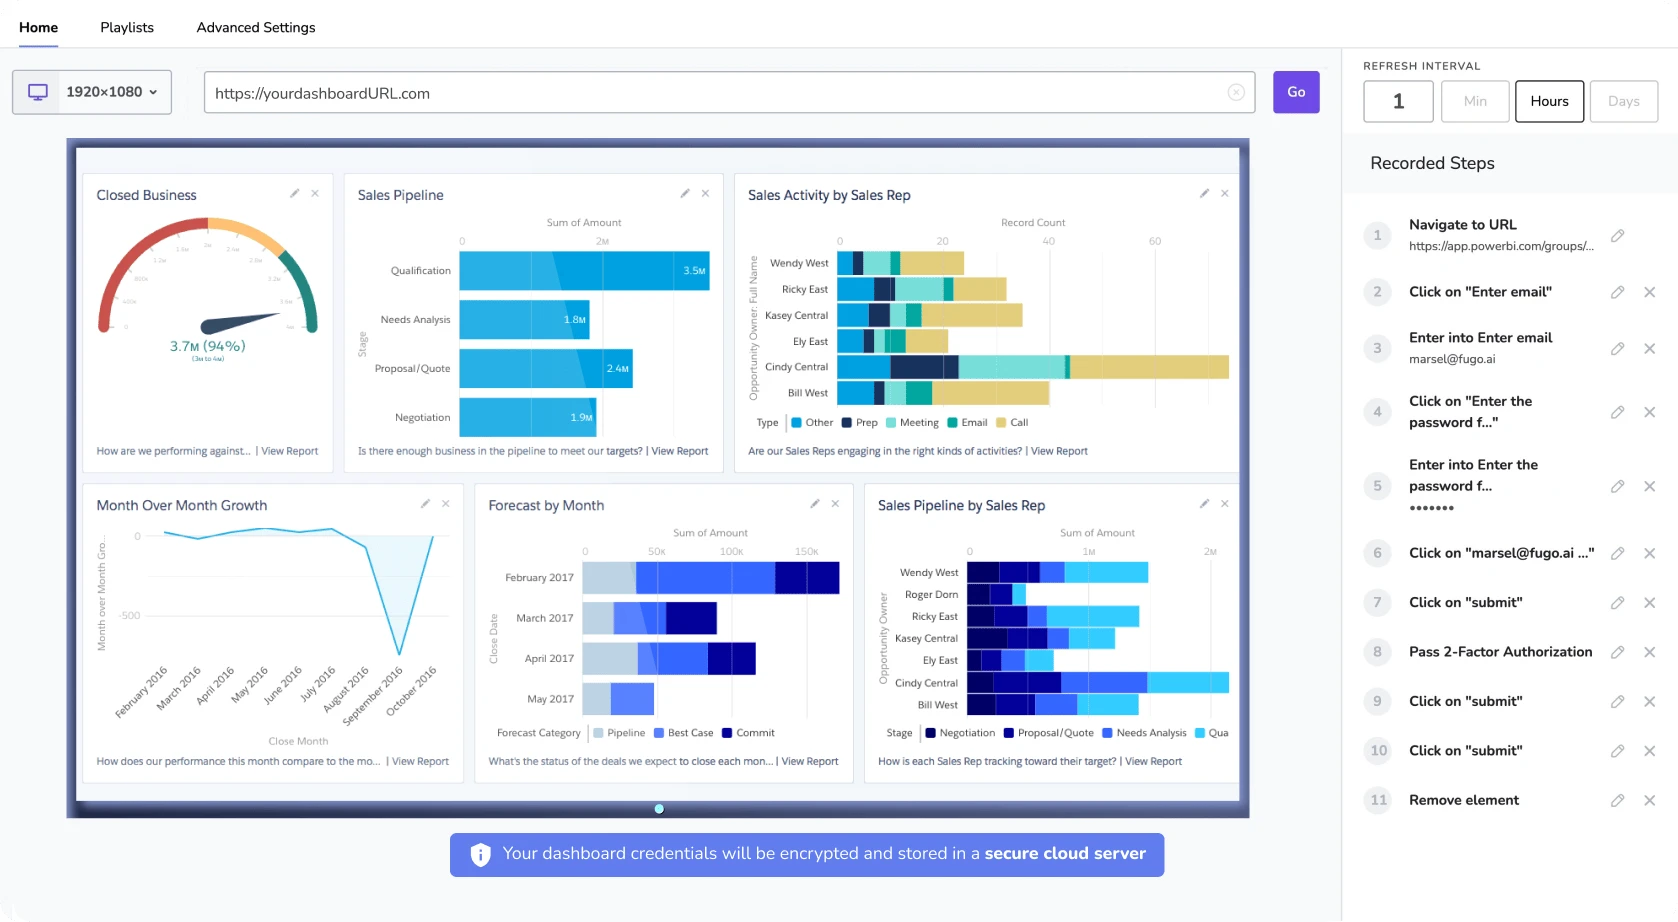
Customize the data refresh rate
Adjust the data refresh rate so that Fugo can update your dashboard on screen as often as you need.
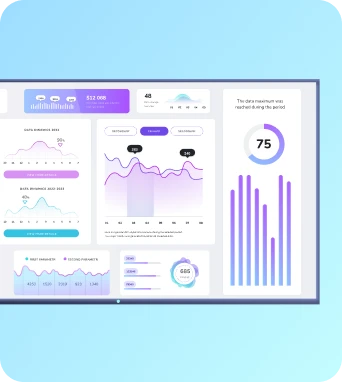
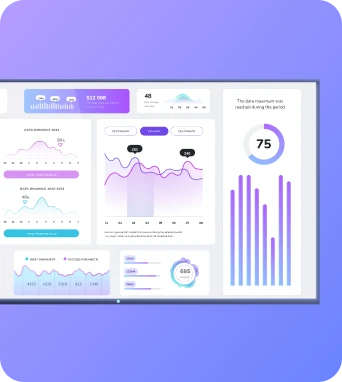
Make data TV-screen friendly
Crop & customize your saved dashboards in Fugo to display more effectively on TV screens.
Send it at the right time & place
Make sure the right data reaches the right teams on screens located across departments & locations.
Frequently Asked Questions


Need help?
Similar Dashboards
View all dashboards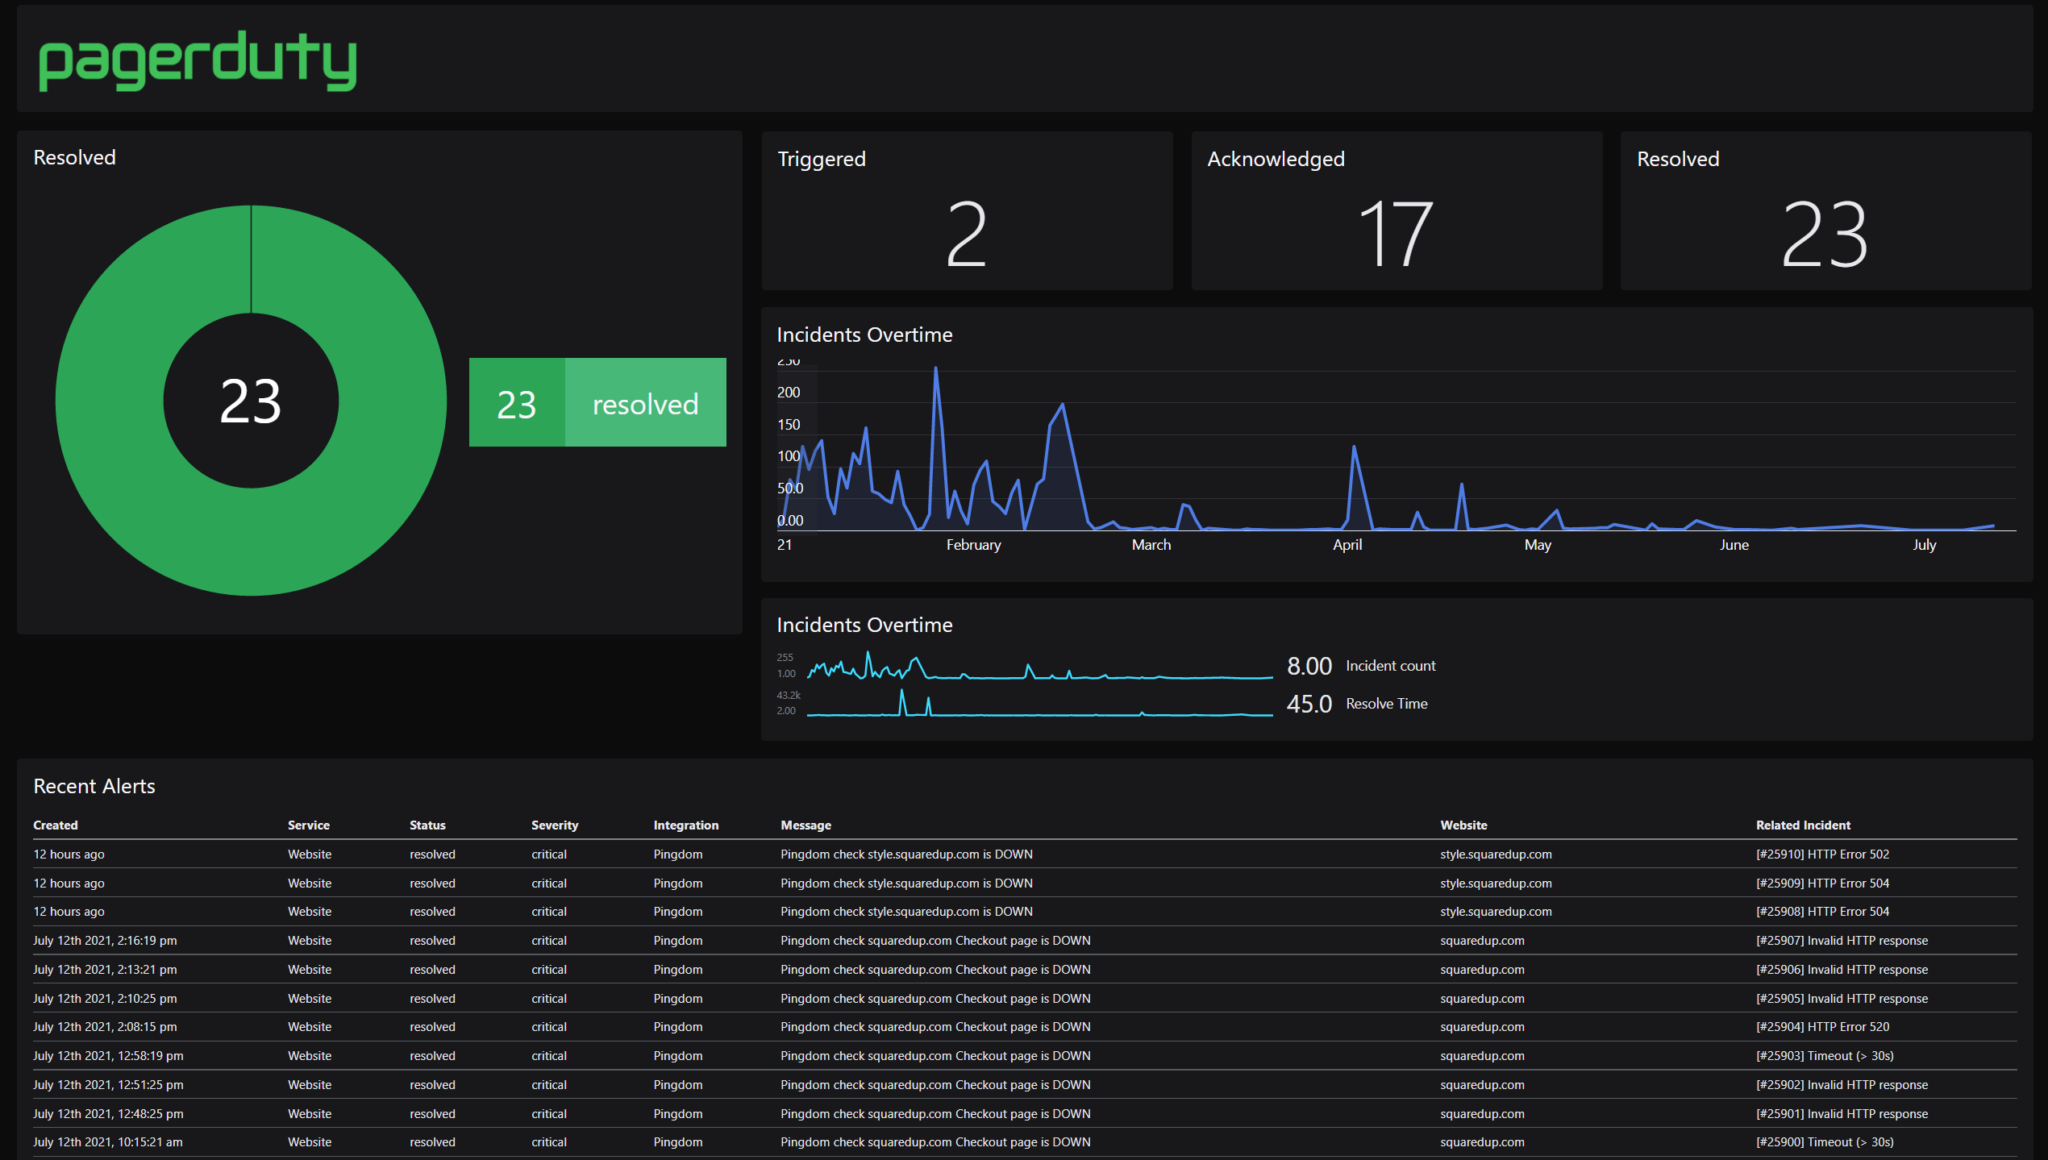
PagerDuty
Monitor and manage incidents effectively with the PagerDuty dashboard, offering real-time alerts, analytics, and seamless integration for optimal response.
Learn more 

Pentaho
Leverage Pentaho's dashboard for comprehensive data integration, analytics, and visualization to drive informed business decisions efficiently.
Learn more 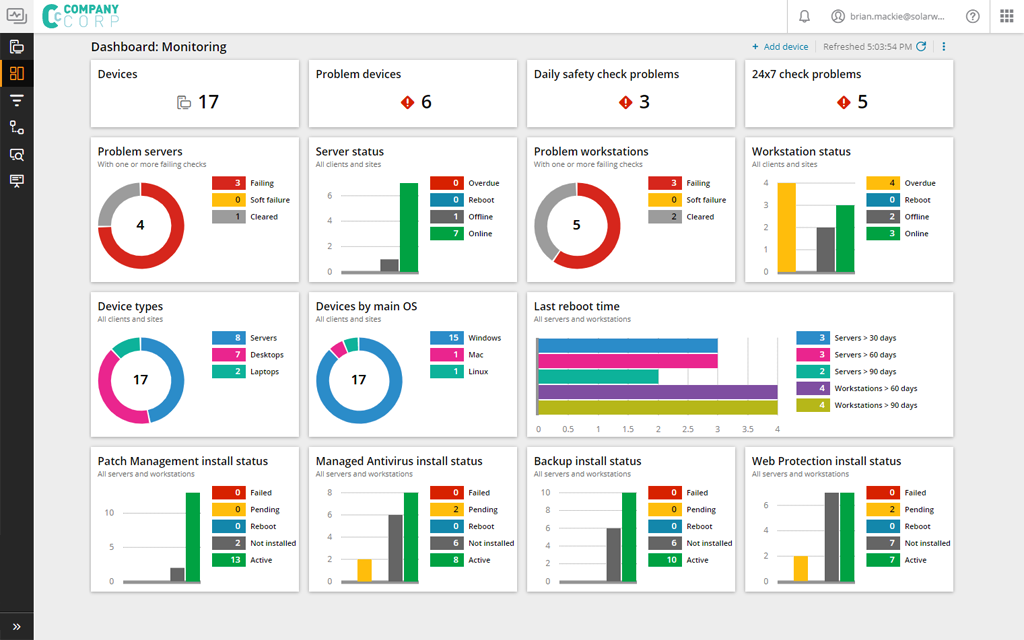
SolarWinds
Monitor and manage your IT infrastructure efficiently with the SolarWinds dashboard, offering real-time insights and comprehensive performance metrics.
Learn more Get Started
Ready to get going with your digital signage?
Start managing your screens today with a free trial, or book a demo to find out how Fugo can work for your organization.