BUSINESS INTELLIGENCE
Sales Performance Analysis
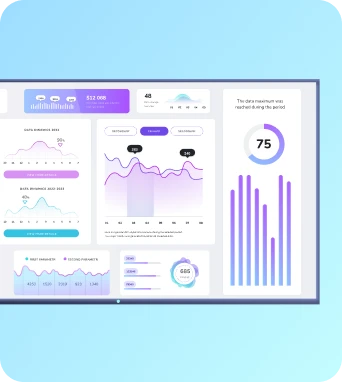
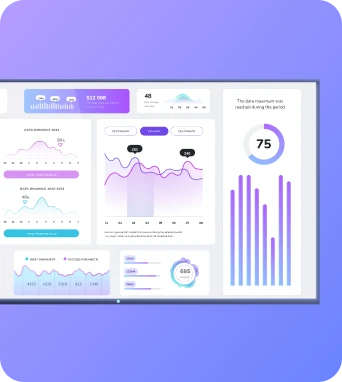
This section of the Power BI dashboard provides a comprehensive view of sales data, allowing users to track sales performance over time. It includes visualizations such as line charts and bar graphs to display sales trends, comparisons against targets, and regional performance breakdowns. Users can filter data by time period, product category, or sales region to gain specific insights and make informed business decisions.
Learn more about workplace screens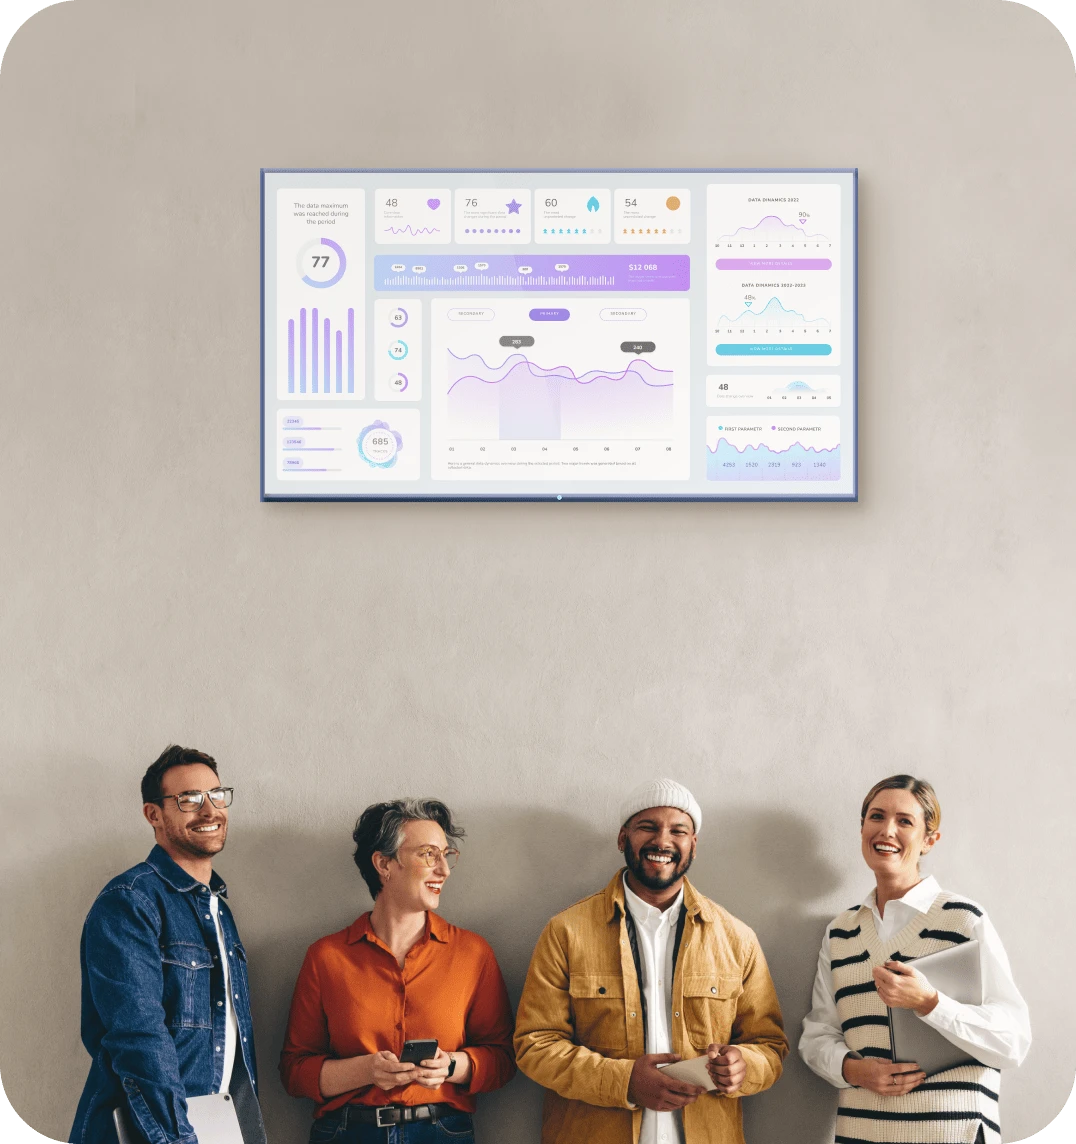
FEATURES
Key Features
Interactive data visualizations for dynamic analysis
Real-time data updates for accurate insights
Customizable filters for tailored data views
Drill-down capabilities for detailed examination
Integration with multiple data sources
User-friendly interface with intuitive navigation
Mobile compatibility for on-the-go access
Secure data handling with role-based access
Comprehensive reporting tools for sharing insights
BUSINESS INTELLIGENCE
Who is this for?
This Power BI dashboard is designed for business analysts, sales managers, and executives who need to monitor and analyze sales and financial data. It is ideal for organizations seeking to enhance their decision-making processes by leveraging data-driven insights. Whether you are in retail, finance, or any industry reliant on sales metrics, this dashboard provides the tools necessary to understand and optimize business performance.

Compliance
Compliance certifications
Fugo is SOC 2 Type II, SOC 3, and HIPAA compliant under the AICPA Service Organization Controls (SOC) framework and U.S. healthcare compliance standards. Our SOC 3 report is publicly available for download, and customers can request to review our SOC 2 Type II and HIPAA Self Assessment reports.
Features
Share Power BI dashboards at scale throughout your organization
Built for stable performance
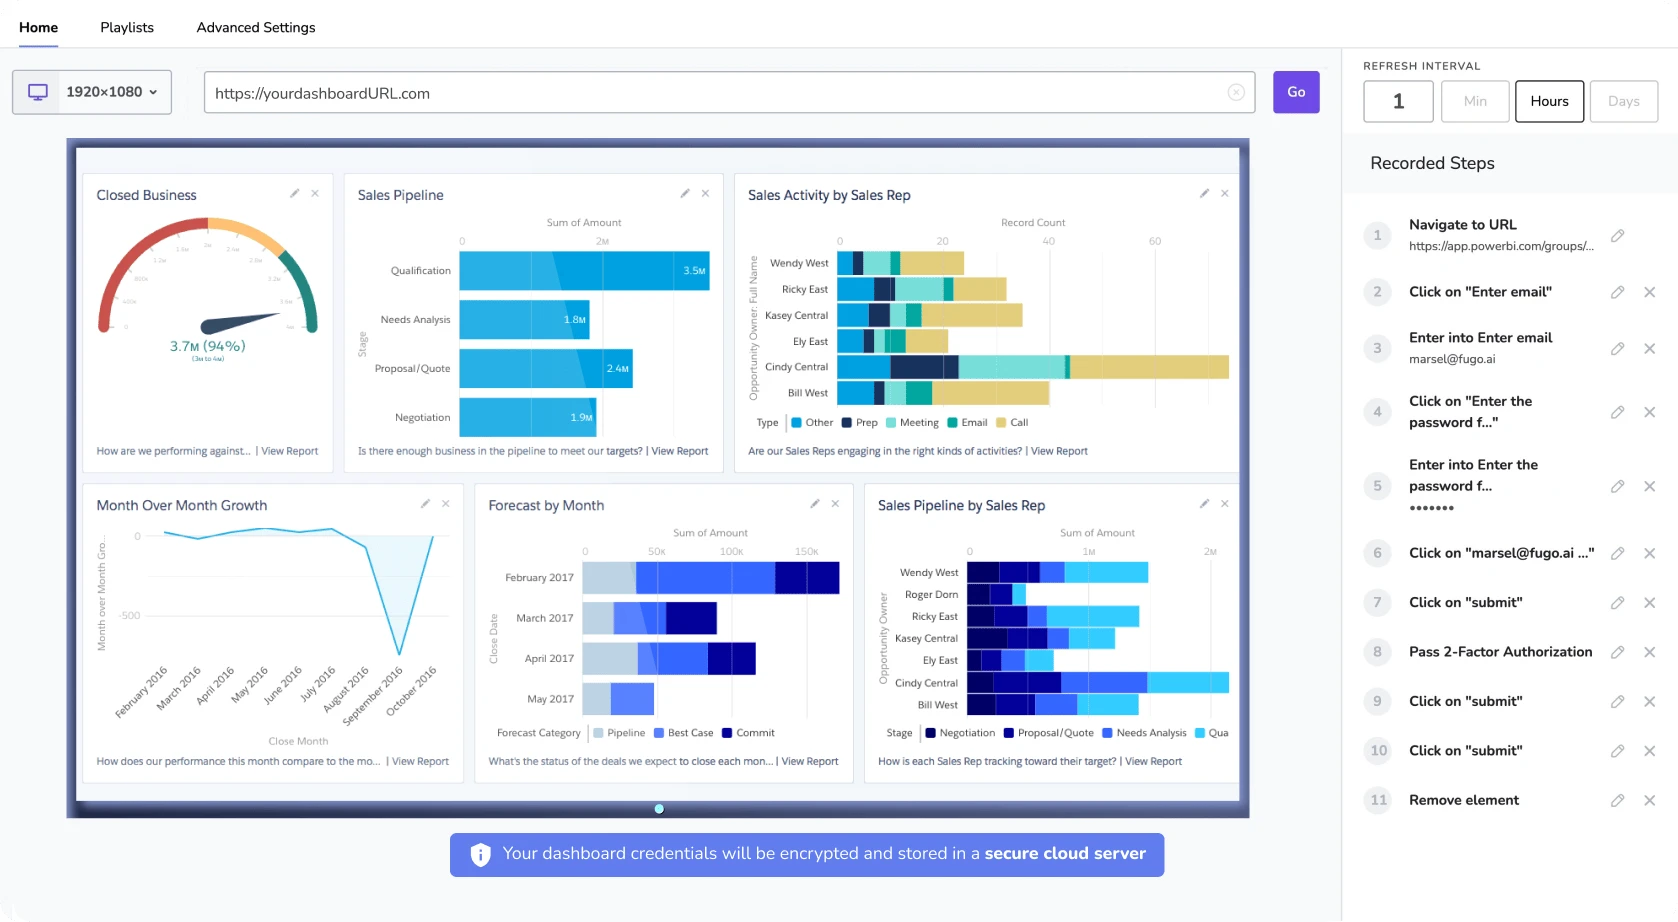
Dashboards are displayed via live snapshots, reducing the computing power needed to display them.
Customize the data refresh rate
Adjust the data refresh rate so that Fugo can update your dashboard on screen as often as you need.
Make data TV-screen friendly
Crop & customize your saved dashboards in Fugo to display more effectively on TV screens.
Send it at the right time & place
Make sure the right data reaches the right teams on screens located across departments & locations.
Frequently Asked Questions
How do I connect my data to the Power BI dashboard?
You can connect your data by using Power BI's data connectors, which support a wide range of sources including Excel, SQL Server, and cloud services.
Can I share this dashboard with my team?
Yes, Power BI allows you to share dashboards with team members through Power BI service, ensuring collaborative access and insights.
Is it possible to access the dashboard on mobile devices?
Absolutely, Power BI offers mobile apps for iOS and Android, enabling you to view and interact with dashboards on the go.
How often does the data refresh in the dashboard?
Data refresh frequency can be set according to your needs, ranging from real-time updates to scheduled daily or weekly refreshes.
Need help?
Similar Dashboards
View all dashboards
Oracle Analytics Cloud
Unlock insights with Oracle Analytics Cloud, offering real-time data visualization, predictive analytics, and collaborative features for informed decisions.
Learn more 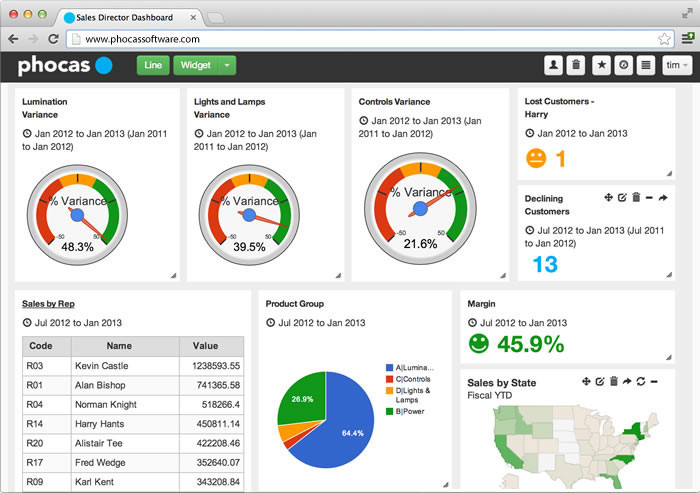
Phocas
Phocas dashboard offers intuitive data visualization and analysis tools, empowering businesses to make informed decisions with real-time insights.
Learn more 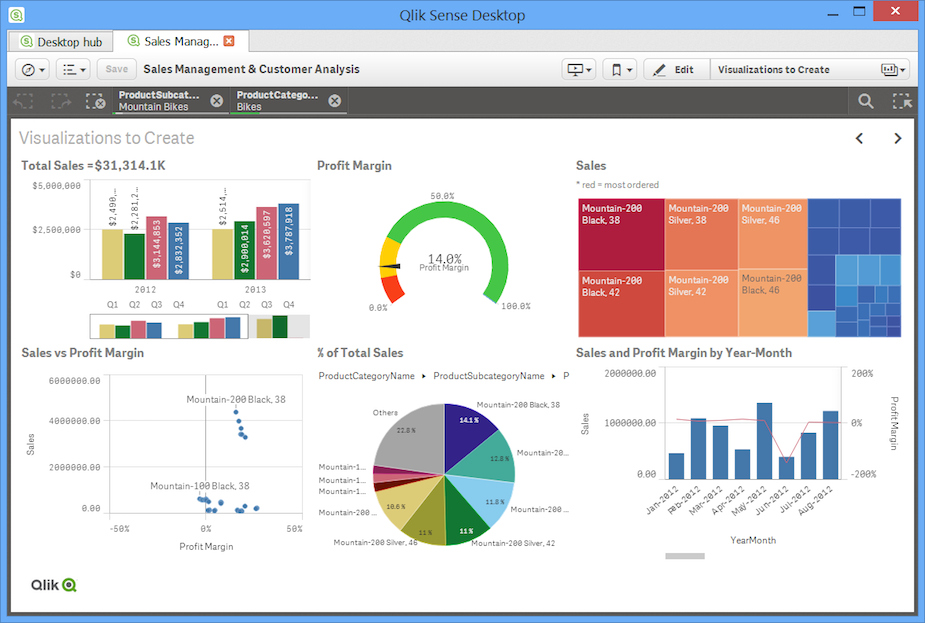
Qlik Sense
Visualize and analyze your data effortlessly with the Qlik Sense dashboard, offering interactive insights and real-time analytics for informed decision-making.
Learn more Get Started
Ready to get going with your digital signage?
Start managing your screens today with a free trial, or book a demo to find out how Fugo can work for your organization.

