


Loggly
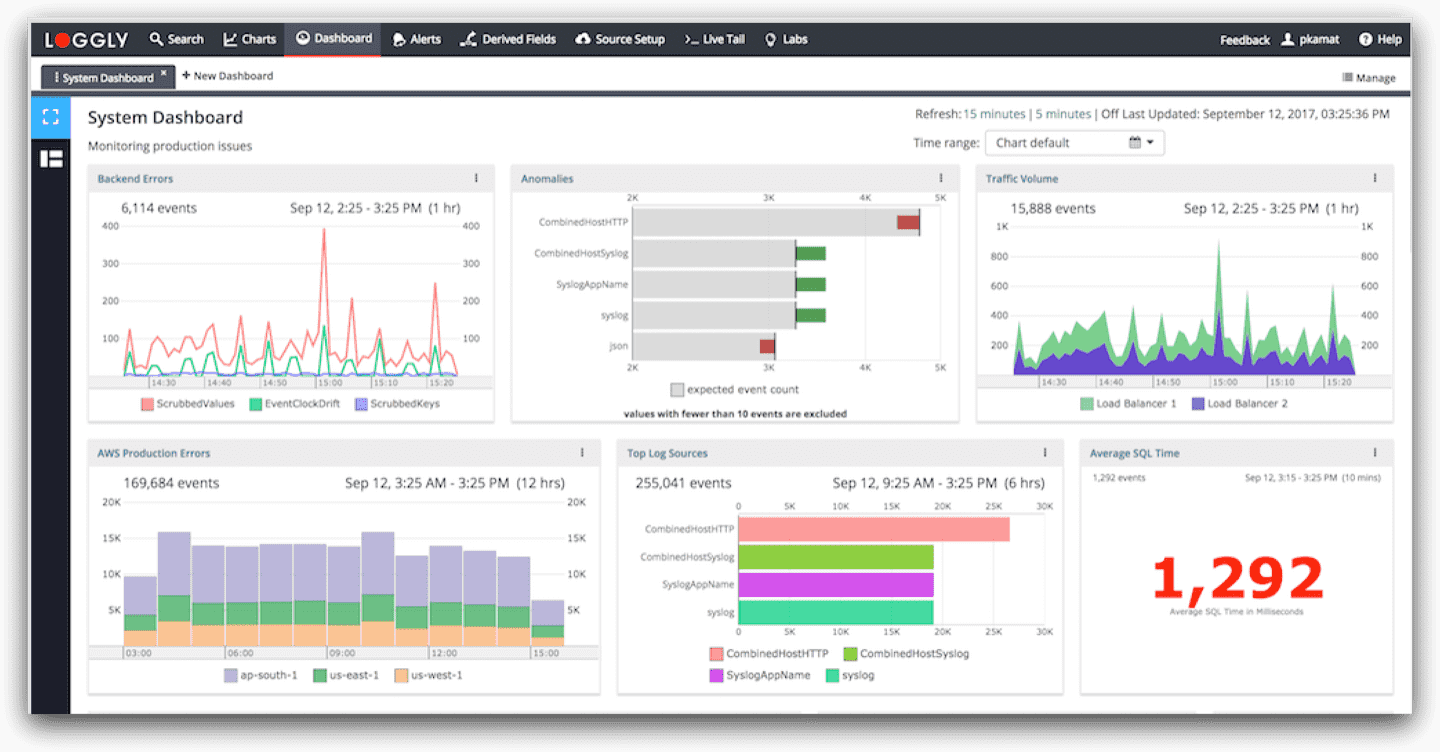
Gain insights into your log data with Loggly's intuitive dashboard, offering real-time analytics, visualization, and monitoring for enhanced troubleshooting.


BUSINESS INTELLIGENCE
Real-Time Log Analysis
The Loggly dashboard provides powerful real-time log analysis, enabling users to monitor and analyze log data as it streams in. This allows for immediate detection of issues and anomalies, facilitating quicker responses to potential problems. Users can filter, search, and visualize log data to uncover patterns and trends that are crucial for maintaining system health and performance.
Learn more about workplace screens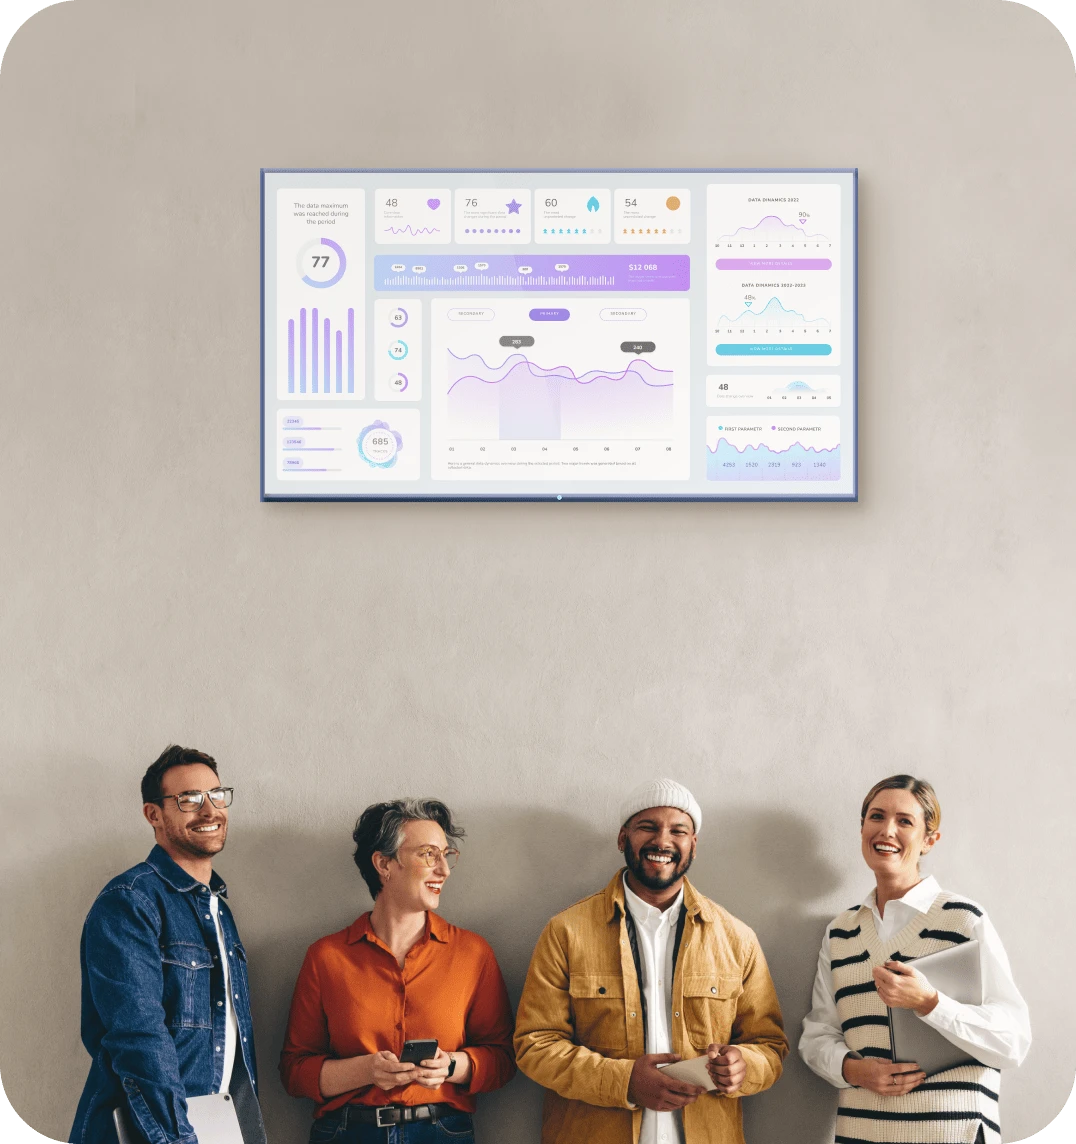
FEATURES
Key Features
Real-time log monitoring
Customizable dashboards
Advanced search and filtering options
Automated alerting system
Interactive visualizations and charts
Integration with popular tools and platforms
Anomaly detection and trend analysis
Multi-user access with role-based permissions
Scalable architecture for handling large volumes of data
BUSINESS INTELLIGENCE
Who is this for?
The Loggly dashboard is designed for IT professionals, system administrators, and DevOps teams who need to monitor and analyze log data efficiently. It's ideal for organizations that require real-time insights into their system's performance and health. Whether you're managing a small startup or a large enterprise, Loggly offers the tools necessary to streamline log management and improve operational efficiency.

Compliance
Compliance certifications

Fugo is SOC 2 Type II, SOC 3, and HIPAA compliant under the AICPA Service Organization Controls (SOC) framework and U.S. healthcare compliance standards. Our SOC 3 report is publicly available for download, and customers can request to review our SOC 2 Type II and HIPAA Self Assessment reports.
Features
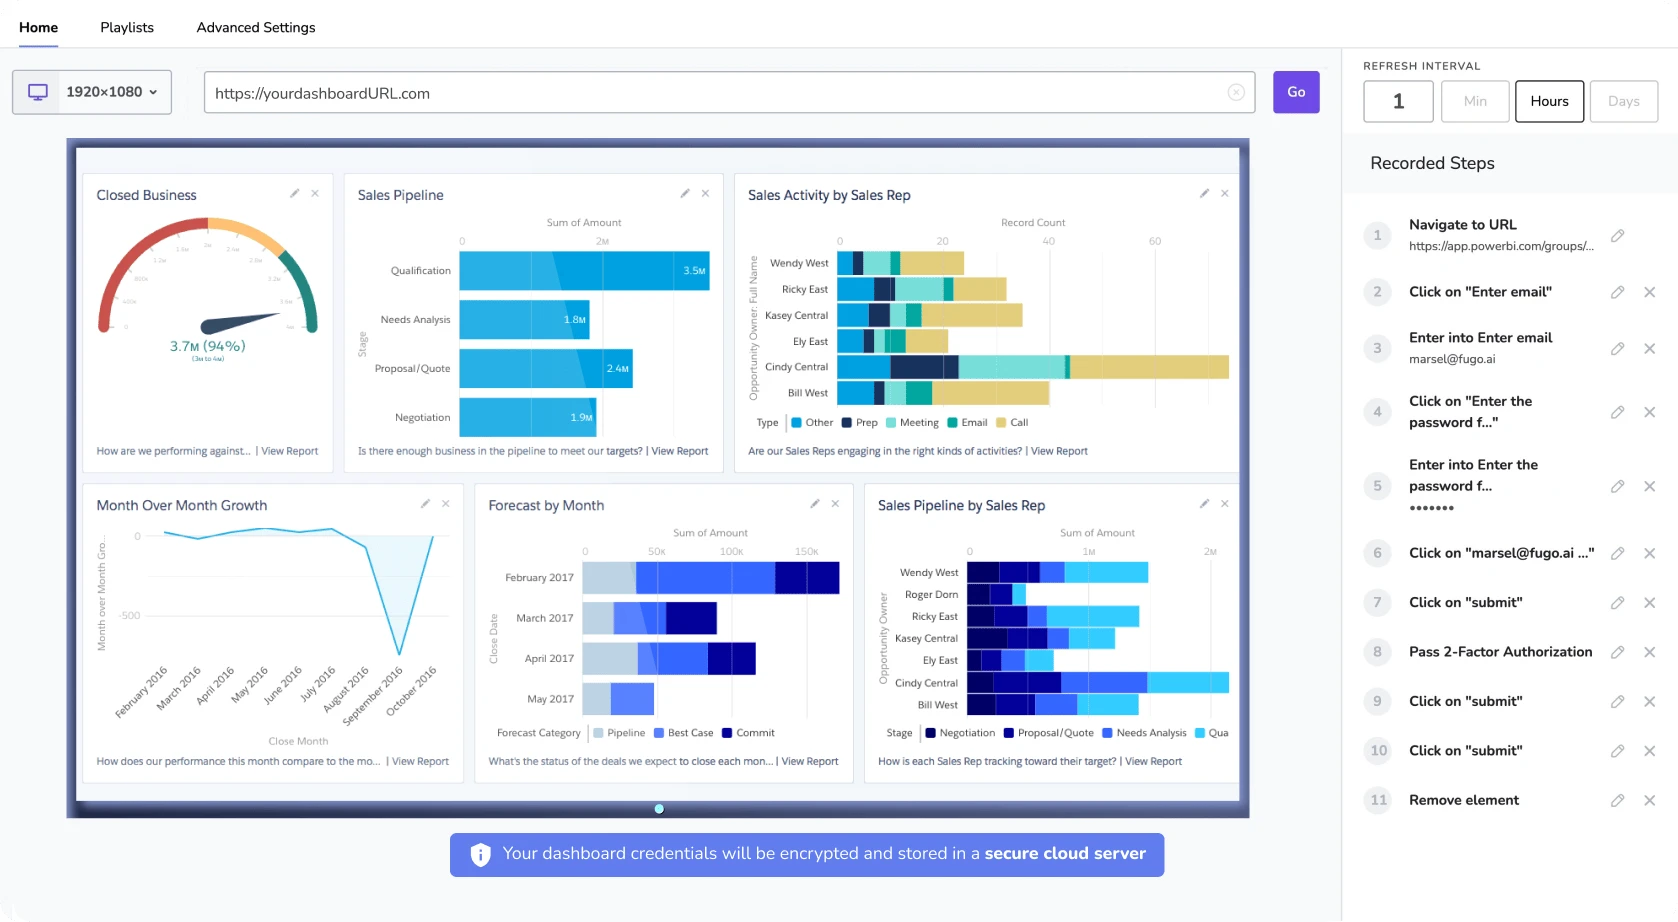
Share Loggly dashboards at scale throughout your organization
Built for stable performance
Dashboards are displayed via live snapshots, reducing the computing power needed to display them.
Customize the data refresh rate
Adjust the data refresh rate so that Fugo can update your dashboard on screen as often as you need.
Make data TV-screen friendly
Crop & customize your saved dashboards in Fugo to display more effectively on TV screens.
Send it at the right time & place
Make sure the right data reaches the right teams on screens located across departments & locations.
Frequently Asked Questions


Need help?
Similar Dashboards
View all dashboards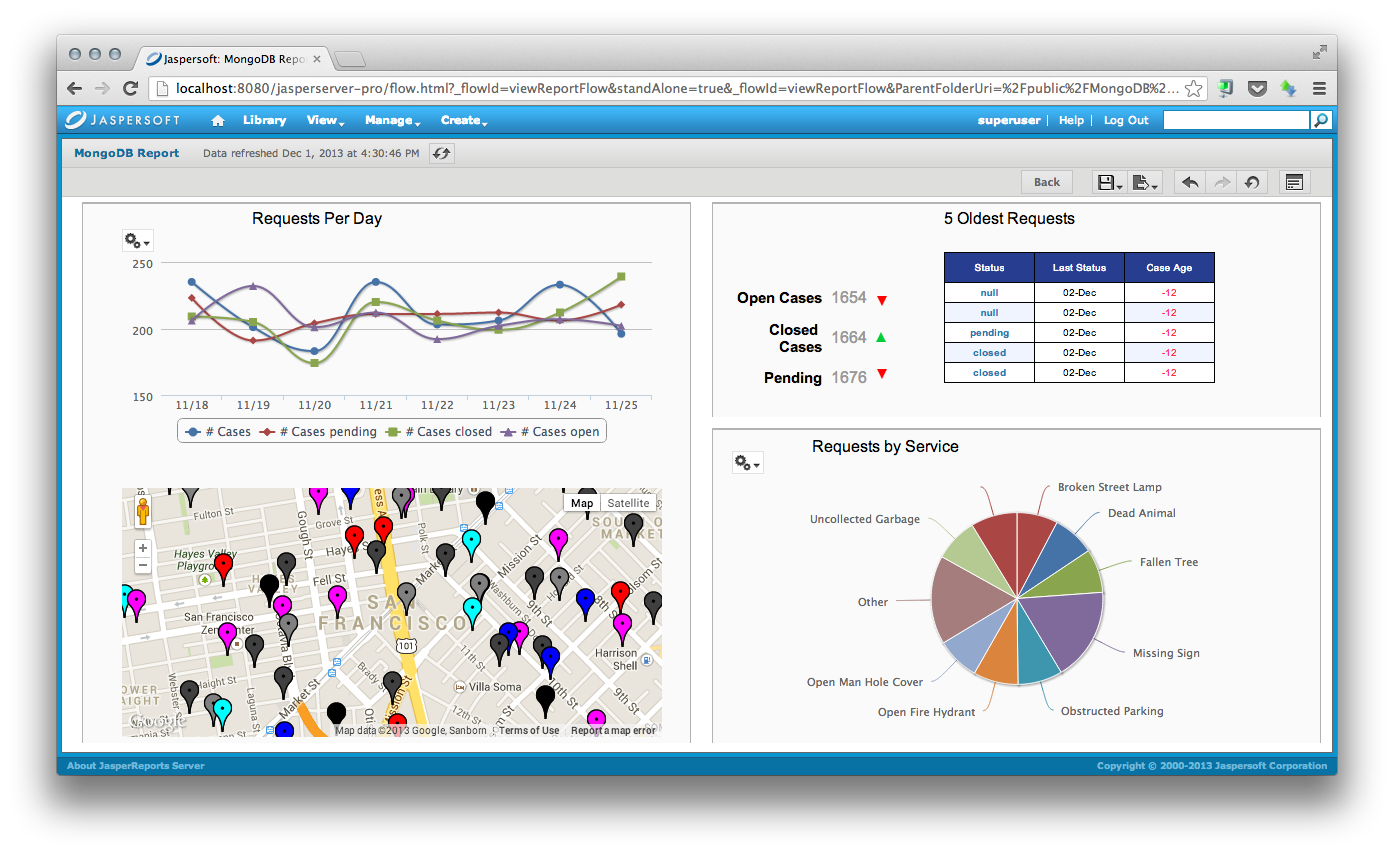
Jaspersoft
The Jaspersoft dashboard offers dynamic data visualization and reporting tools, empowering users to make informed decisions with real-time insights.
Learn more 
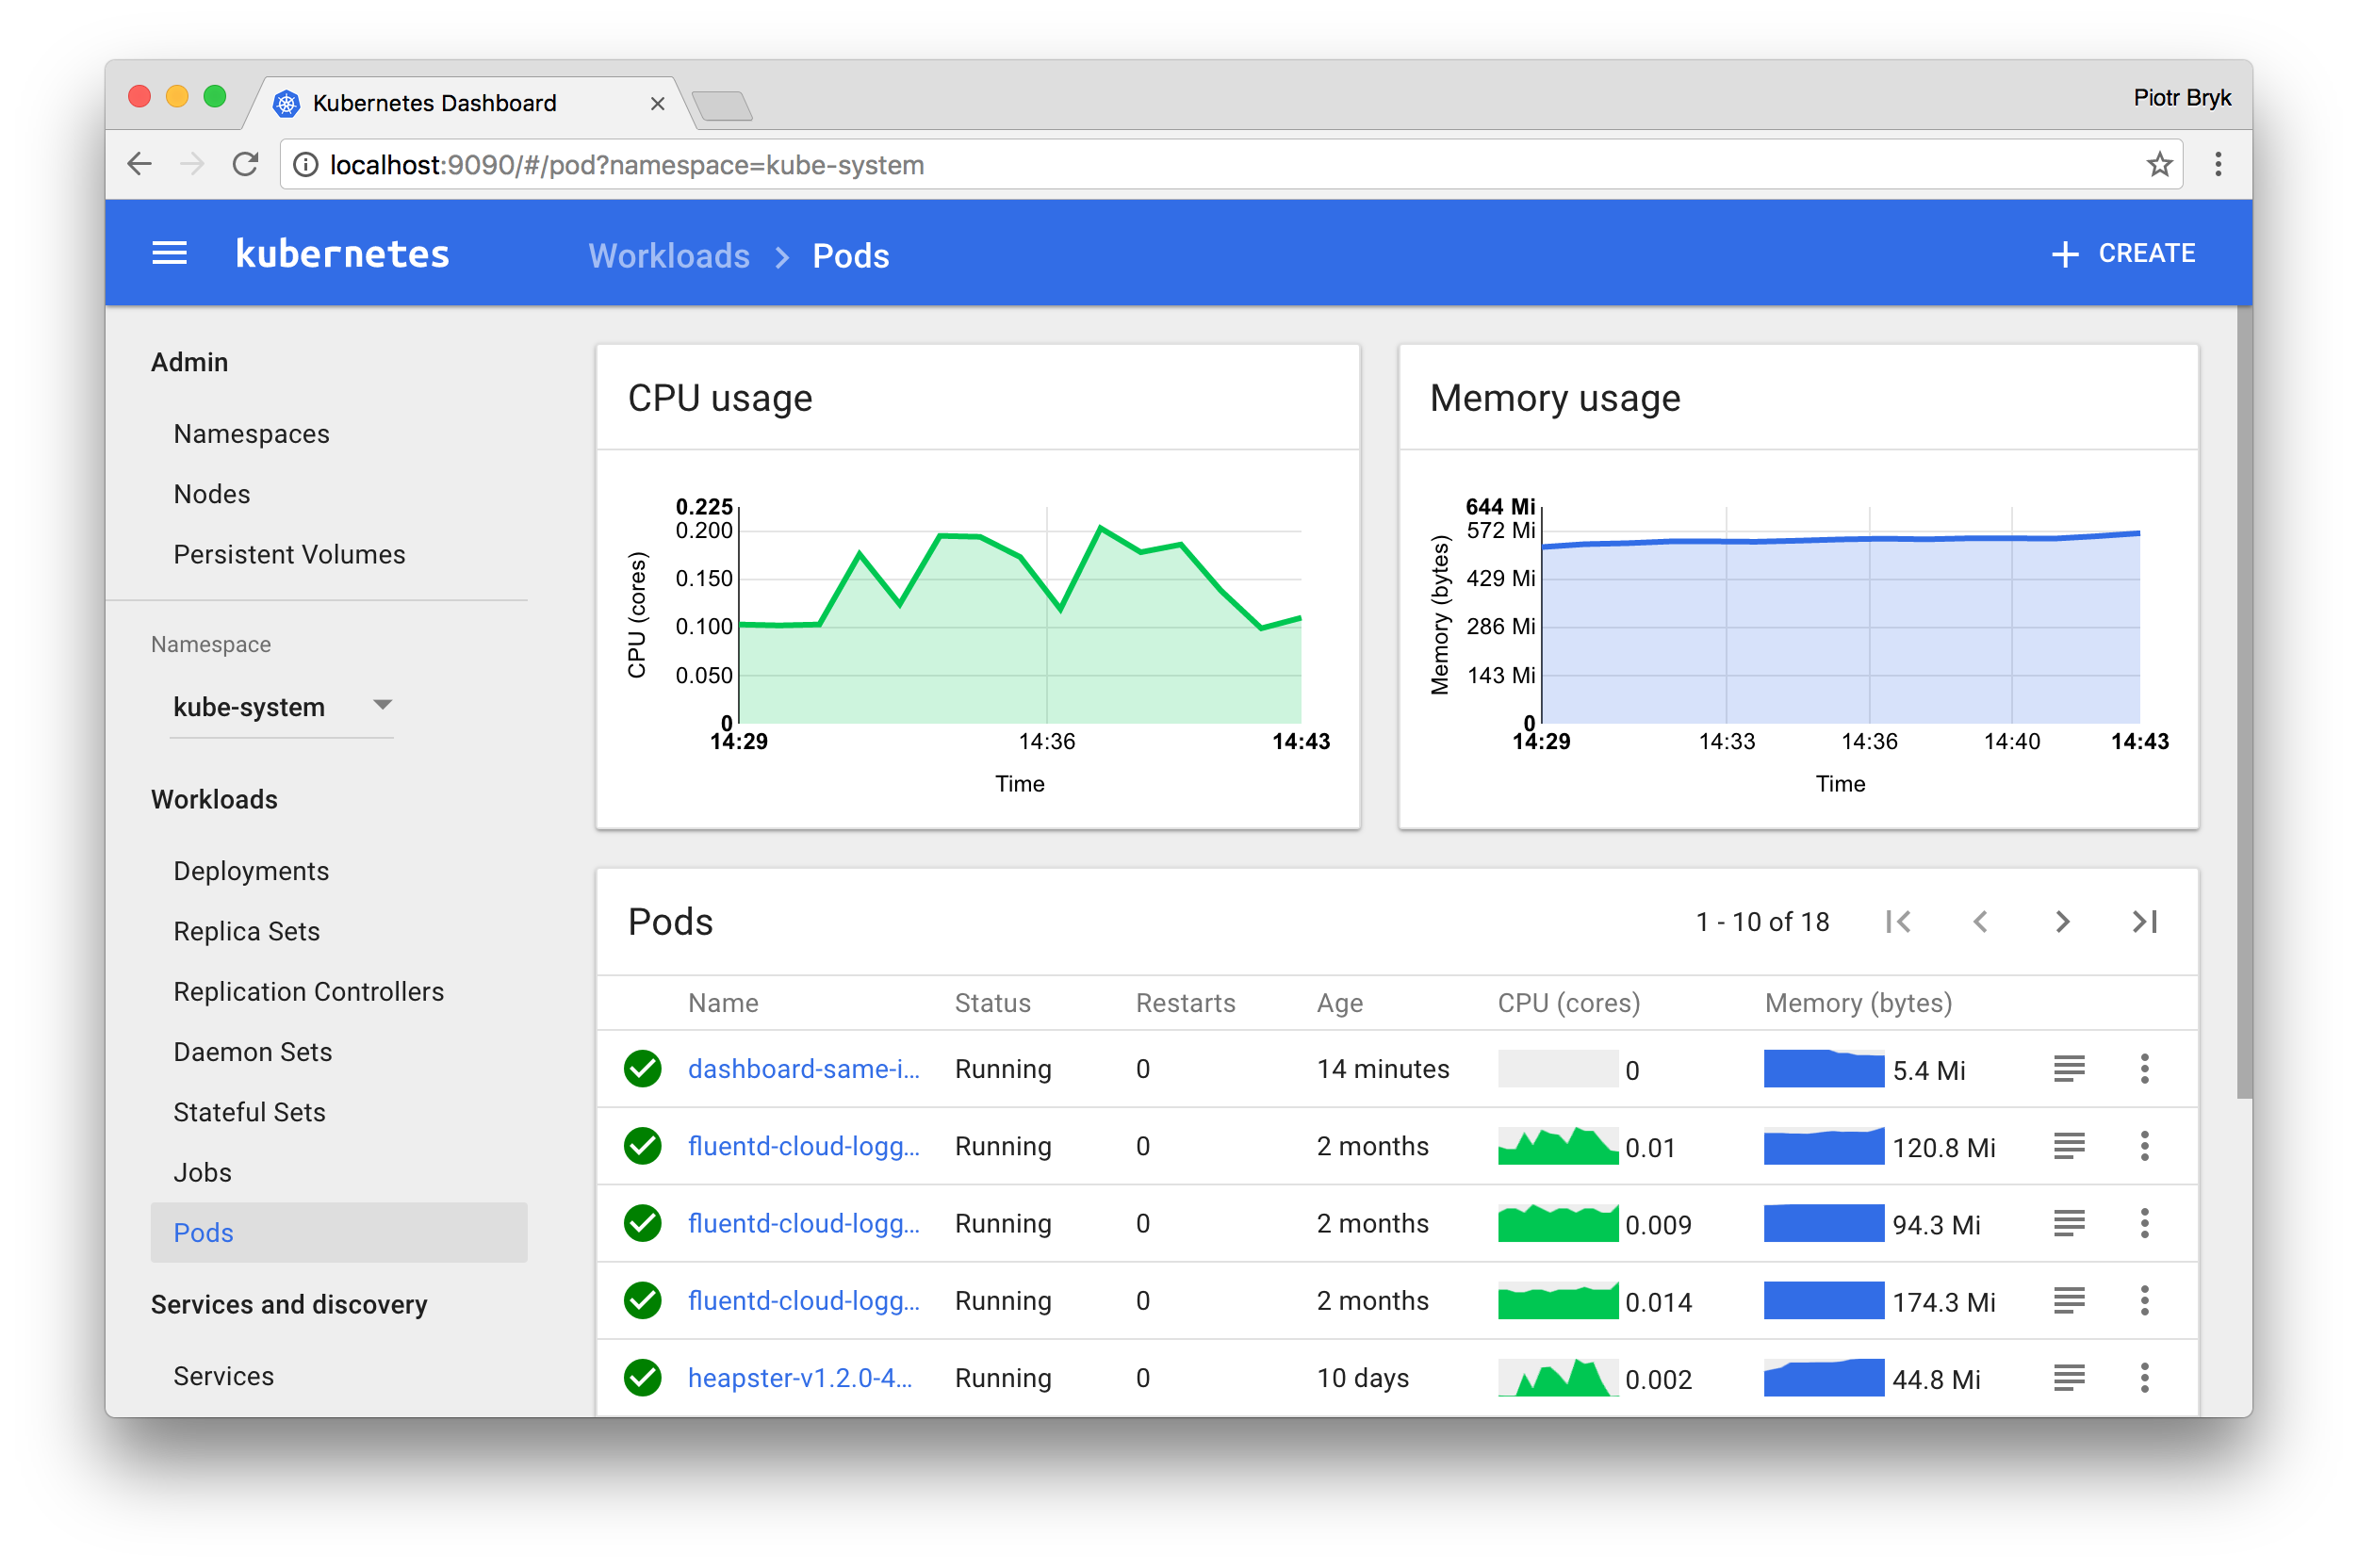
Kubernetes Dashboard
The Kubernetes Dashboard provides a web-based UI to manage, deploy, and troubleshoot Kubernetes clusters efficiently and effectively.
Learn more 
Nagios
Monitor and manage your IT infrastructure with the Nagios dashboard, providing real-time insights and alerts for optimal system performance.
Learn more Get Started
Ready to get going with your digital signage?
Start managing your screens today with a free trial, or book a demo to find out how Fugo can work for your organization.