BUSINESS INTELLIGENCE
Data Visualization and Analysis
The Google Sheets dashboard provides a robust platform for visualizing and analyzing data in real-time. Whether you're tracking sales, monitoring project progress, or managing budgets, this dashboard allows you to create dynamic charts and graphs that update automatically as data changes. With its intuitive interface, you can easily filter and sort data to uncover trends and insights, making data-driven decisions more accessible than ever.
Learn more about workplace screens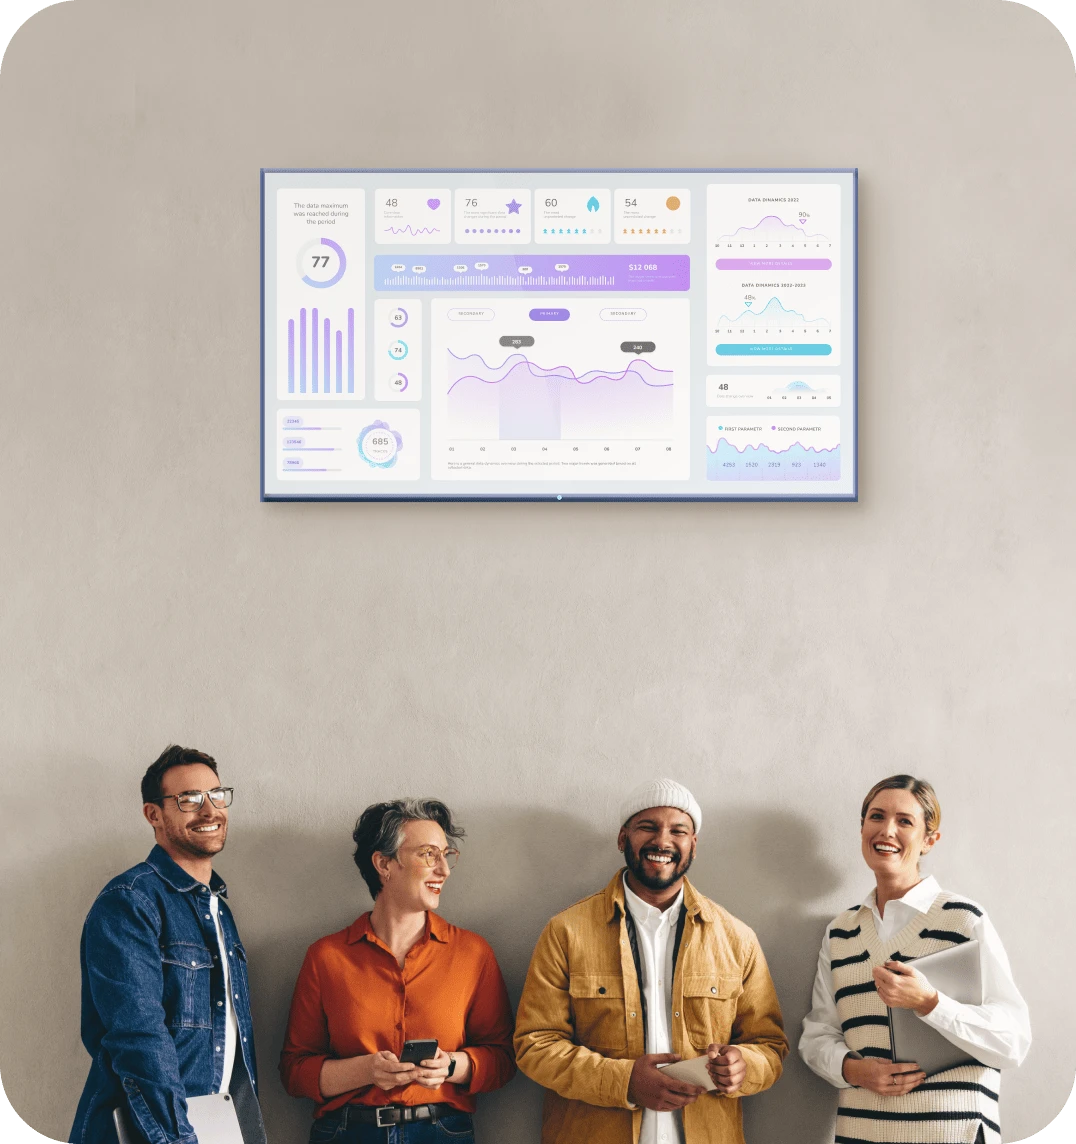
FEATURES
Key Features
Real-time data updates
Customizable charts and graphs
Seamless integration with Google Workspace
User-friendly interface
Data import from various sources
Collaborative editing and sharing
Automated data processing
Conditional formatting options
Secure data storage and access controls
BUSINESS INTELLIGENCE
Who is this for?
This Google Sheets dashboard is ideal for business professionals, data analysts, project managers, and educators who need a flexible and powerful tool to manage and interpret data. Whether you're part of a small startup or a large corporation, this dashboard can be tailored to fit your unique requirements. It's also perfect for educators looking to track student progress or researchers needing to analyze experimental data.

Compliance
Compliance certifications
Fugo is SOC 2 Type II, SOC 3, and HIPAA compliant under the AICPA Service Organization Controls (SOC) framework and U.S. healthcare compliance standards. Our SOC 3 report is publicly available for download, and customers can request to review our SOC 2 Type II and HIPAA Self Assessment reports.
Features
Share Google Sheets dashboards at scale throughout your organization
Built for stable performance
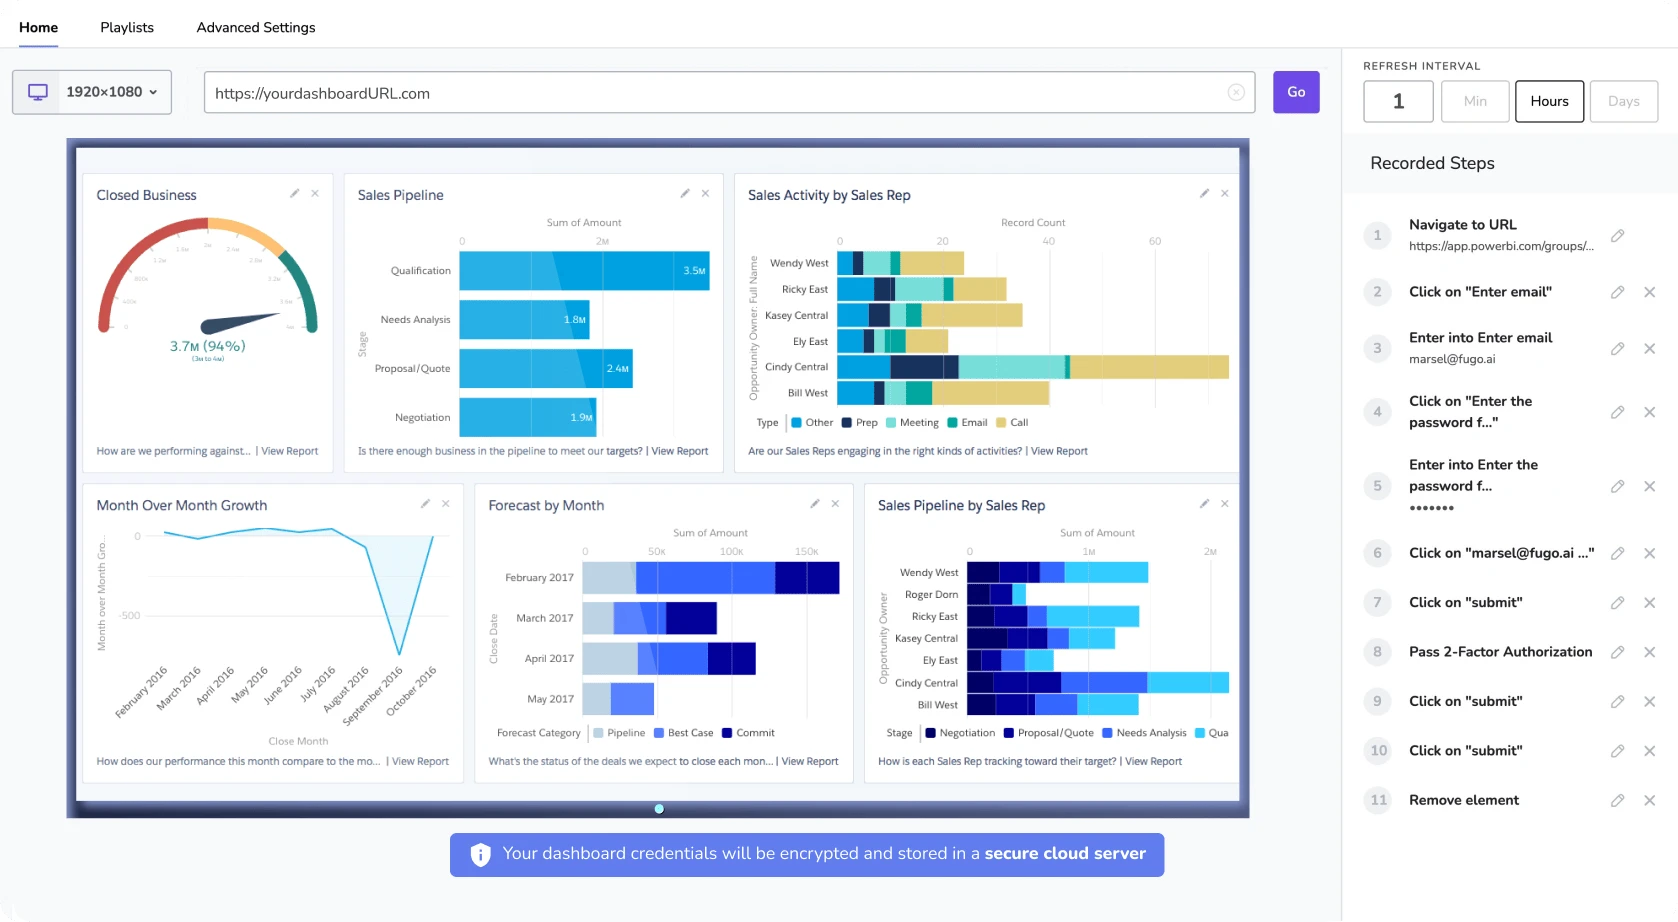
Dashboards are displayed via live snapshots, reducing the computing power needed to display them.
Customize the data refresh rate
Adjust the data refresh rate so that Fugo can update your dashboard on screen as often as you need.
Make data TV-screen friendly
Crop & customize your saved dashboards in Fugo to display more effectively on TV screens.
Send it at the right time & place
Make sure the right data reaches the right teams on screens located across departments & locations.
FAQs
Need help?
Similar Dashboards
View all dashboards
Excel Power Query
Efficiently transform, analyze, and visualize data with the Excel Power Query dashboard, streamlining your data management process effortlessly.
Learn more 
Google Apps Script
Streamline your workflows with the Google Apps Script dashboard, offering seamless integration and automation across Google Workspace applications.
Learn more 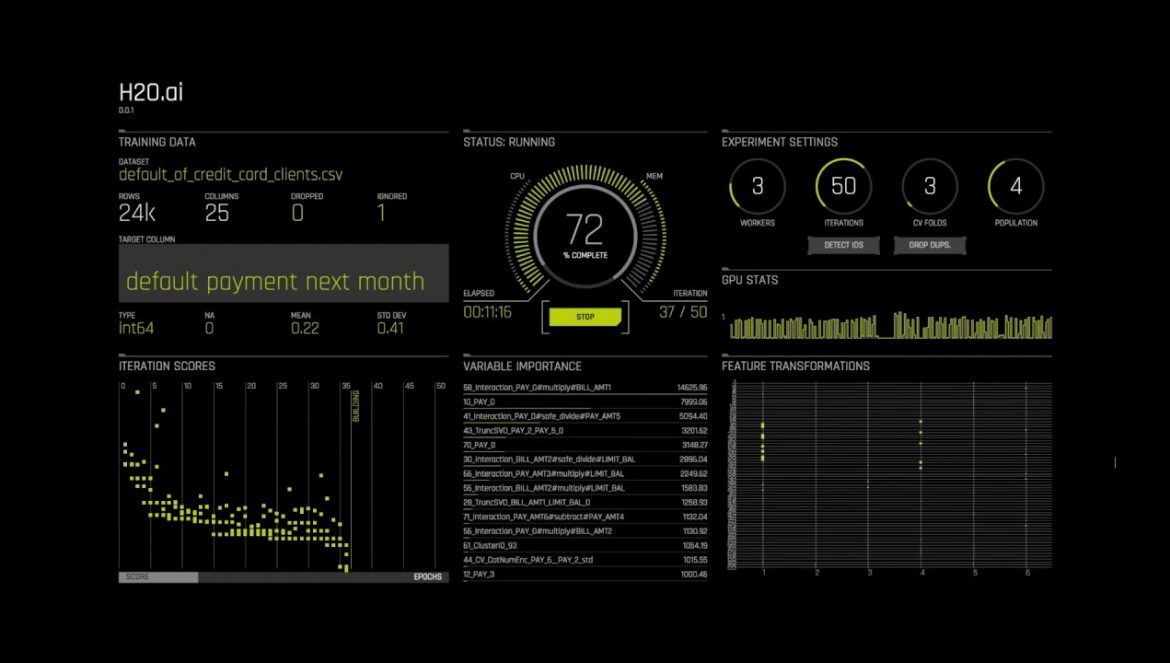
H2O.ai
Explore H2O.ai's intuitive dashboard for seamless AI model building, deployment, and monitoring, enhancing data-driven decision-making.
Learn more Get Started
Ready to get going with your digital signage?
Start managing your screens today with a free trial, or book a demo to find out how Fugo can work for your organization.

