BUSINESS INTELLIGENCE
Data Transformation and Cleaning
The Excel Power Query dashboard excels in transforming and cleaning data, offering users the ability to import data from various sources, reshape it, and prepare it for analysis. With its intuitive interface, users can perform complex data manipulations without needing advanced coding skills. The dashboard allows for merging, appending, and filtering datasets, ensuring that your data is accurate and ready for insightful analysis.
Learn more about workplace screens
FEATURES
Key Features
Connect to multiple data sources seamlessly
Intuitive interface for data cleaning and transformation
Advanced filtering and sorting options
Merge and append datasets with ease
Automatic data refresh capabilities
Create custom columns using powerful formulas
Group and summarize data efficiently
Track and manage query dependencies
Export transformed data directly to Excel worksheets
BUSINESS INTELLIGENCE
Who is this for?
The Excel Power Query dashboard is designed for data analysts, business intelligence professionals, and anyone who regularly works with large datasets. It is particularly beneficial for those who need to streamline their data preparation process and enhance their analytical capabilities without extensive technical expertise. Whether you're a seasoned data scientist or a business manager looking to make data-driven decisions, this dashboard provides the tools necessary to transform raw data into actionable insights.

Compliance
Compliance certifications
Fugo is SOC 2 Type II, SOC 3, and HIPAA compliant under the AICPA Service Organization Controls (SOC) framework and U.S. healthcare compliance standards. Our SOC 3 report is publicly available for download, and customers can request to review our SOC 2 Type II and HIPAA Self Assessment reports.
Features
Share Excel Power Query dashboards at scale throughout your organization
Built for stable performance
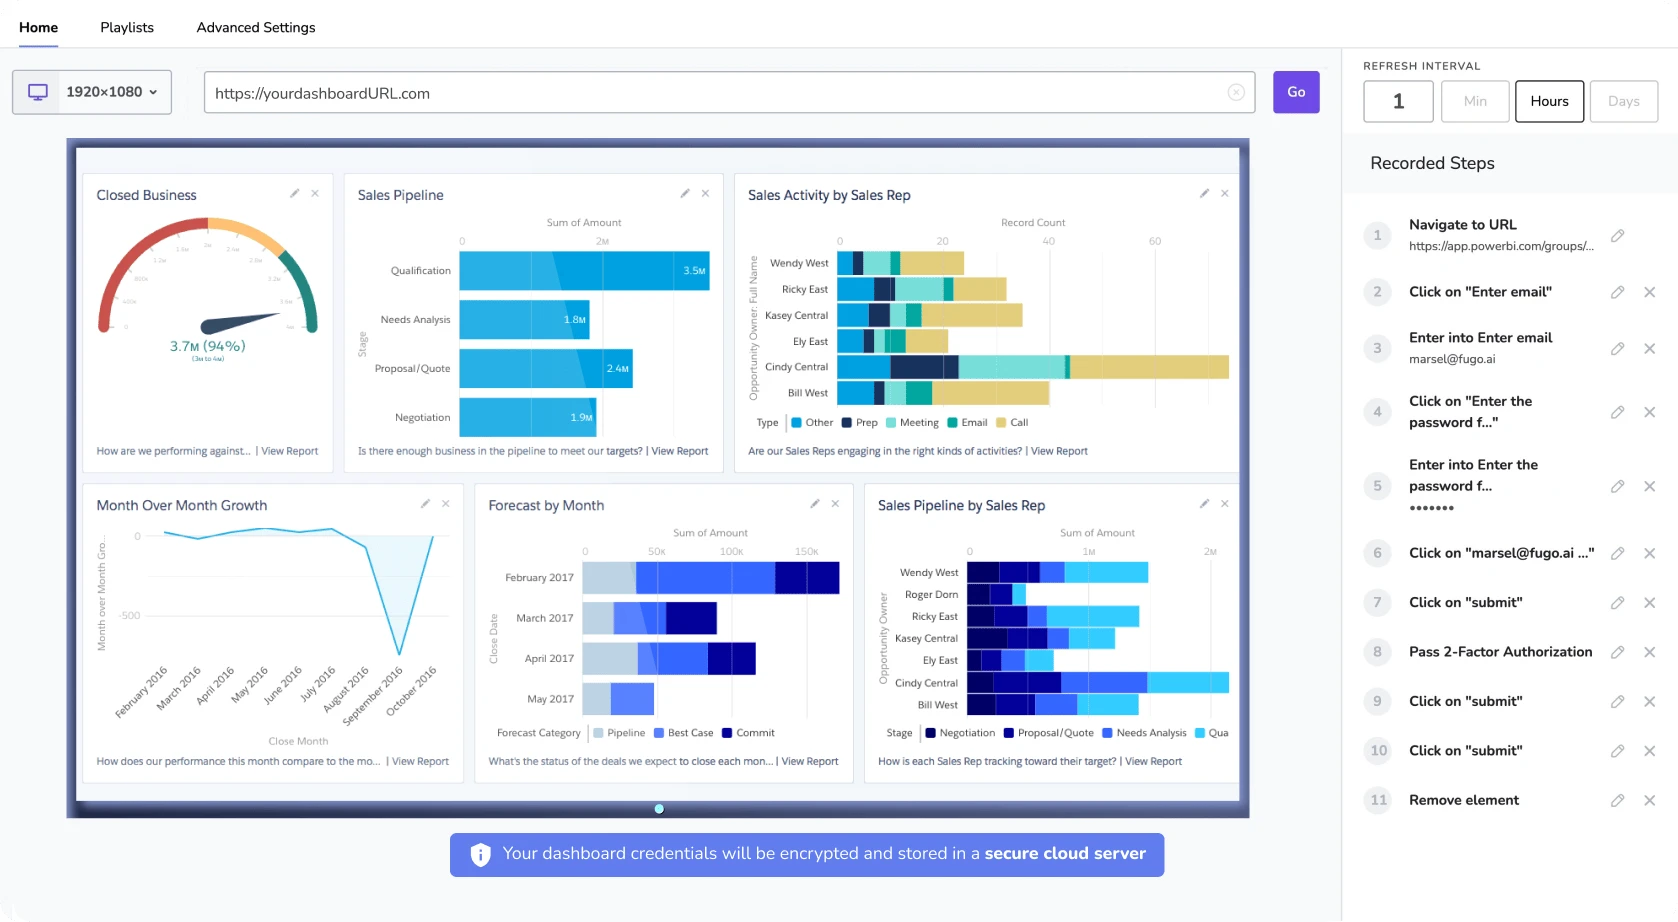
Dashboards are displayed via live snapshots, reducing the computing power needed to display them.
Customize the data refresh rate
Adjust the data refresh rate so that Fugo can update your dashboard on screen as often as you need.
Make data TV-screen friendly
Crop & customize your saved dashboards in Fugo to display more effectively on TV screens.
Send it at the right time & place
Make sure the right data reaches the right teams on screens located across departments & locations.
FAQ
What is Excel Power Query used for?
Excel Power Query is used for importing, cleaning, and transforming data from various sources, making it ready for analysis and reporting.
Can I use Power Query with other Microsoft products?
Yes, Power Query integrates seamlessly with other Microsoft products like Power BI and SQL Server, enhancing its data processing capabilities.
Is coding knowledge required to use Power Query?
No, Power Query offers a user-friendly interface that allows users to perform complex data transformations without needing to write code.
How often can I refresh my data in Power Query?
You can schedule data refreshes at intervals that suit your needs, ensuring your data is always up-to-date.
Need help?
Similar Dashboards
View all dashboards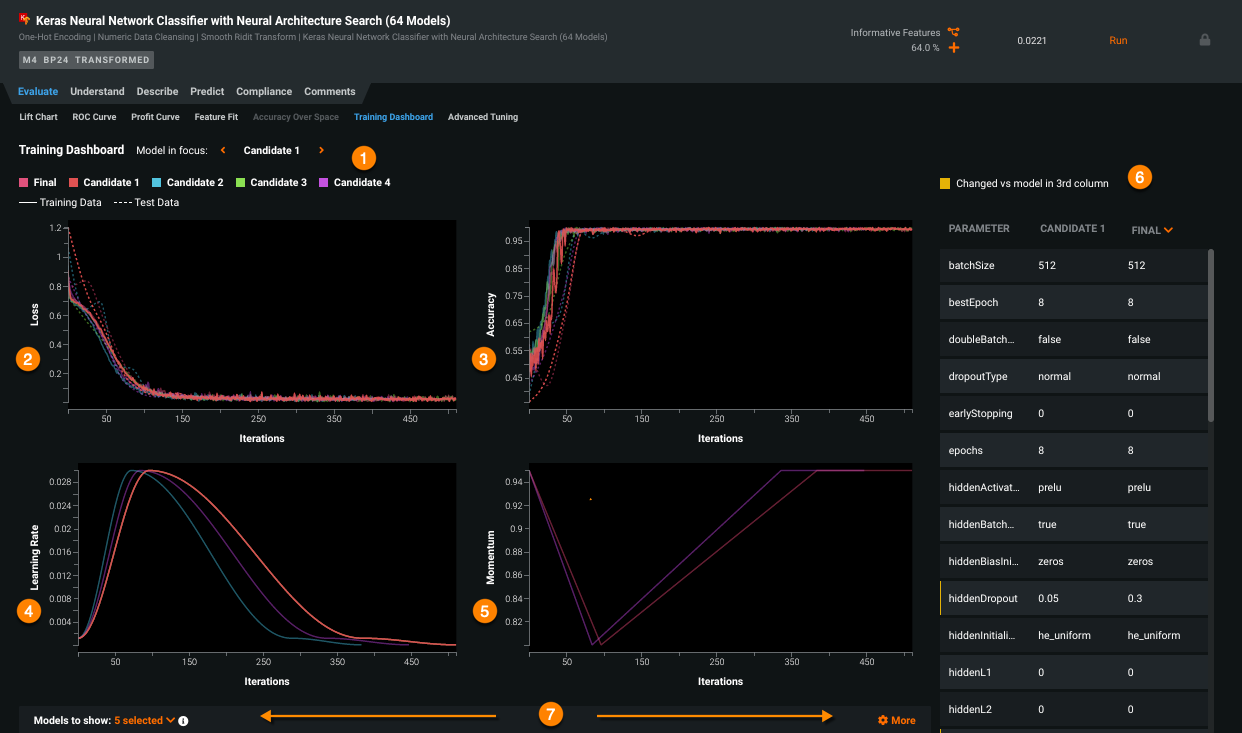
DataRobot
Explore DataRobot's intuitive dashboard for seamless AI model management, offering real-time insights and predictive analytics to drive business decisions.
Learn more 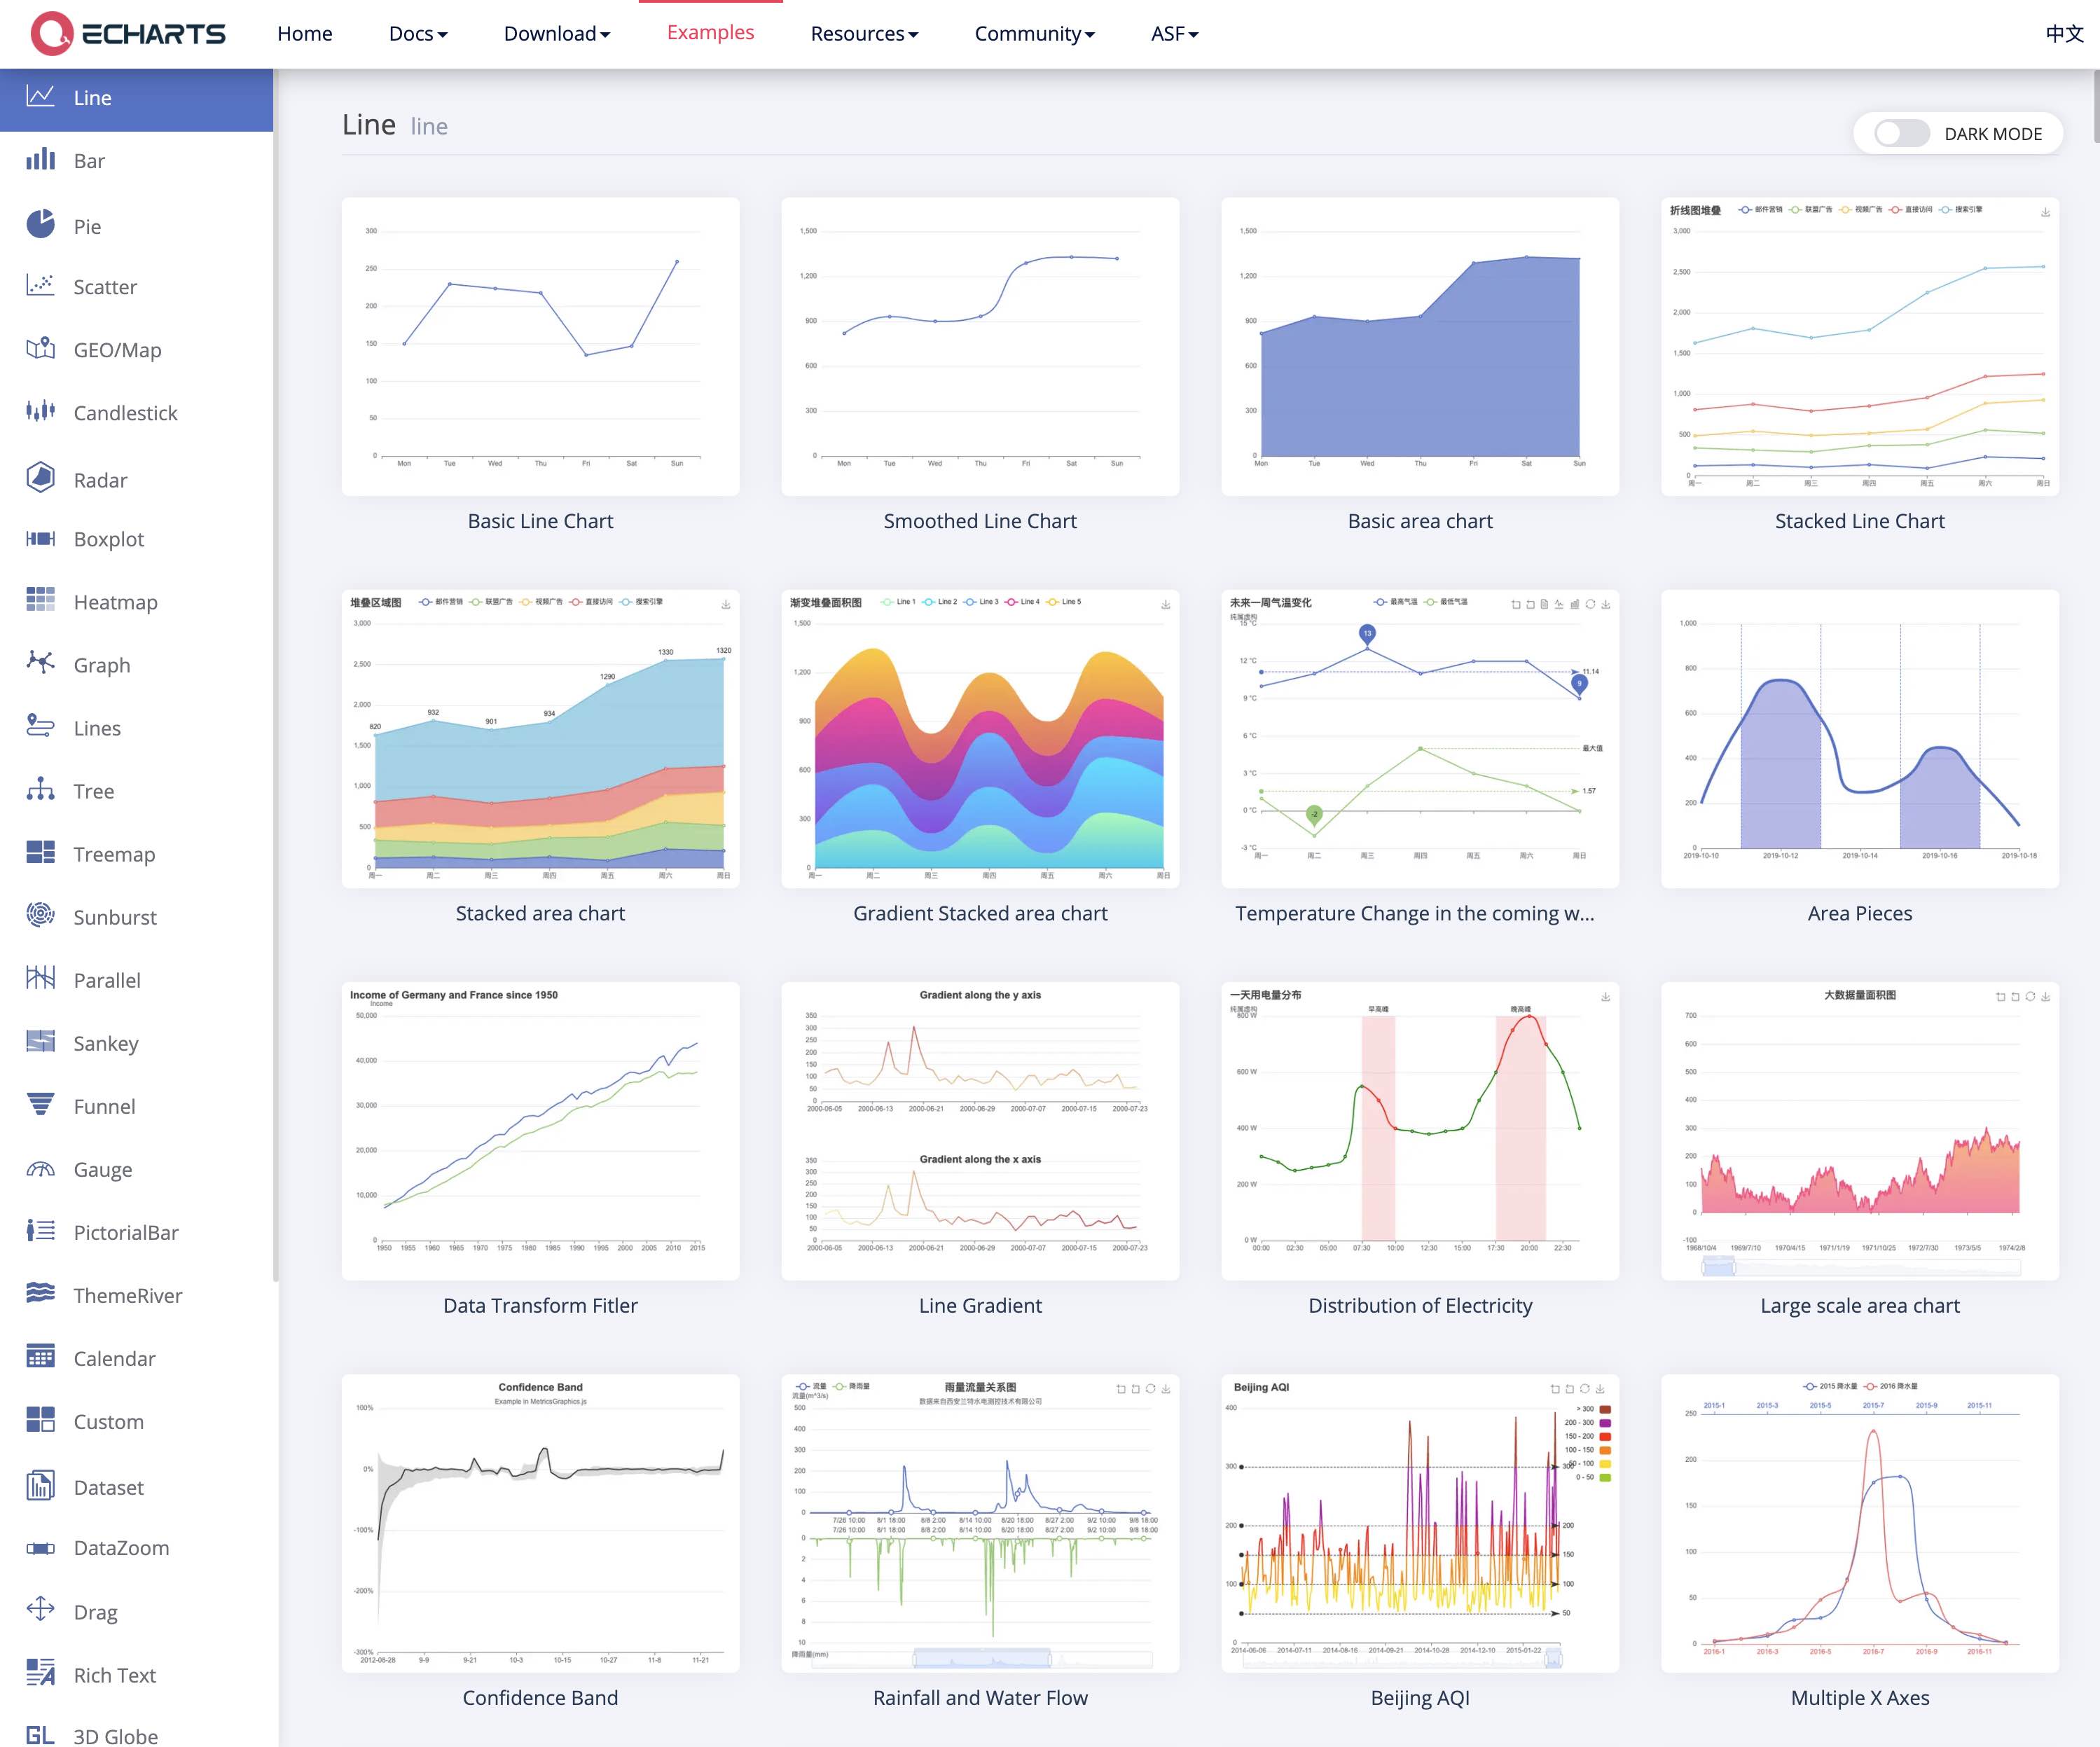
ECharts
Visualize complex data effortlessly with the ECharts dashboard, offering interactive charts and graphs for insightful data analysis and presentation.
Learn more 
Google Apps Script
Streamline your workflows with the Google Apps Script dashboard, offering seamless integration and automation across Google Workspace applications.
Learn more Get Started
Ready to get going with your digital signage?
Start managing your screens today with a free trial, or book a demo to find out how Fugo can work for your organization.

