


Canvas Analytics
Gain insights into student engagement and performance with Canvas Analytics, offering real-time data visualization and reporting tools.


BUSINESS INTELLIGENCE
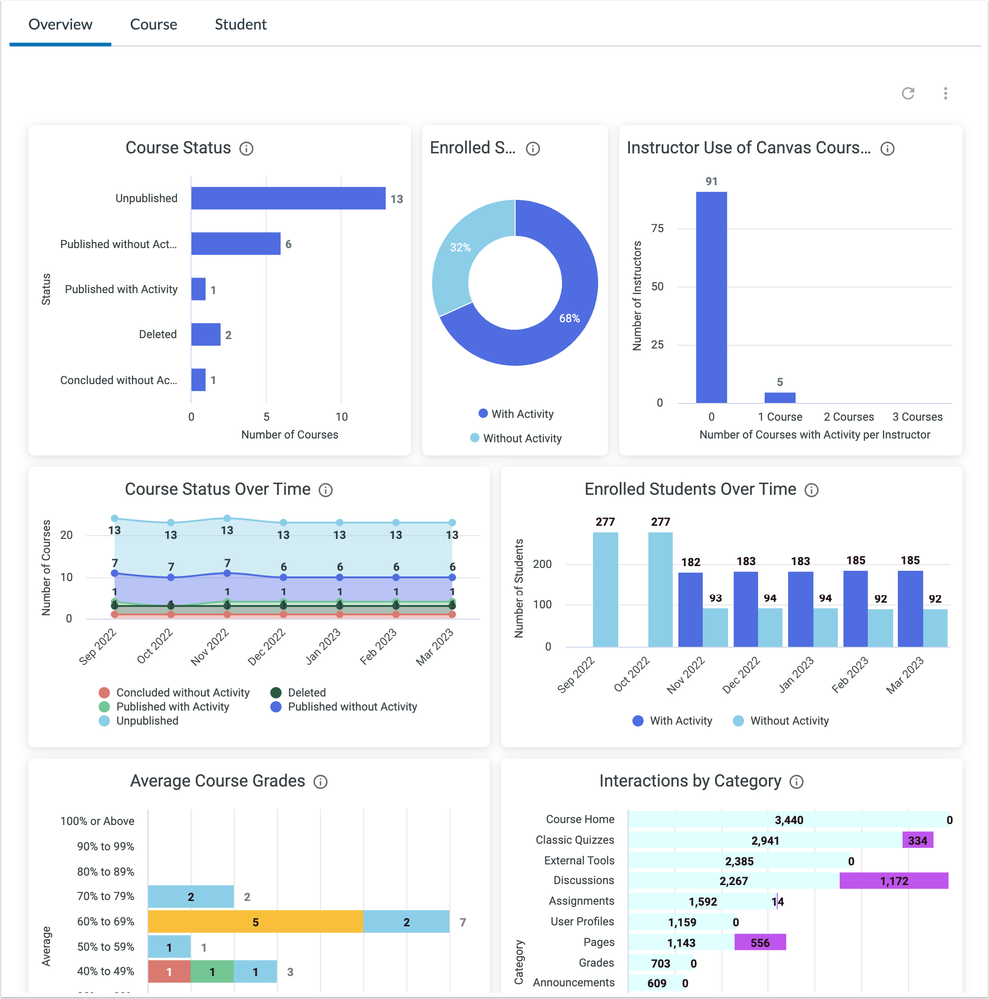
Student Engagement Overview
The Canvas Analytics dashboard provides a comprehensive view of student engagement metrics. It tracks participation in discussions, assignment submissions, and login frequency. This data helps educators identify students who may need additional support or intervention. By analyzing trends over time, instructors can adjust their teaching strategies to enhance student involvement and improve learning outcomes.
Learn more about workplace screens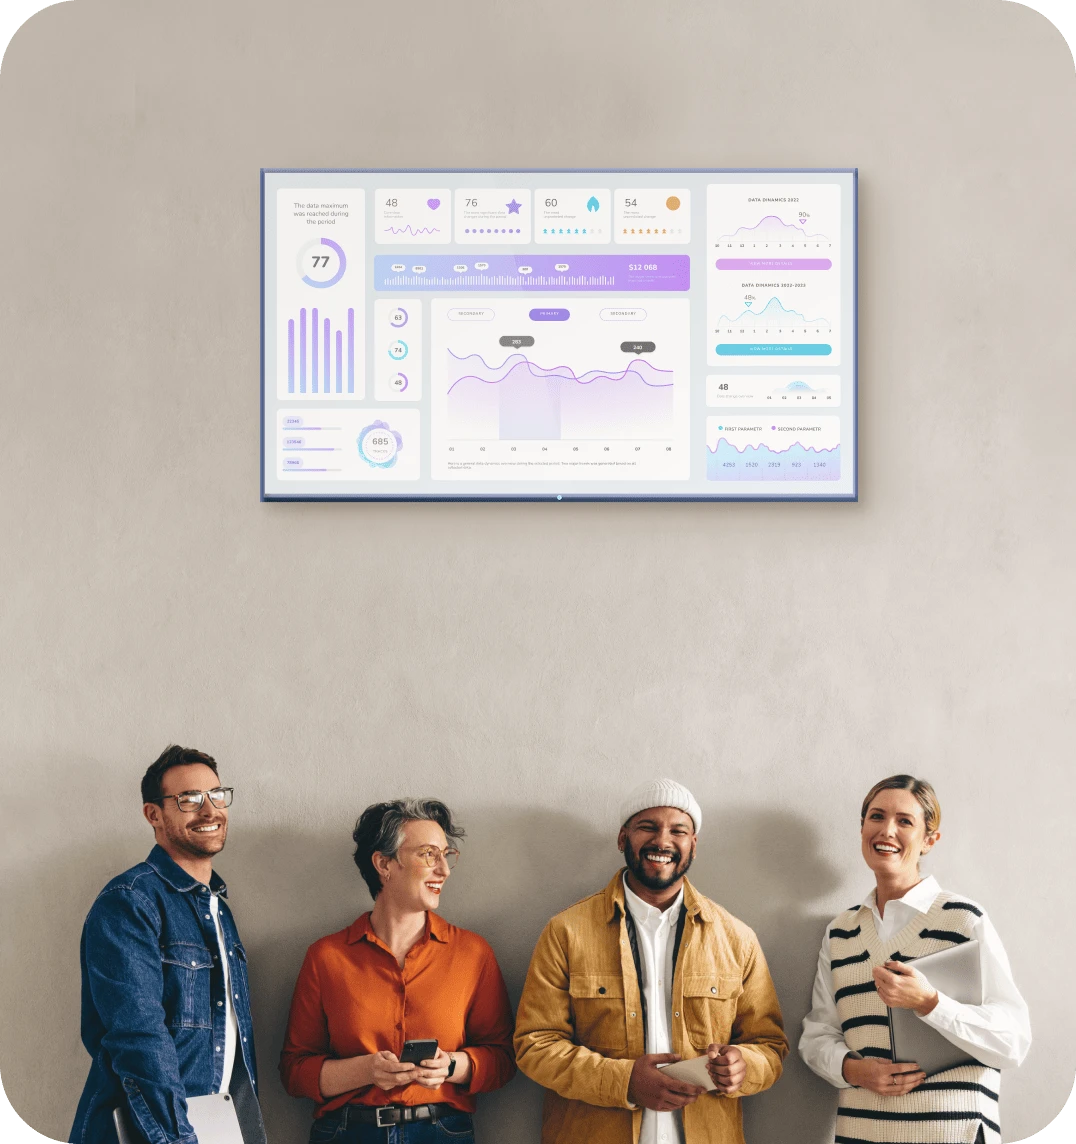
FEATURES
Key Features of Canvas Analytics
Real-time data visualization
Customizable reports and dashboards
Detailed course activity tracking
Student performance metrics
Attendance and participation logs
Comparative analysis across courses
Alerts for at-risk students
Integration with other educational tools
Secure and user-friendly interface
BUSINESS INTELLIGENCE
Who is this for?
Canvas Analytics is designed for educators, administrators, and academic advisors who seek to enhance the learning experience through data-driven insights. Teachers can use the dashboard to monitor class engagement and adapt their teaching methods. Administrators benefit from a macro view of institutional performance, aiding in strategic planning. Academic advisors can identify students needing additional support, ensuring timely interventions.

Compliance
Compliance certifications

Fugo is SOC 2 Type II, SOC 3, and HIPAA compliant under the AICPA Service Organization Controls (SOC) framework and U.S. healthcare compliance standards. Our SOC 3 report is publicly available for download, and customers can request to review our SOC 2 Type II and HIPAA Self Assessment reports.
Features
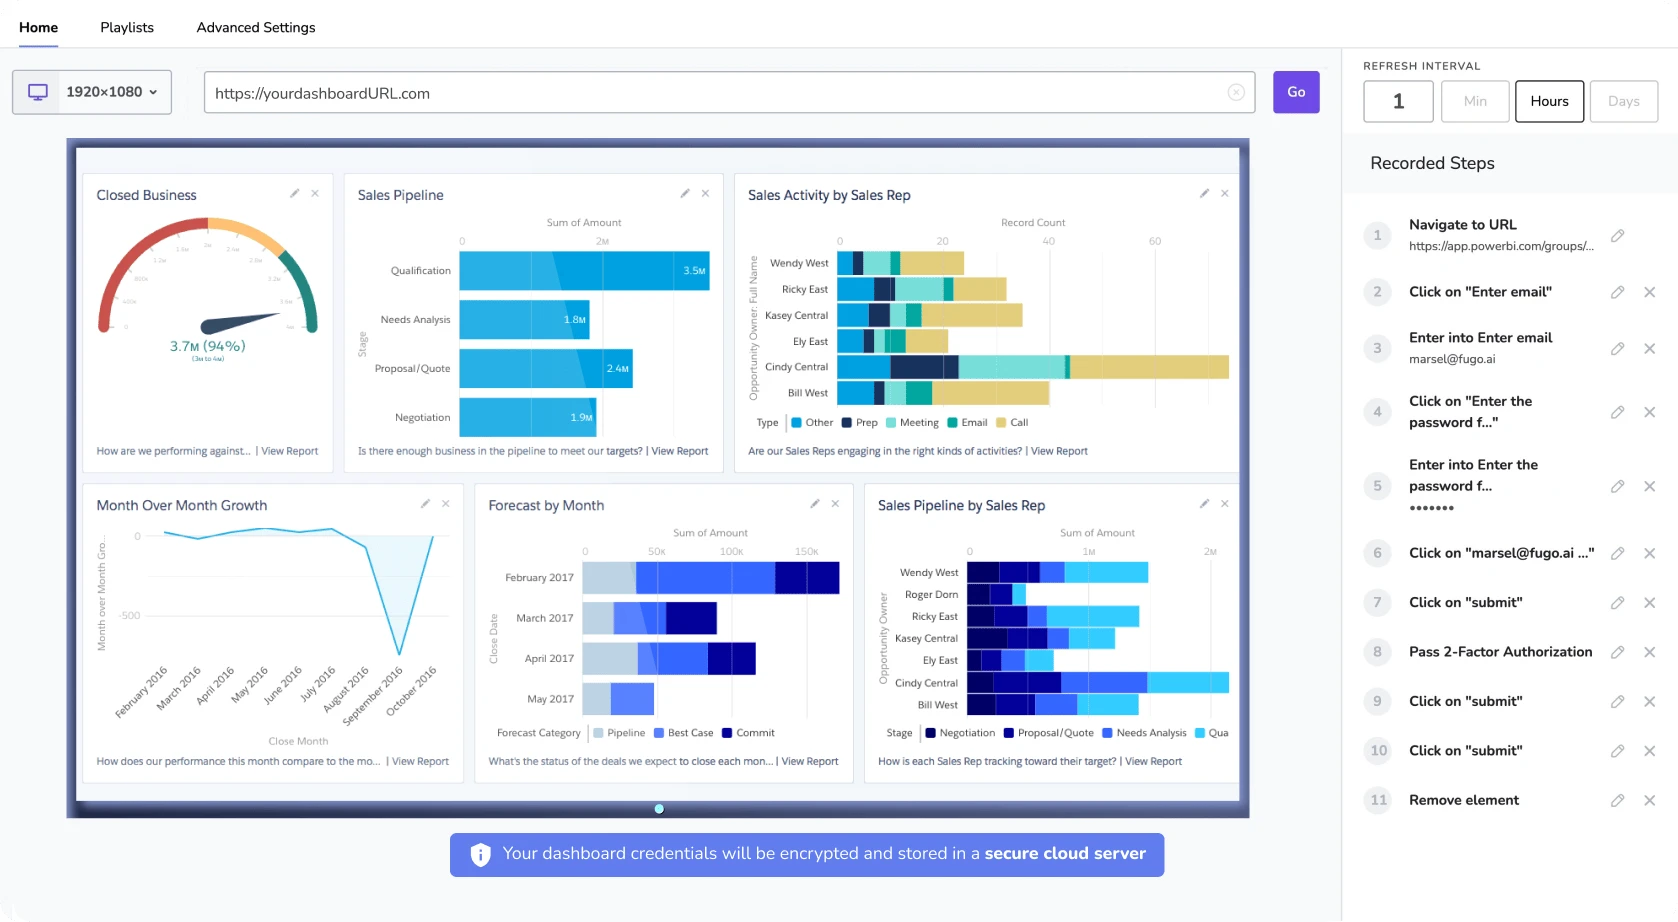
Share Canvas Analytics dashboards at scale throughout your organization
Built for stable performance
Dashboards are displayed via live snapshots, reducing the computing power needed to display them.
Customize the data refresh rate
Adjust the data refresh rate so that Fugo can update your dashboard on screen as often as you need.
Make data TV-screen friendly
Crop & customize your saved dashboards in Fugo to display more effectively on TV screens.
Send it at the right time & place
Make sure the right data reaches the right teams on screens located across departments & locations.
Frequently Asked Questions


Need help?
Similar Dashboards
View all dashboards
Blackboard Analytics
Gain insights into student performance, course engagement, and institutional effectiveness with the comprehensive Blackboard Analytics dashboard.
Learn more 

Brightspace Insights
Brightspace Insights dashboard provides real-time analytics on student engagement, course progress, and performance metrics for educators.
Learn more 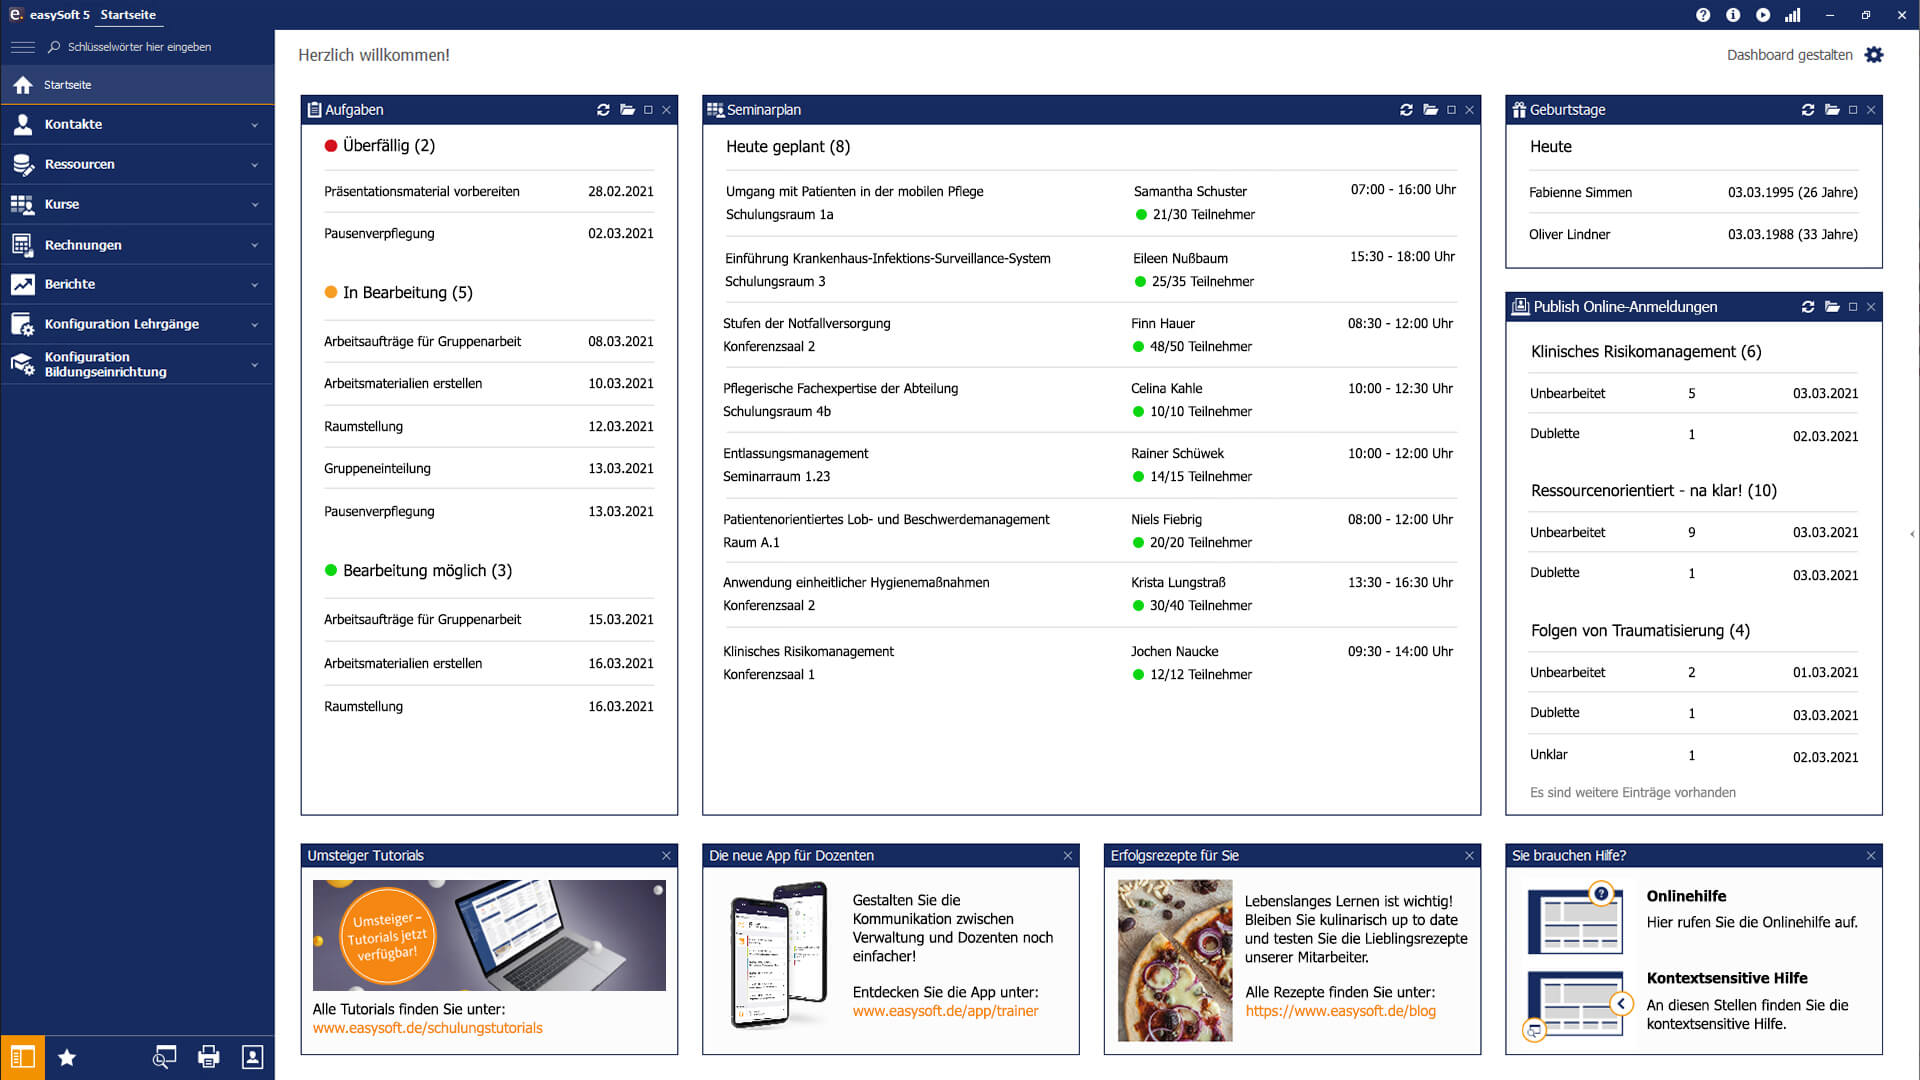
EesySoft
Monitor and enhance user engagement with EesySoft's intuitive dashboard, offering real-time insights and analytics for optimized educational experiences.
Learn more Get Started
Ready to get going with your digital signage?
Start managing your screens today with a free trial, or book a demo to find out how Fugo can work for your organization.