BUSINESS INTELLIGENCE
Repository Performance Overview
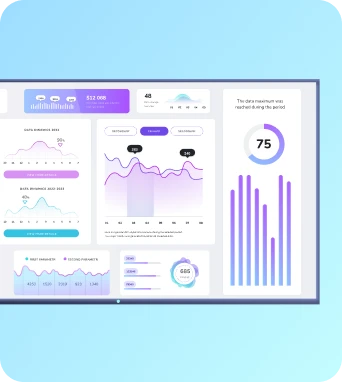
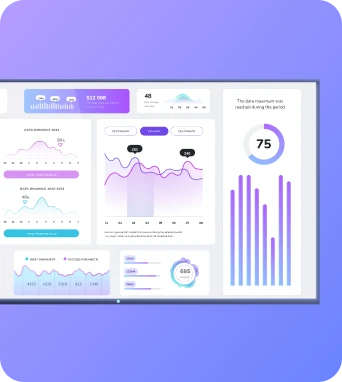
The Repository Performance Overview section provides a comprehensive analysis of your repositories' health and activity. It includes metrics on commit frequency, pull request status, and code review times. This data helps teams identify bottlenecks and optimize their workflow by understanding how changes are being integrated and reviewed. By visualizing these metrics, teams can make informed decisions to improve code quality and collaboration efficiency.
Learn more about workplace screens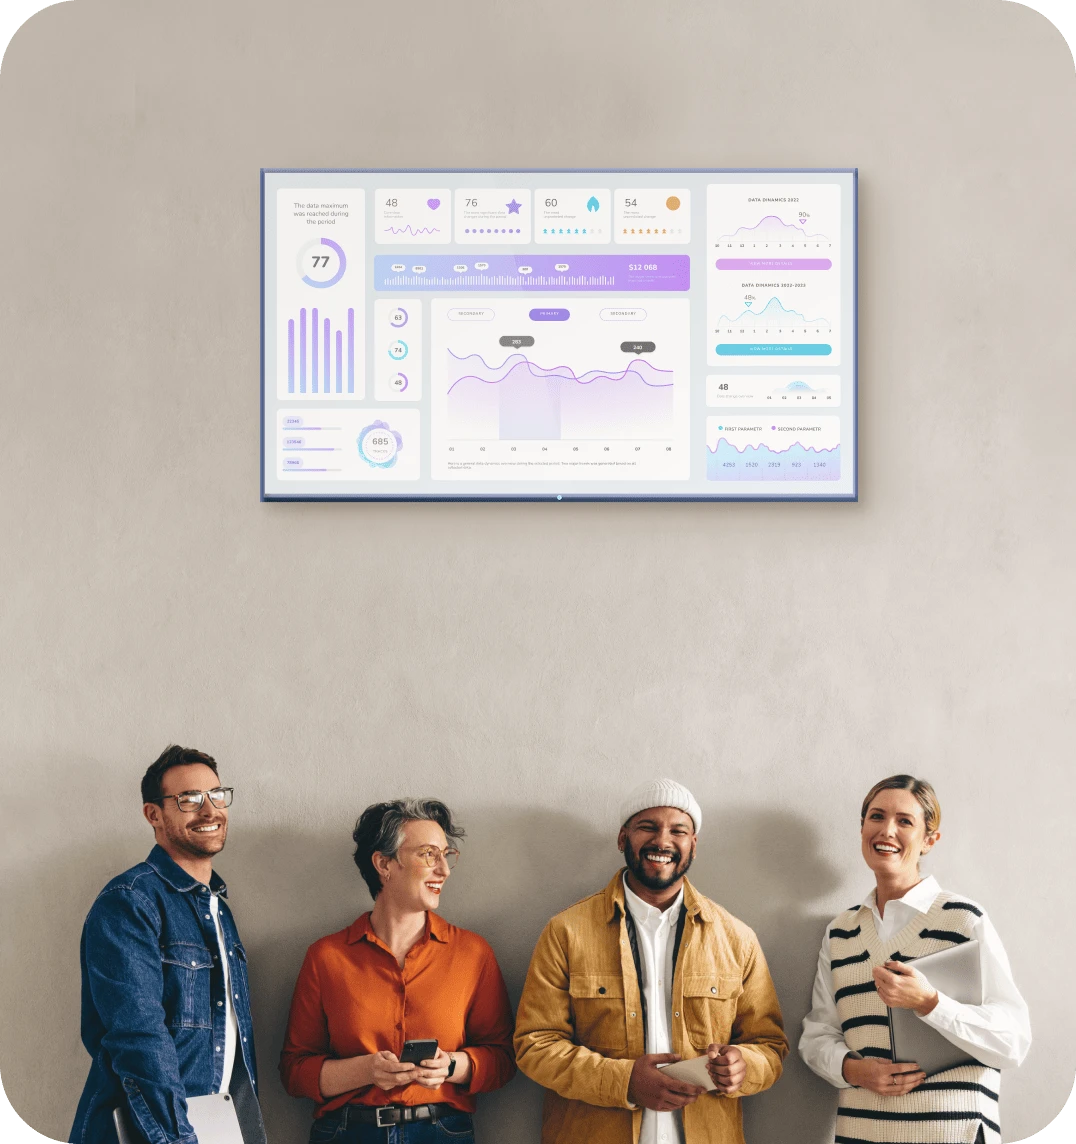
FEATURES
Key Features of Bitbucket Analytics Dashboard
Real-time data visualization of repository activities
Detailed commit history and trends analysis
Pull request status tracking and insights
Code quality metrics and technical debt assessment
Contributor activity and performance reports
Customizable dashboards with drag-and-drop widgets
Integration with JIRA for enhanced project management
Alerts and notifications for critical repository events
Exportable reports for team meetings and reviews
BUSINESS INTELLIGENCE
Who is this Dashboard For?
This dashboard is designed for software development teams using Bitbucket to manage their code repositories. It is particularly beneficial for team leads, project managers, and DevOps engineers who need to monitor and optimize development workflows. By providing actionable insights, it helps teams maintain high code quality, improve collaboration, and meet project deadlines efficiently. Whether you're managing a small team or overseeing multiple projects, Bitbucket Analytics offers the tools needed to keep your development process on track.

Compliance
Compliance certifications
Fugo is SOC 2 Type II, SOC 3, and HIPAA compliant under the AICPA Service Organization Controls (SOC) framework and U.S. healthcare compliance standards. Our SOC 3 report is publicly available for download, and customers can request to review our SOC 2 Type II and HIPAA Self Assessment reports.
Features
Share Bitbucket Analytics dashboards at scale throughout your organization
Built for stable performance
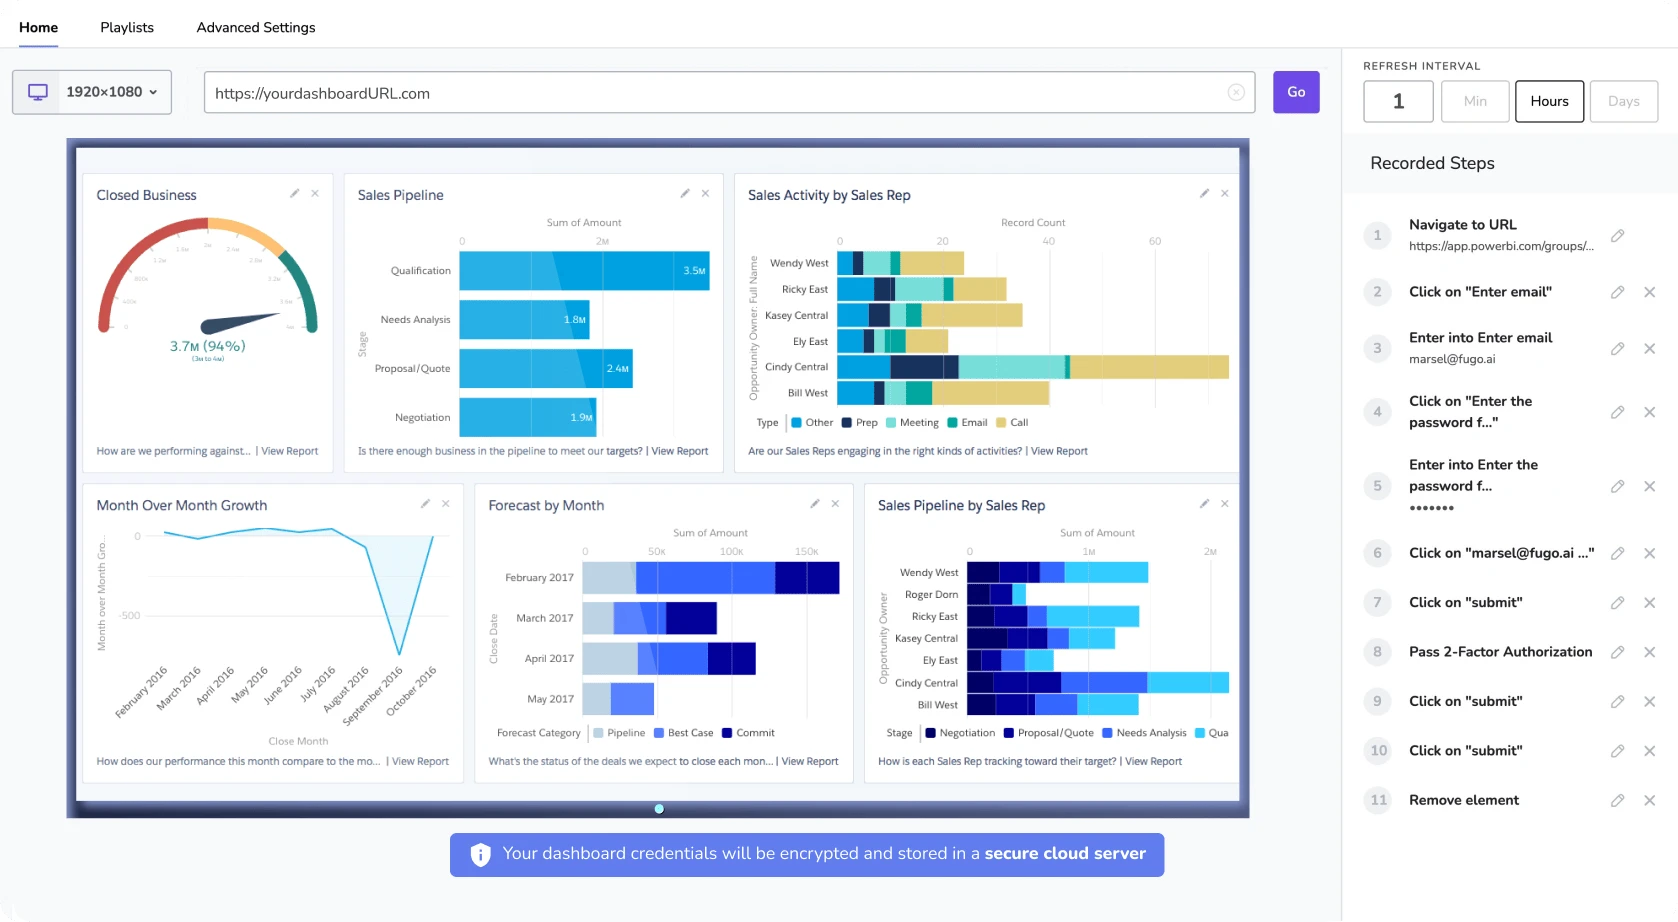
Dashboards are displayed via live snapshots, reducing the computing power needed to display them.
Customize the data refresh rate
Adjust the data refresh rate so that Fugo can update your dashboard on screen as often as you need.
Make data TV-screen friendly
Crop & customize your saved dashboards in Fugo to display more effectively on TV screens.
Send it at the right time & place
Make sure the right data reaches the right teams on screens located across departments & locations.
Frequently Asked Questions
How often is the data updated on the dashboard?
The data is updated in real-time, ensuring you have the most current insights into your repository activities.
Can I customize the metrics displayed on the dashboard?
Yes, the dashboard allows for customization to focus on the metrics most relevant to your team's needs.
Is it possible to export the analytics reports?
Absolutely, you can export reports in various formats to share with stakeholders or for offline analysis.
Does the dashboard support integration with other tools?
Yes, Bitbucket Analytics can integrate with other project management and CI/CD tools to provide a comprehensive view of your development process.
Need help?
Similar Dashboards
View all dashboards
Ansible Tower
Monitor and manage your Ansible automation workflows efficiently with real-time insights and control using the Ansible Tower dashboard.
Learn more 
AppDynamics
Gain real-time insights into application performance, user experience, and business outcomes with the AppDynamics dashboard.
Learn more 
Chef Automate
Chef Automate dashboard offers comprehensive insights into infrastructure automation, compliance, and application delivery in real-time.
Learn more Get Started
Ready to get going with your digital signage?
Start managing your screens today with a free trial, or book a demo to find out how Fugo can work for your organization.

