Dashboard Finder
There are a ton of dashboards out there for different use cases. Find exactly what you need with our handy search tool!
Start my free trialBook a demoFeatured List
The top dashboard tools right now
Power BI
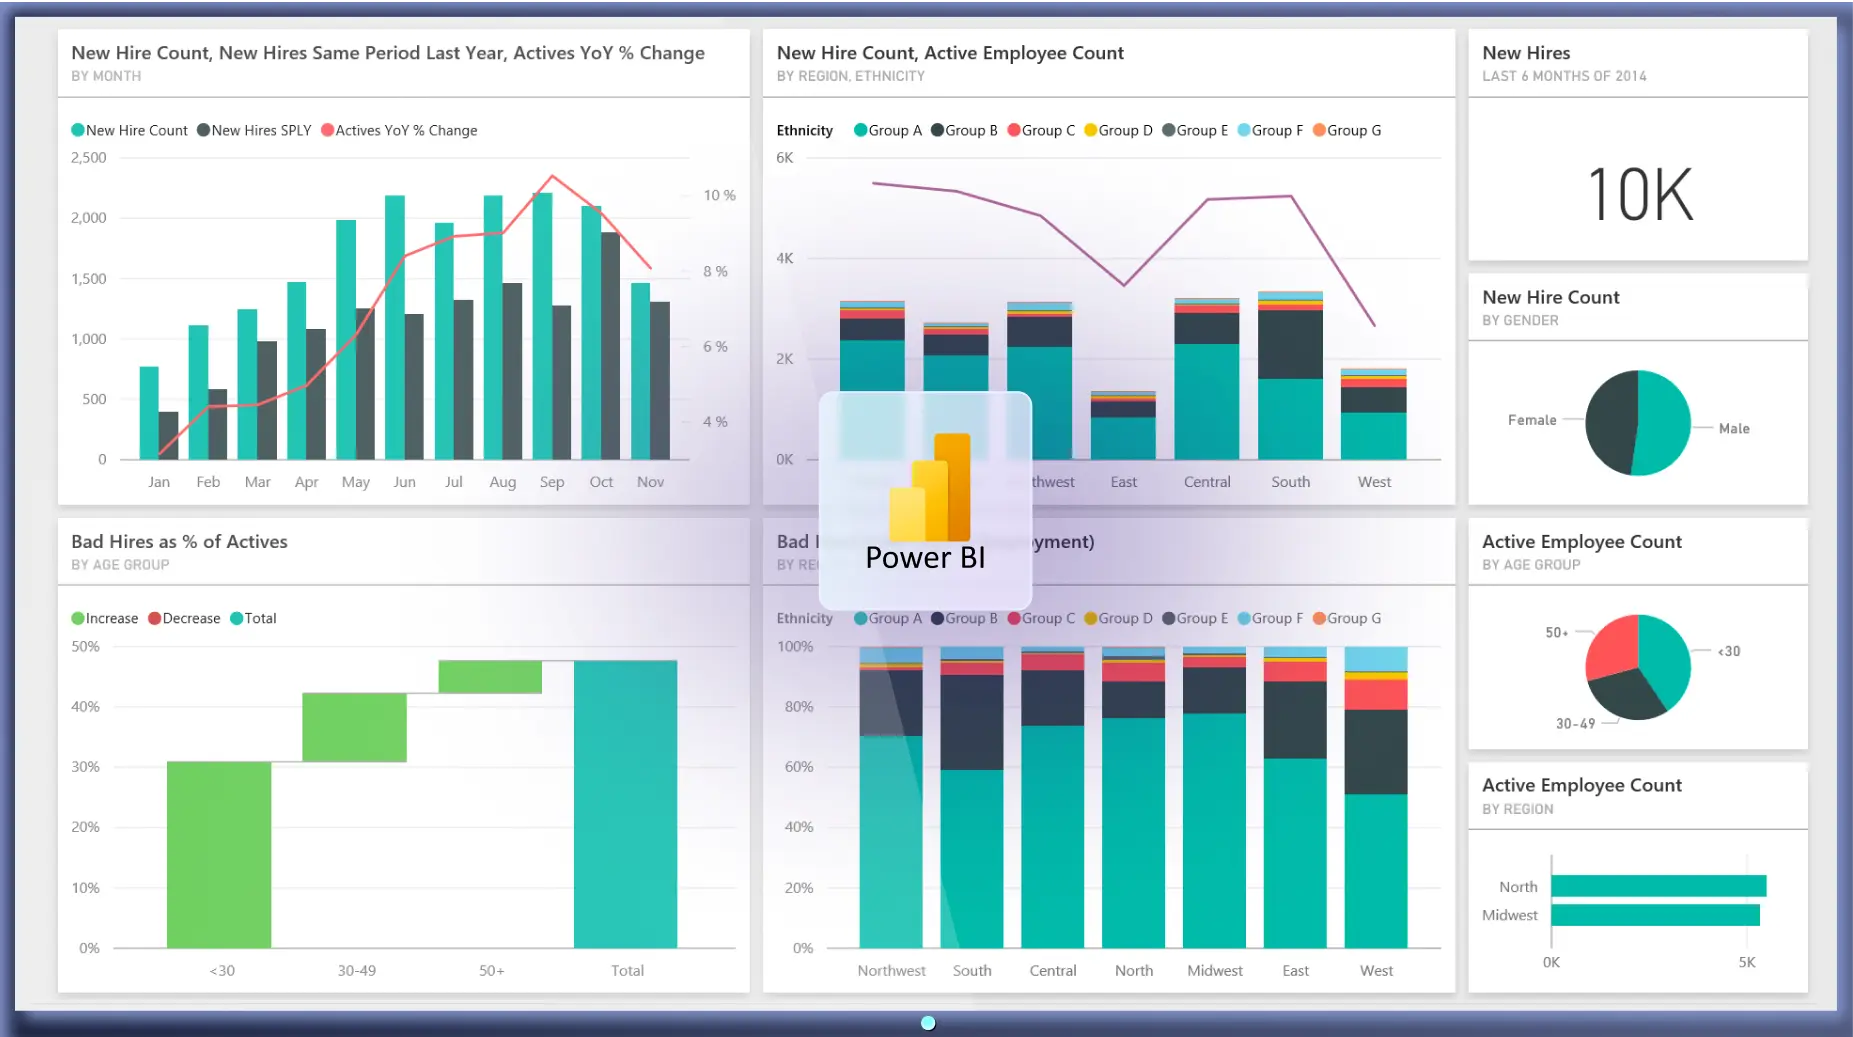
Bridge the gap between real-time data and decision-making with Fugo. Integrate your Microsoft Power BI dashboards seamlessly onto TV screens for secure, vibrant data visualization.
Tableau
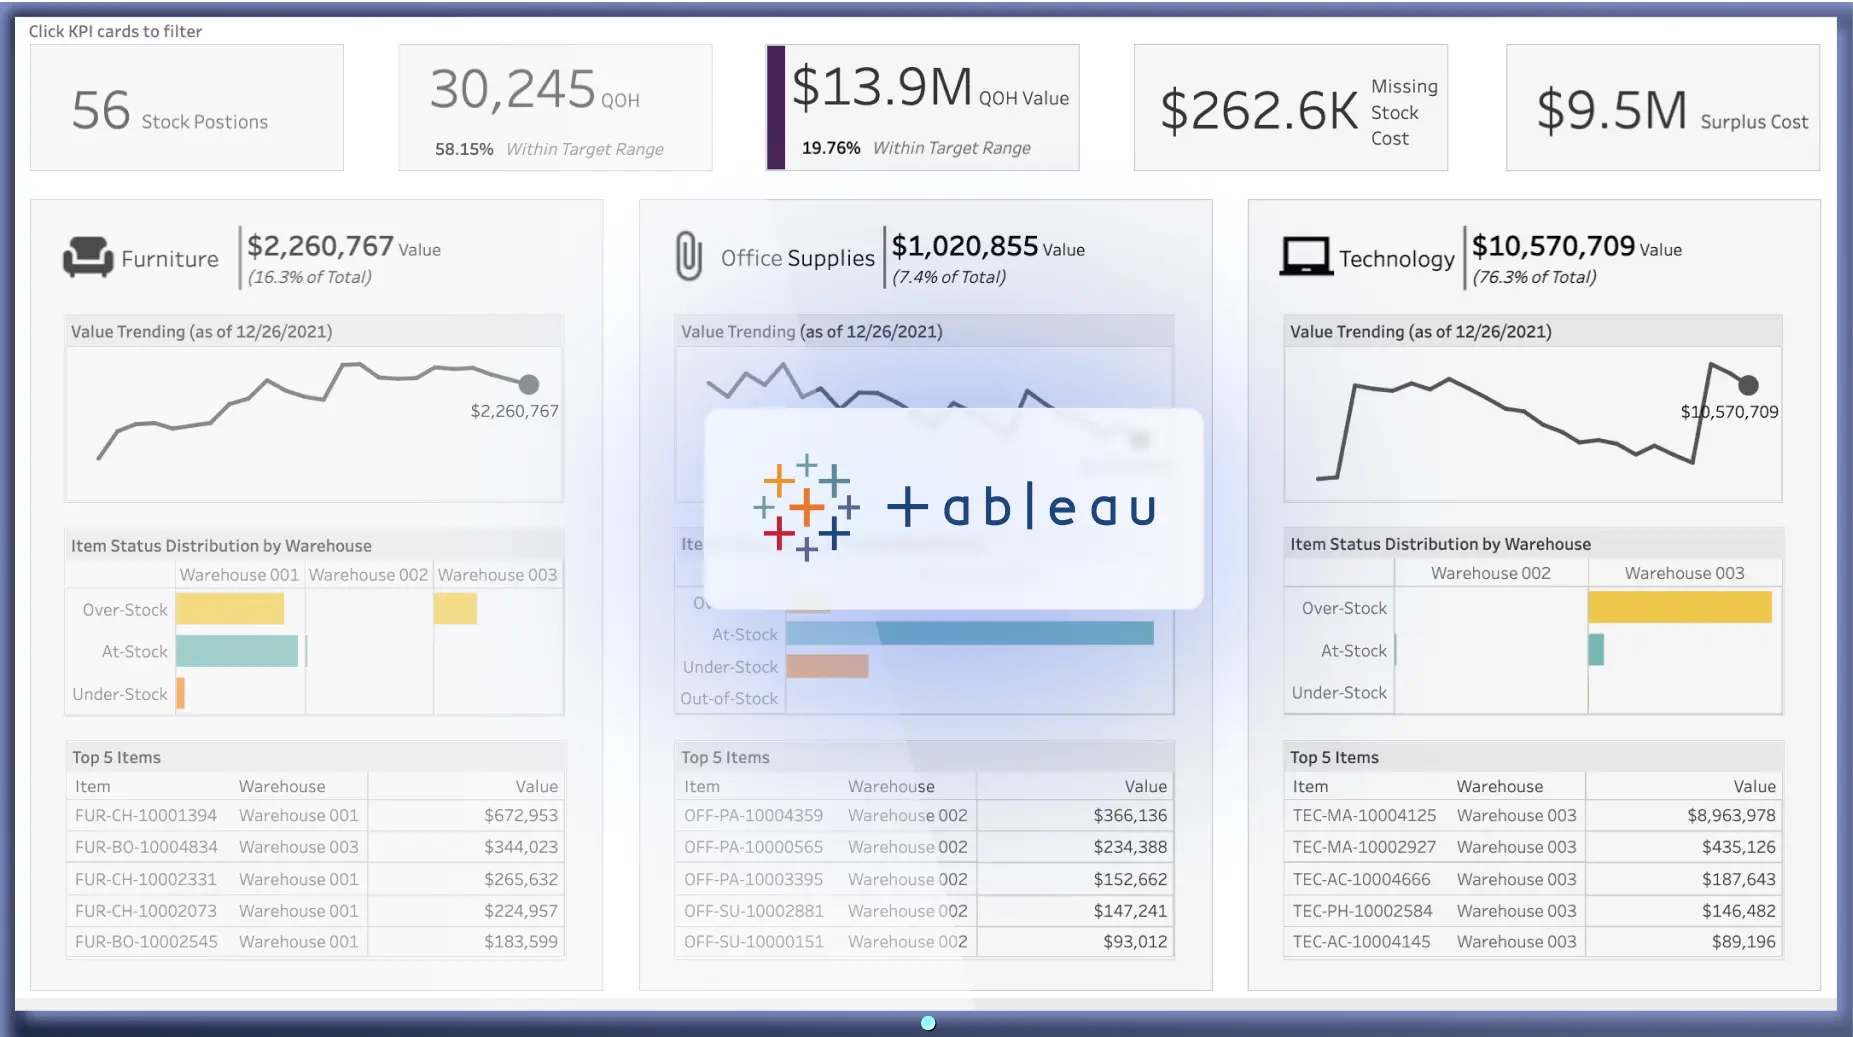
Amplify Tableau's data-driven power for forecasting, decision-making, and strategic planning by showcasing your Tableau dashboards on TV screens with Fugo, scaling your data reach like never before.
Salesforce
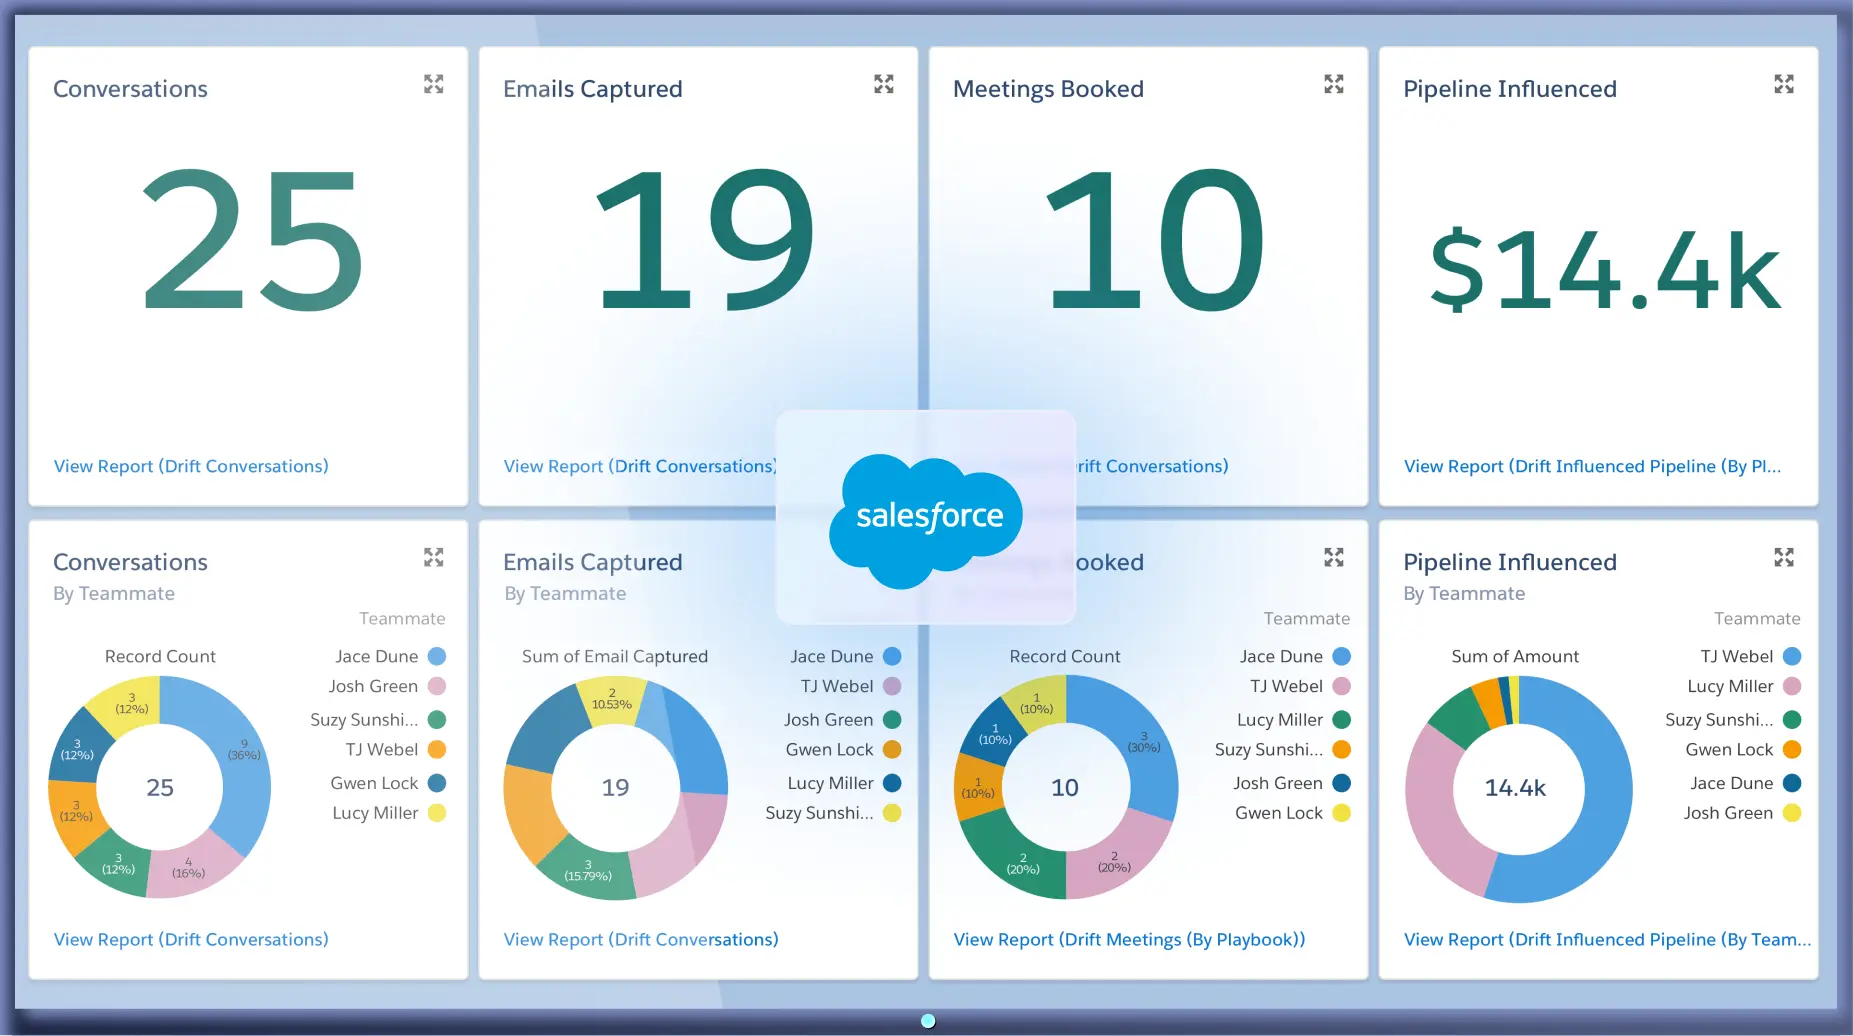
Fugo TV Dashboards allows your organization to create secure live sales performance & customer relationship data dashboards for the TV screens across your company.
Looker
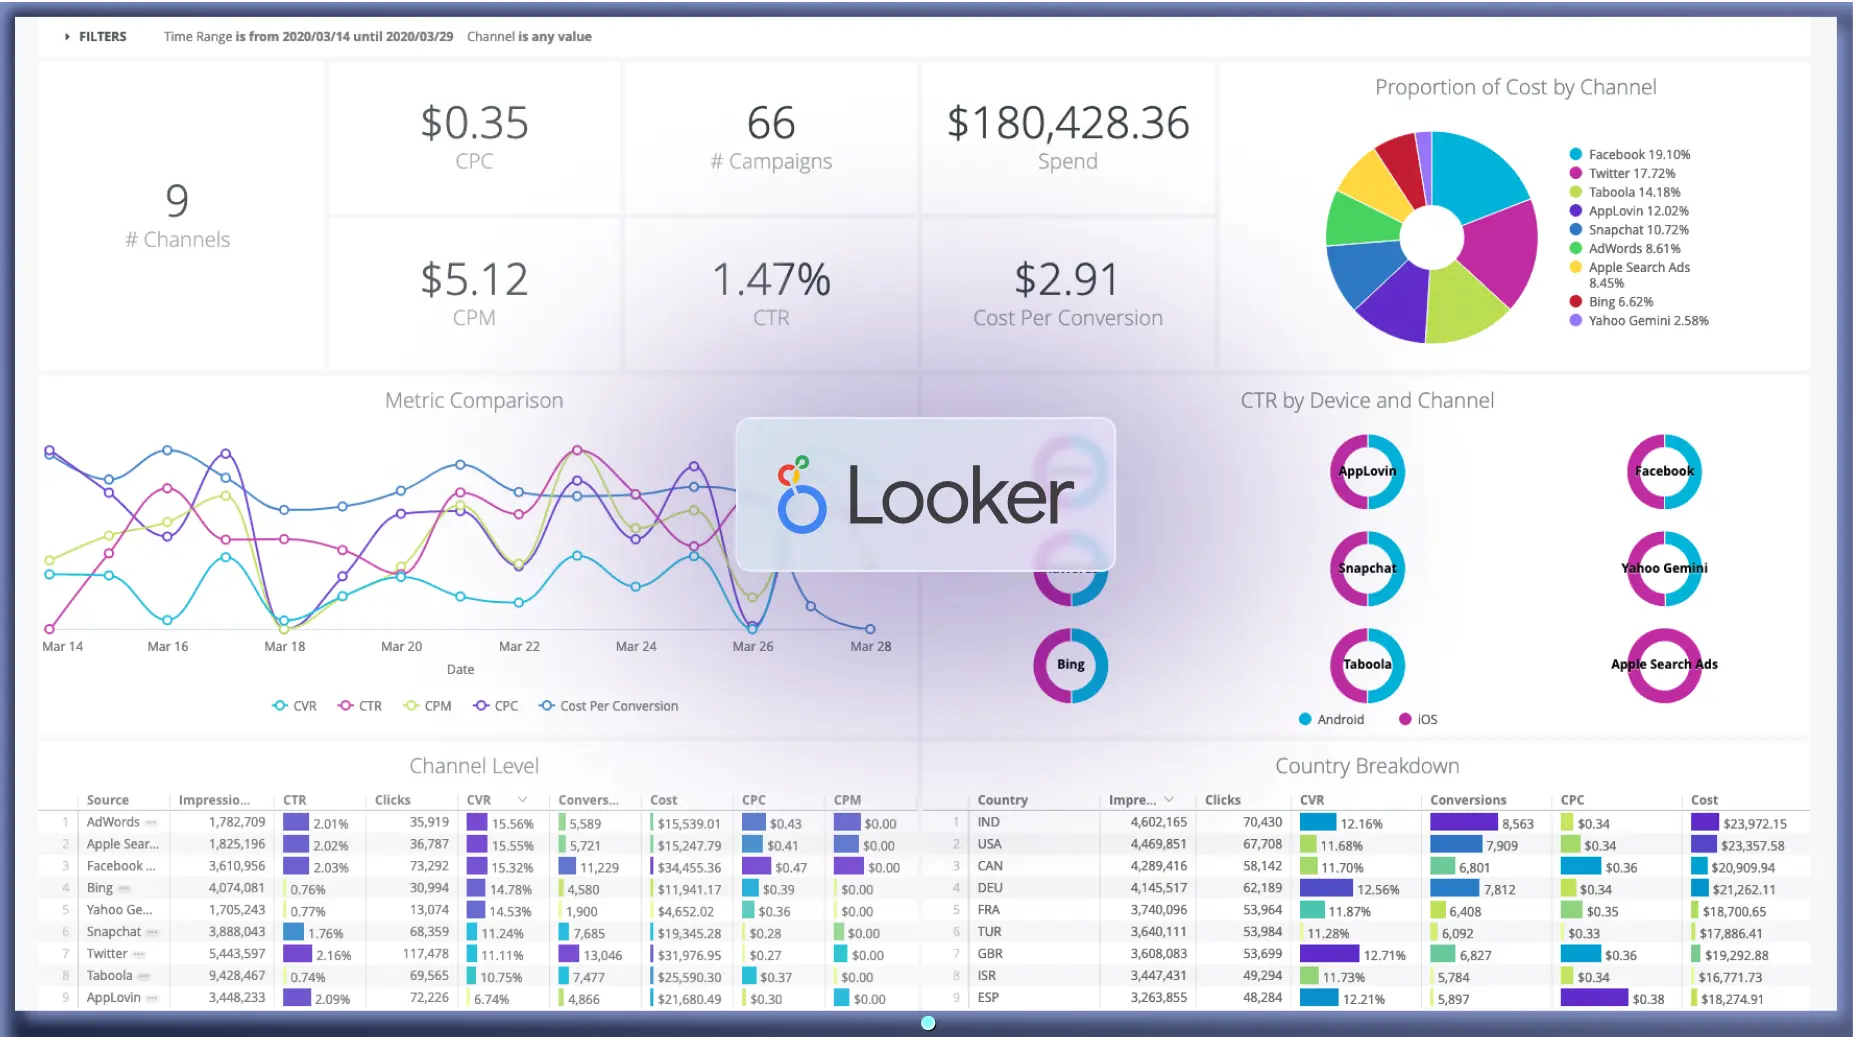
Dig into your data with Looker to find the answers to your most critical questions. Then broadcast them on screen to your teams to align their efforts toward the goals that matter.

Splunk
TV dashboards allow you to investigate, visualize, and alert on important business metrics, and predict problems before they happen. Get them set up up easily & affordable with Fugo.
Other dashboards
Look through various dashboards or filter by category
Birst
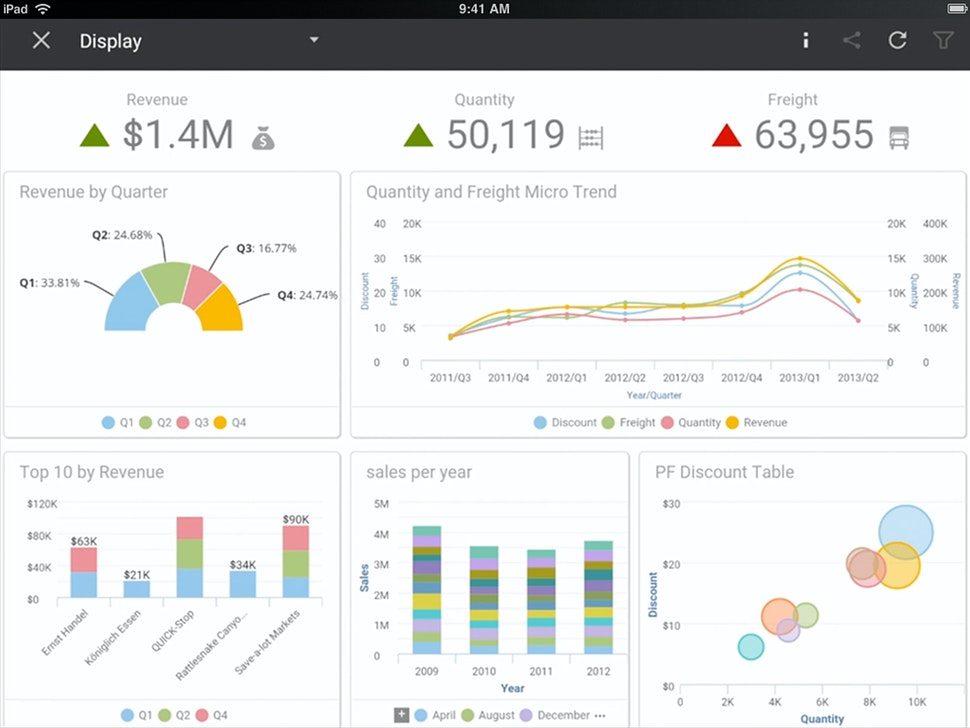
Gain insights with Birst's intuitive dashboard, offering real-time analytics, data visualization, and seamless integration for informed decision-making.

Board
The Board dashboard offers a comprehensive overview of organizational performance, enabling strategic decision-making with real-time data insights.
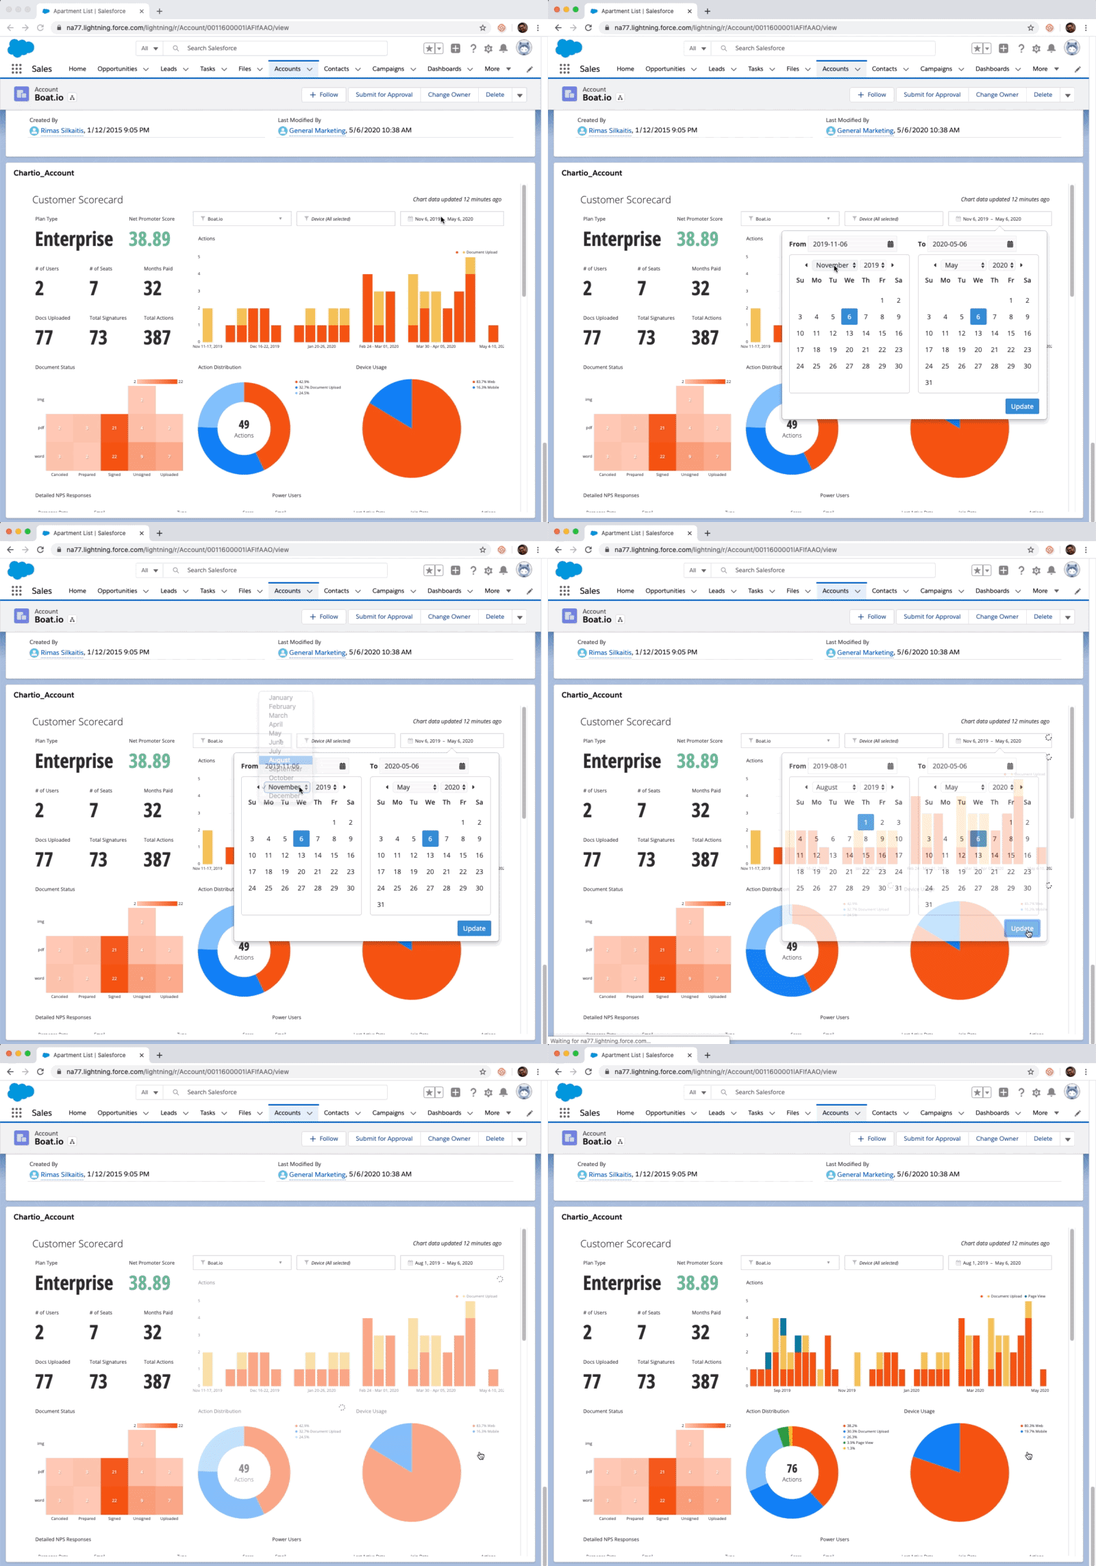
Chartio
Gain insights into your data with Chartio's interactive dashboard, offering customizable visualizations and real-time analytics for informed decision-making.

ClicData
ClicData's dashboard offers dynamic data visualization and real-time analytics to streamline decision-making and enhance business performance.
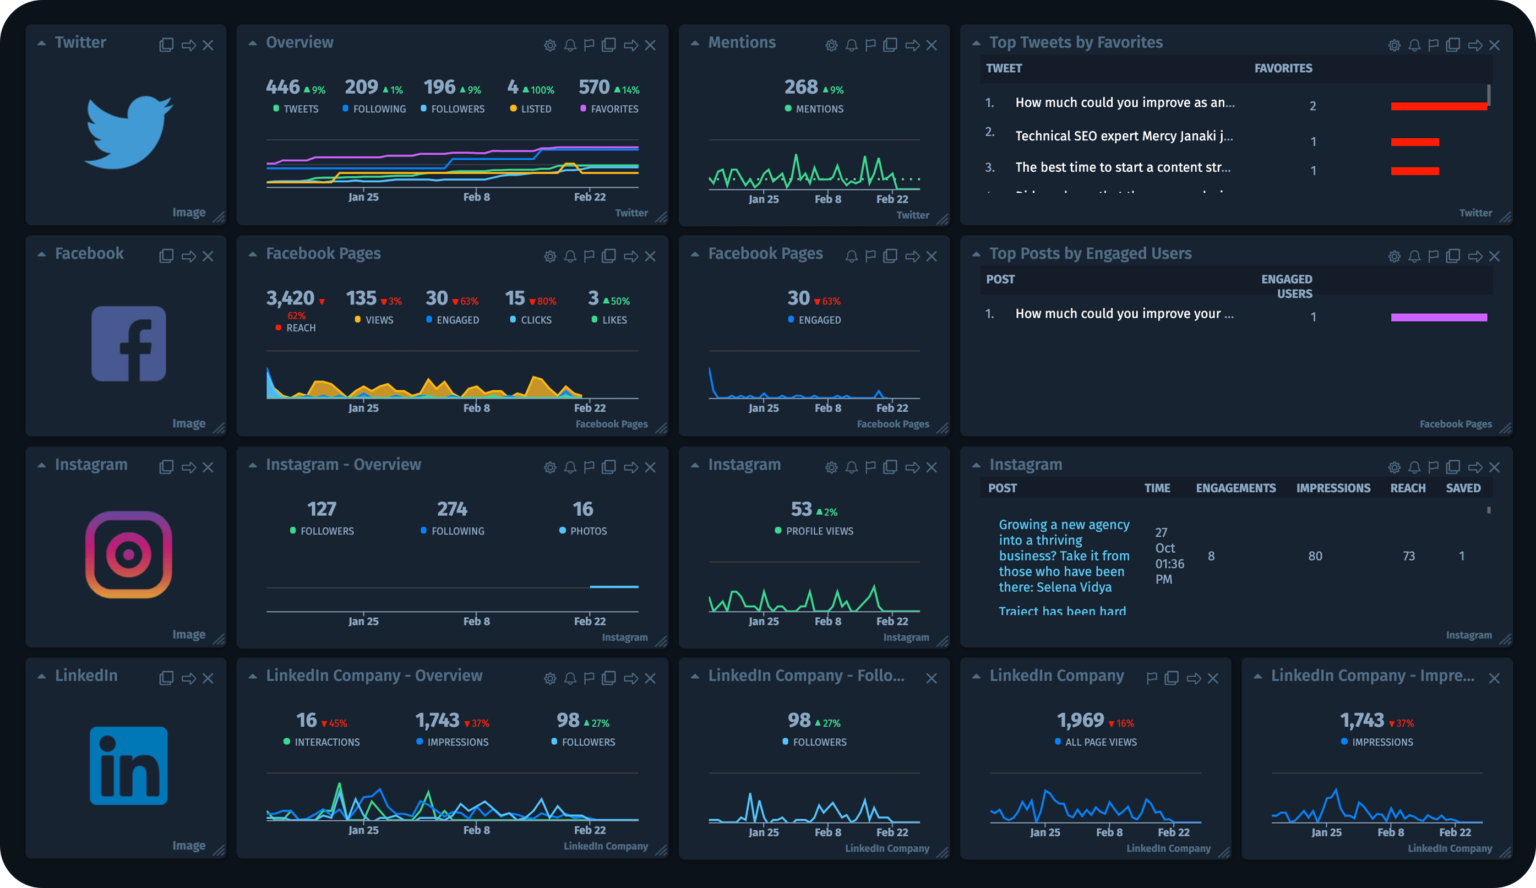
Cyfe
Monitor and analyze your business metrics in real-time with Cyfe's all-in-one dashboard, offering seamless integration and customizable widgets.

DashThis
Monitor your marketing performance effortlessly with DashThis, offering real-time insights and customizable reports for data-driven decision-making.

Databox
Monitor your business metrics effortlessly with Databox, a customizable dashboard that integrates data from multiple sources for real-time insights.
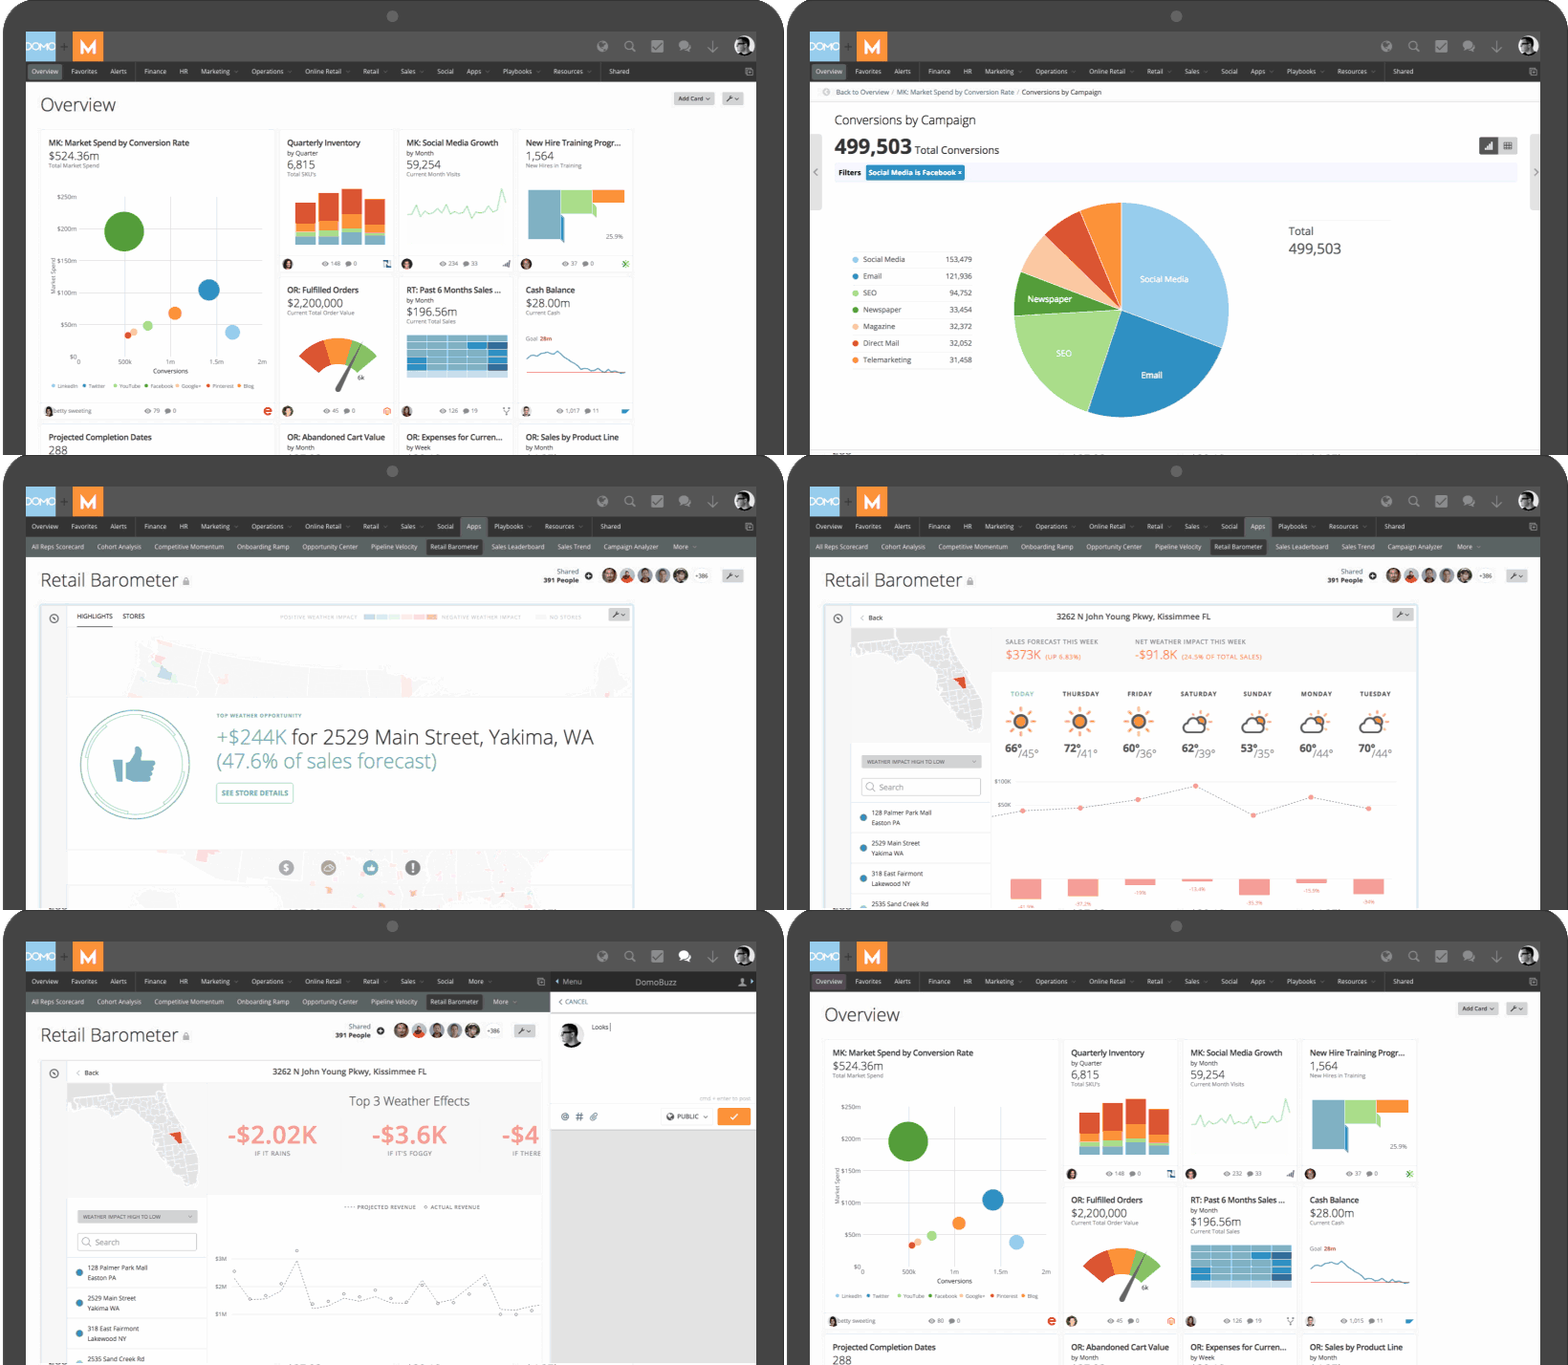
Domo
Gain insights into your business performance with Domo's interactive dashboard, featuring real-time data visualization and customizable analytics.
Dundas
The Dundas dashboard provides comprehensive data visualization tools to enhance business intelligence and decision-making with real-time insights.

Geckoboard
Monitor your team's performance and key metrics in real-time with this intuitive Geckoboard dashboard, designed for seamless data visualization.
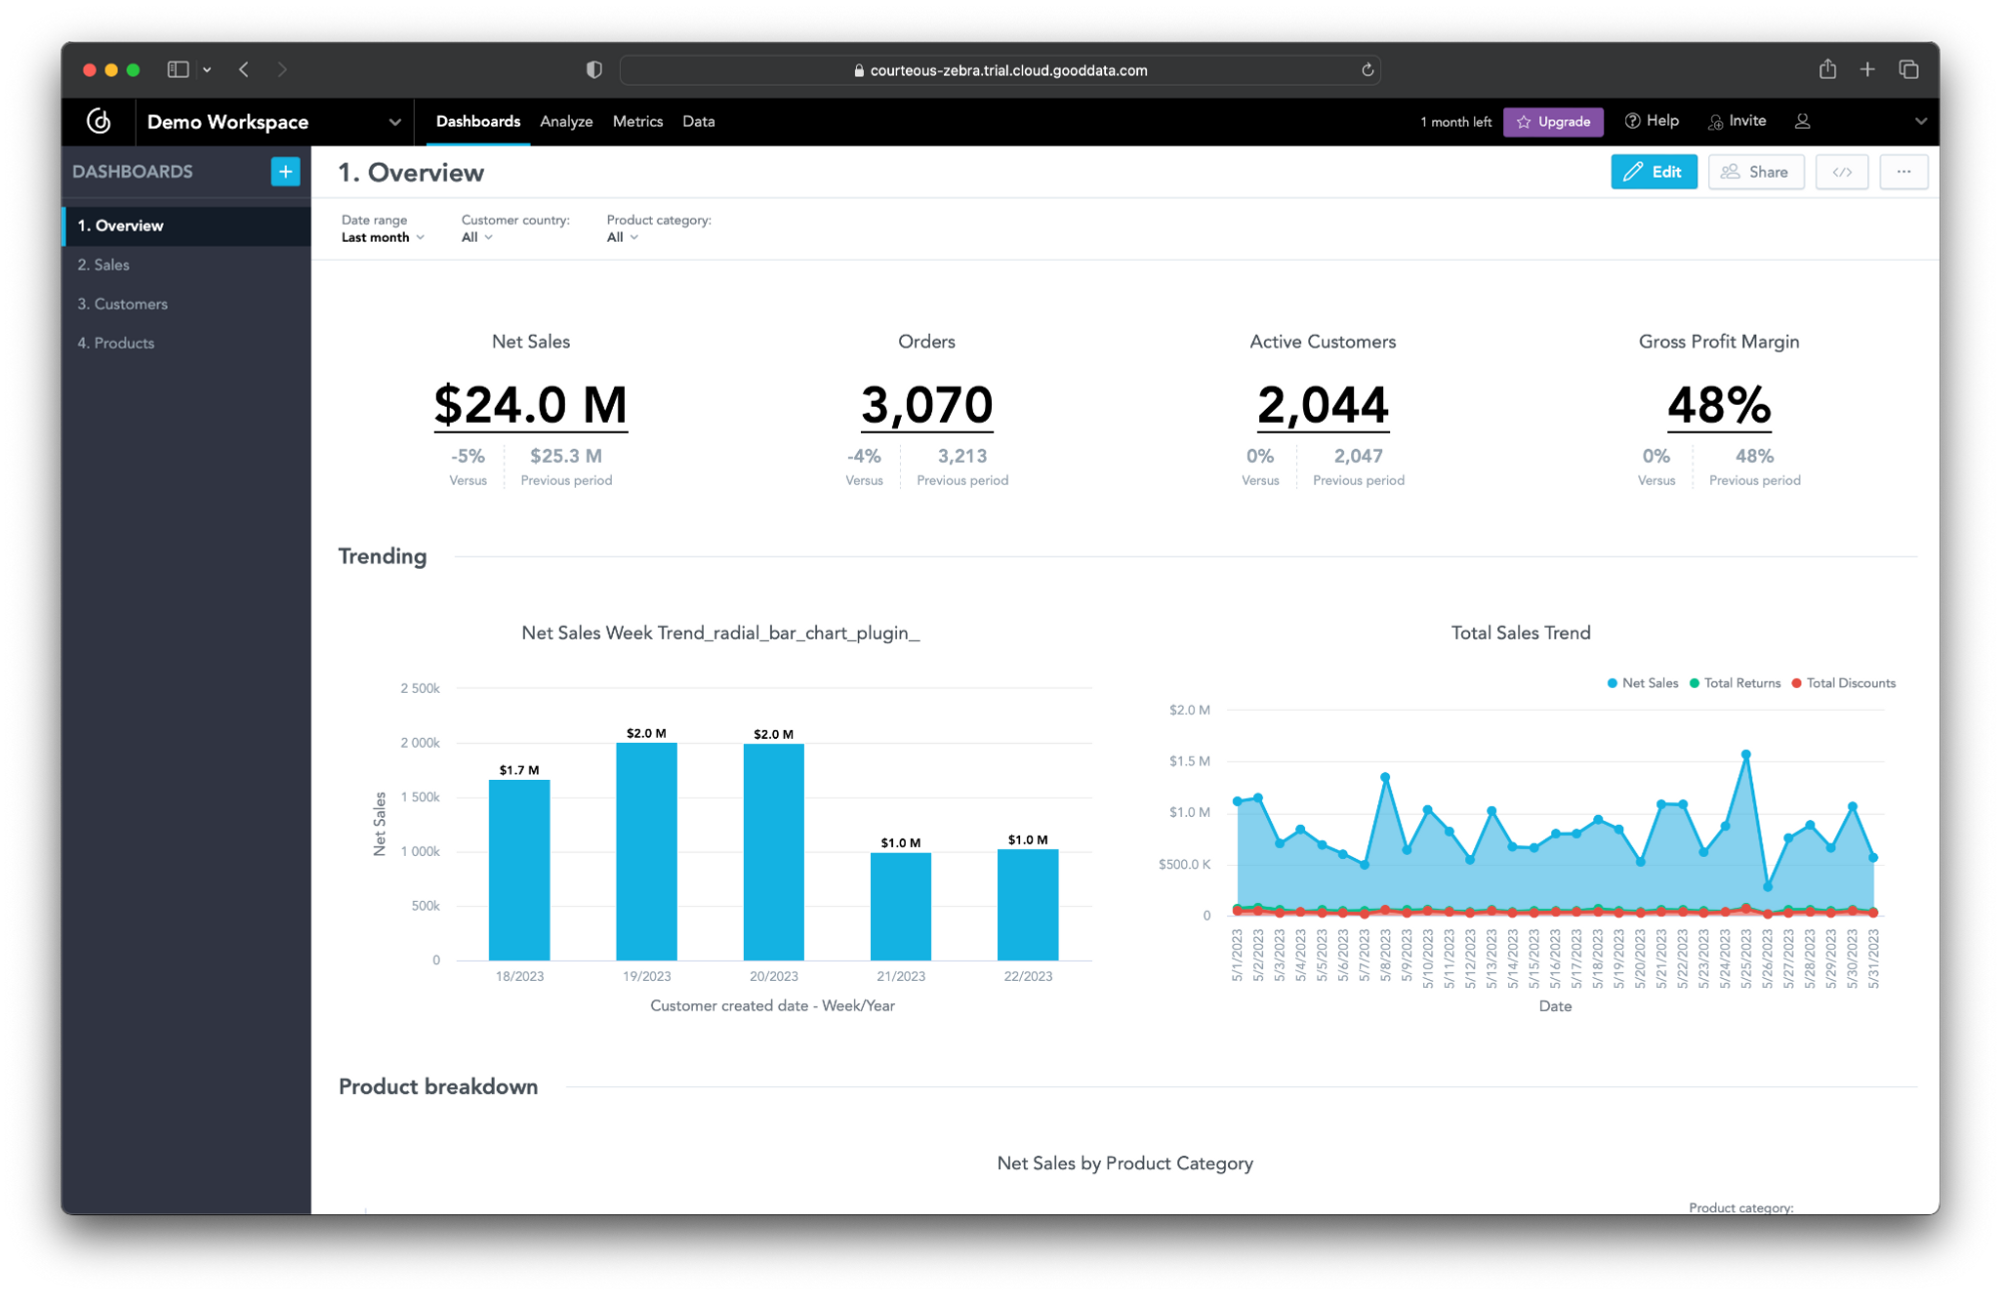
GoodData
Gain insights with GoodData's comprehensive dashboard, offering real-time analytics, customizable reports, and intuitive data visualization tools.
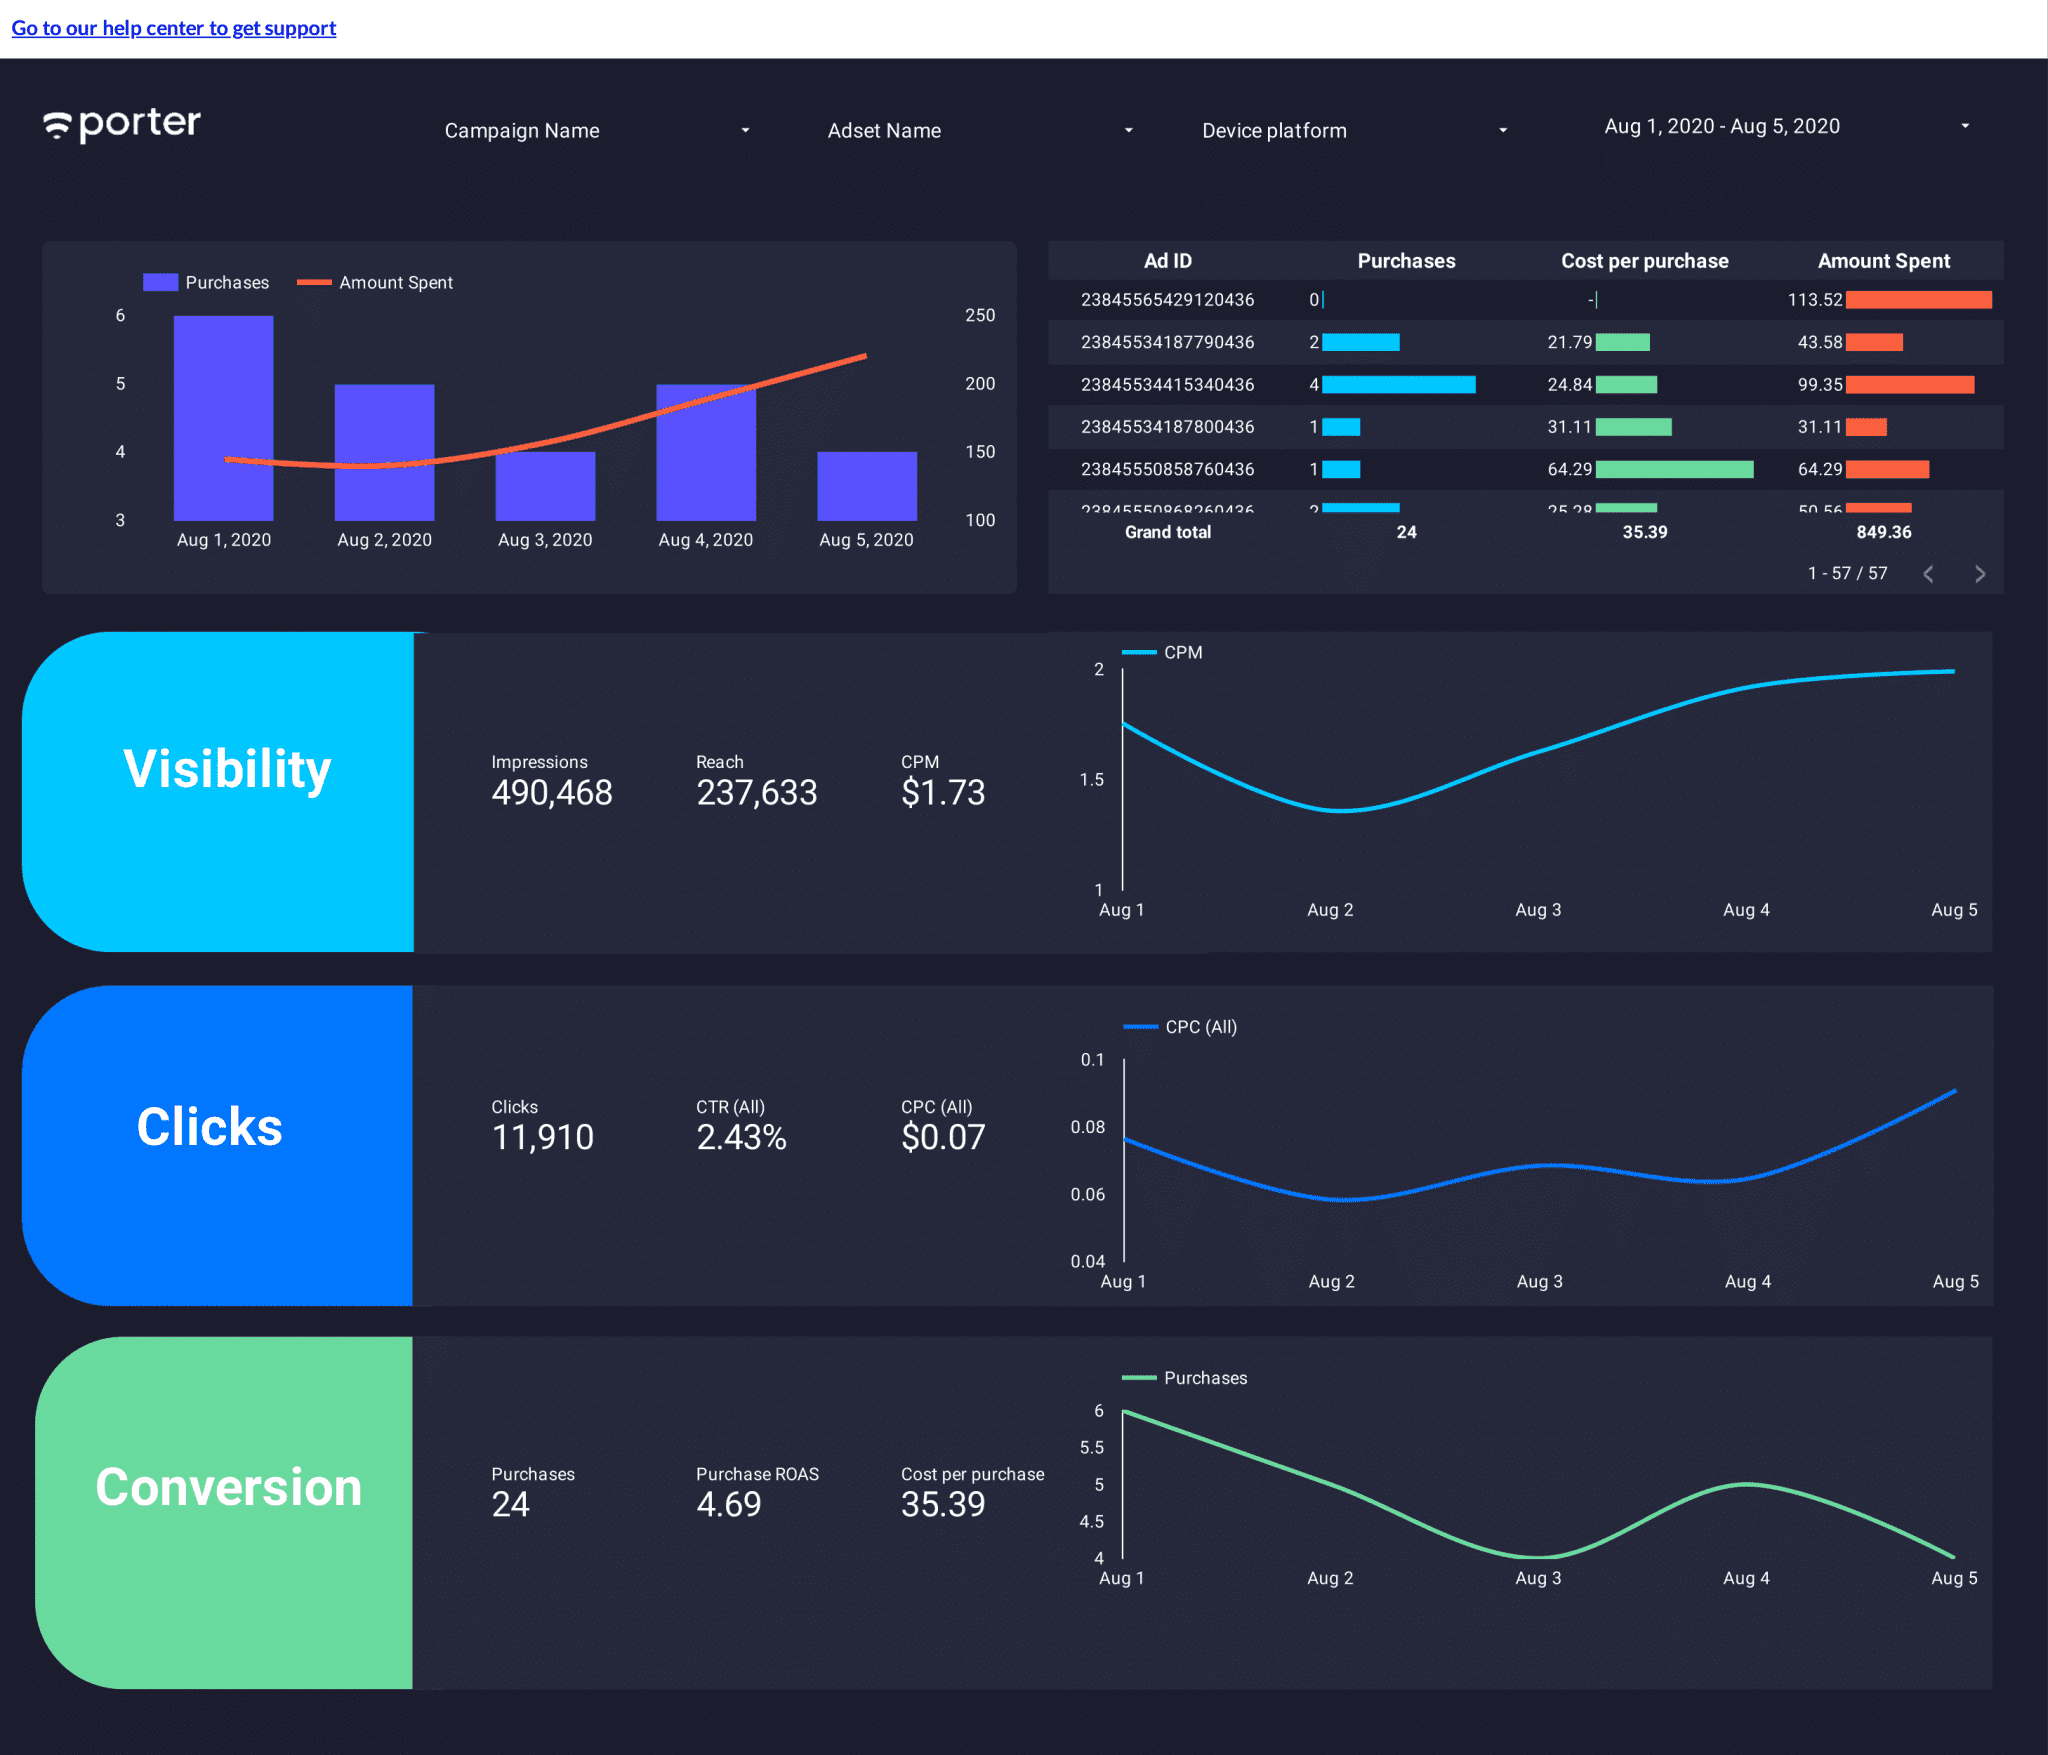
Google Data Studio
Gain insights with this Google Data Studio dashboard, offering real-time data visualization for informed decision-making and performance tracking.
Grow
The Grow dashboard provides real-time insights and analytics to help businesses track performance and make data-driven decisions efficiently.
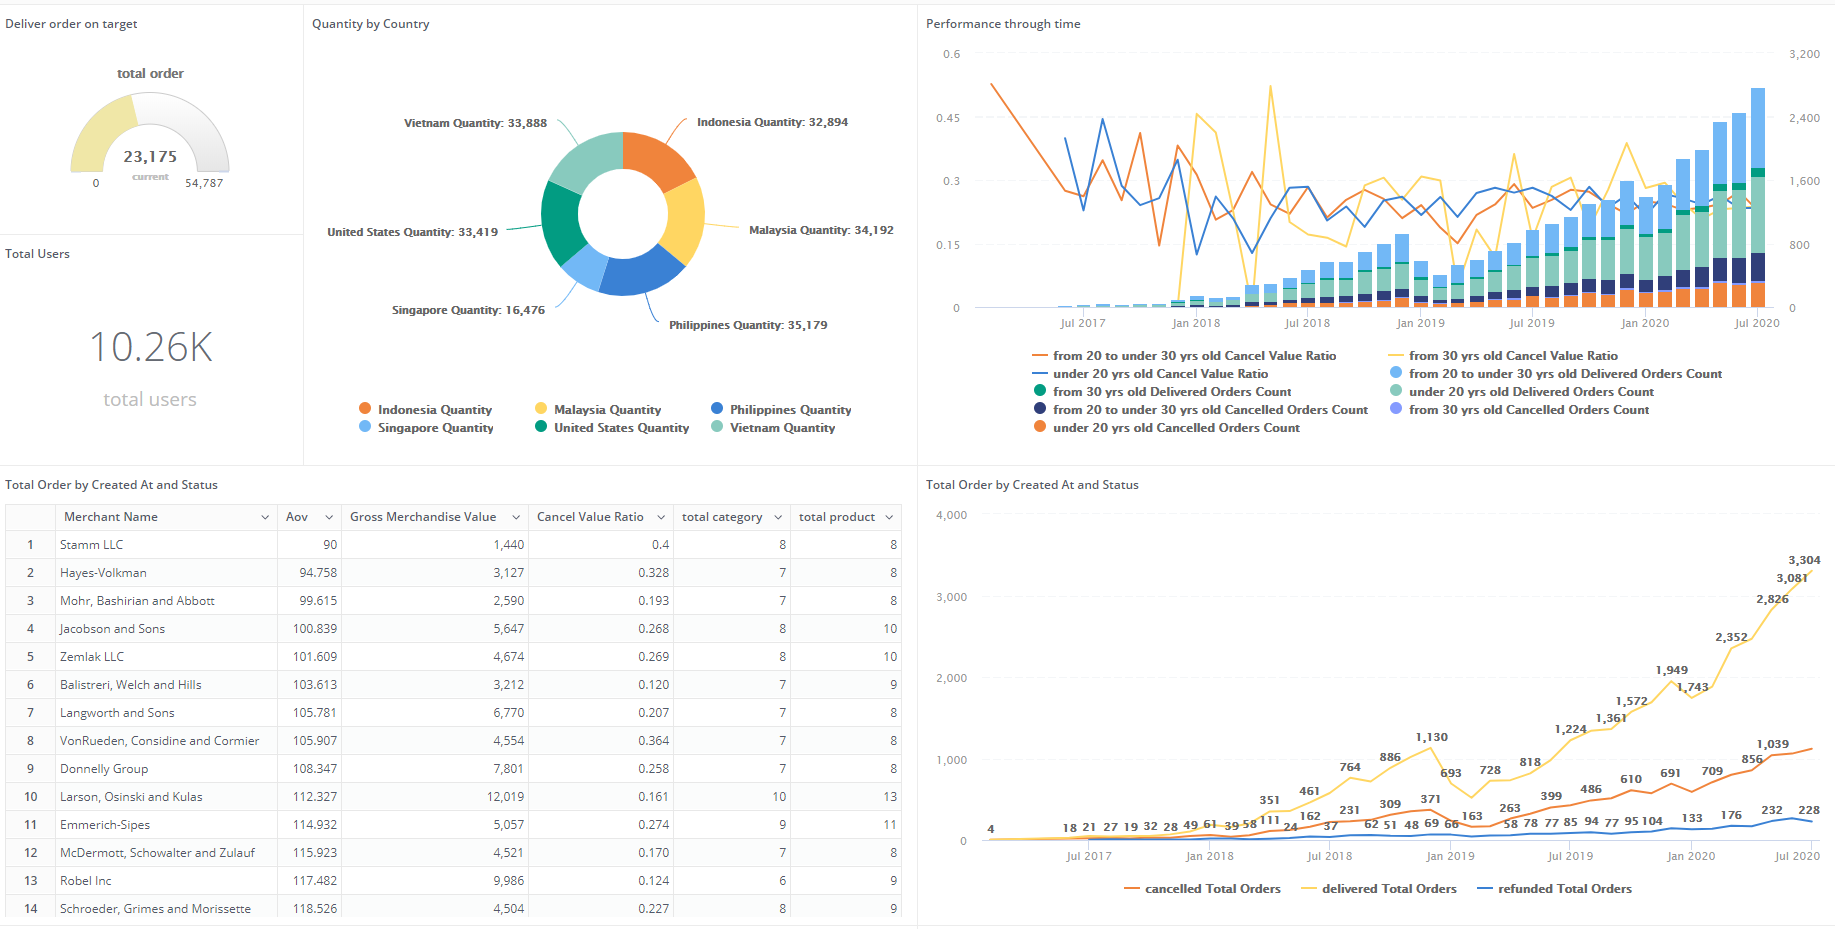
Holistics
Gain insights and make data-driven decisions with Holistics' interactive dashboard, offering real-time analytics and customizable reports.

IBM Cognos Analytics
Unlock insights with IBM Cognos Analytics dashboard, offering intuitive data visualization and AI-driven analytics for informed decision-making.
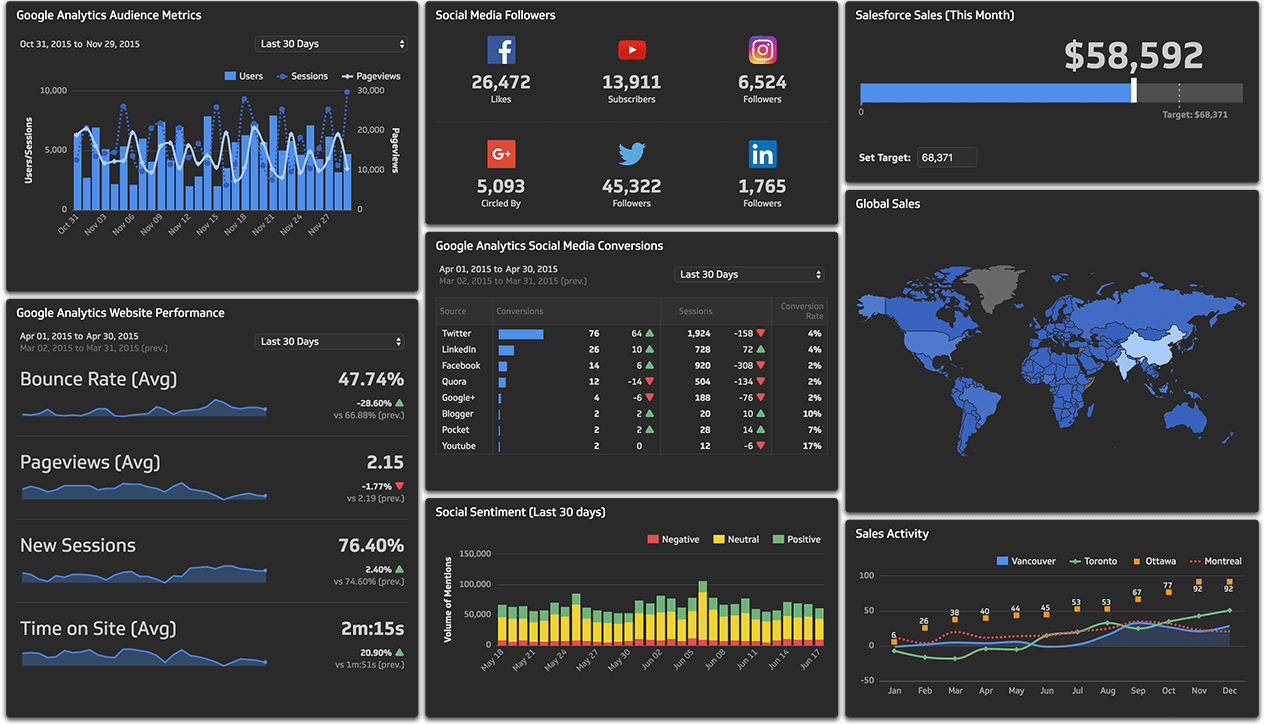
Klipfolio
Gain real-time insights and track key performance metrics with the customizable Klipfolio dashboard for data-driven decision-making.
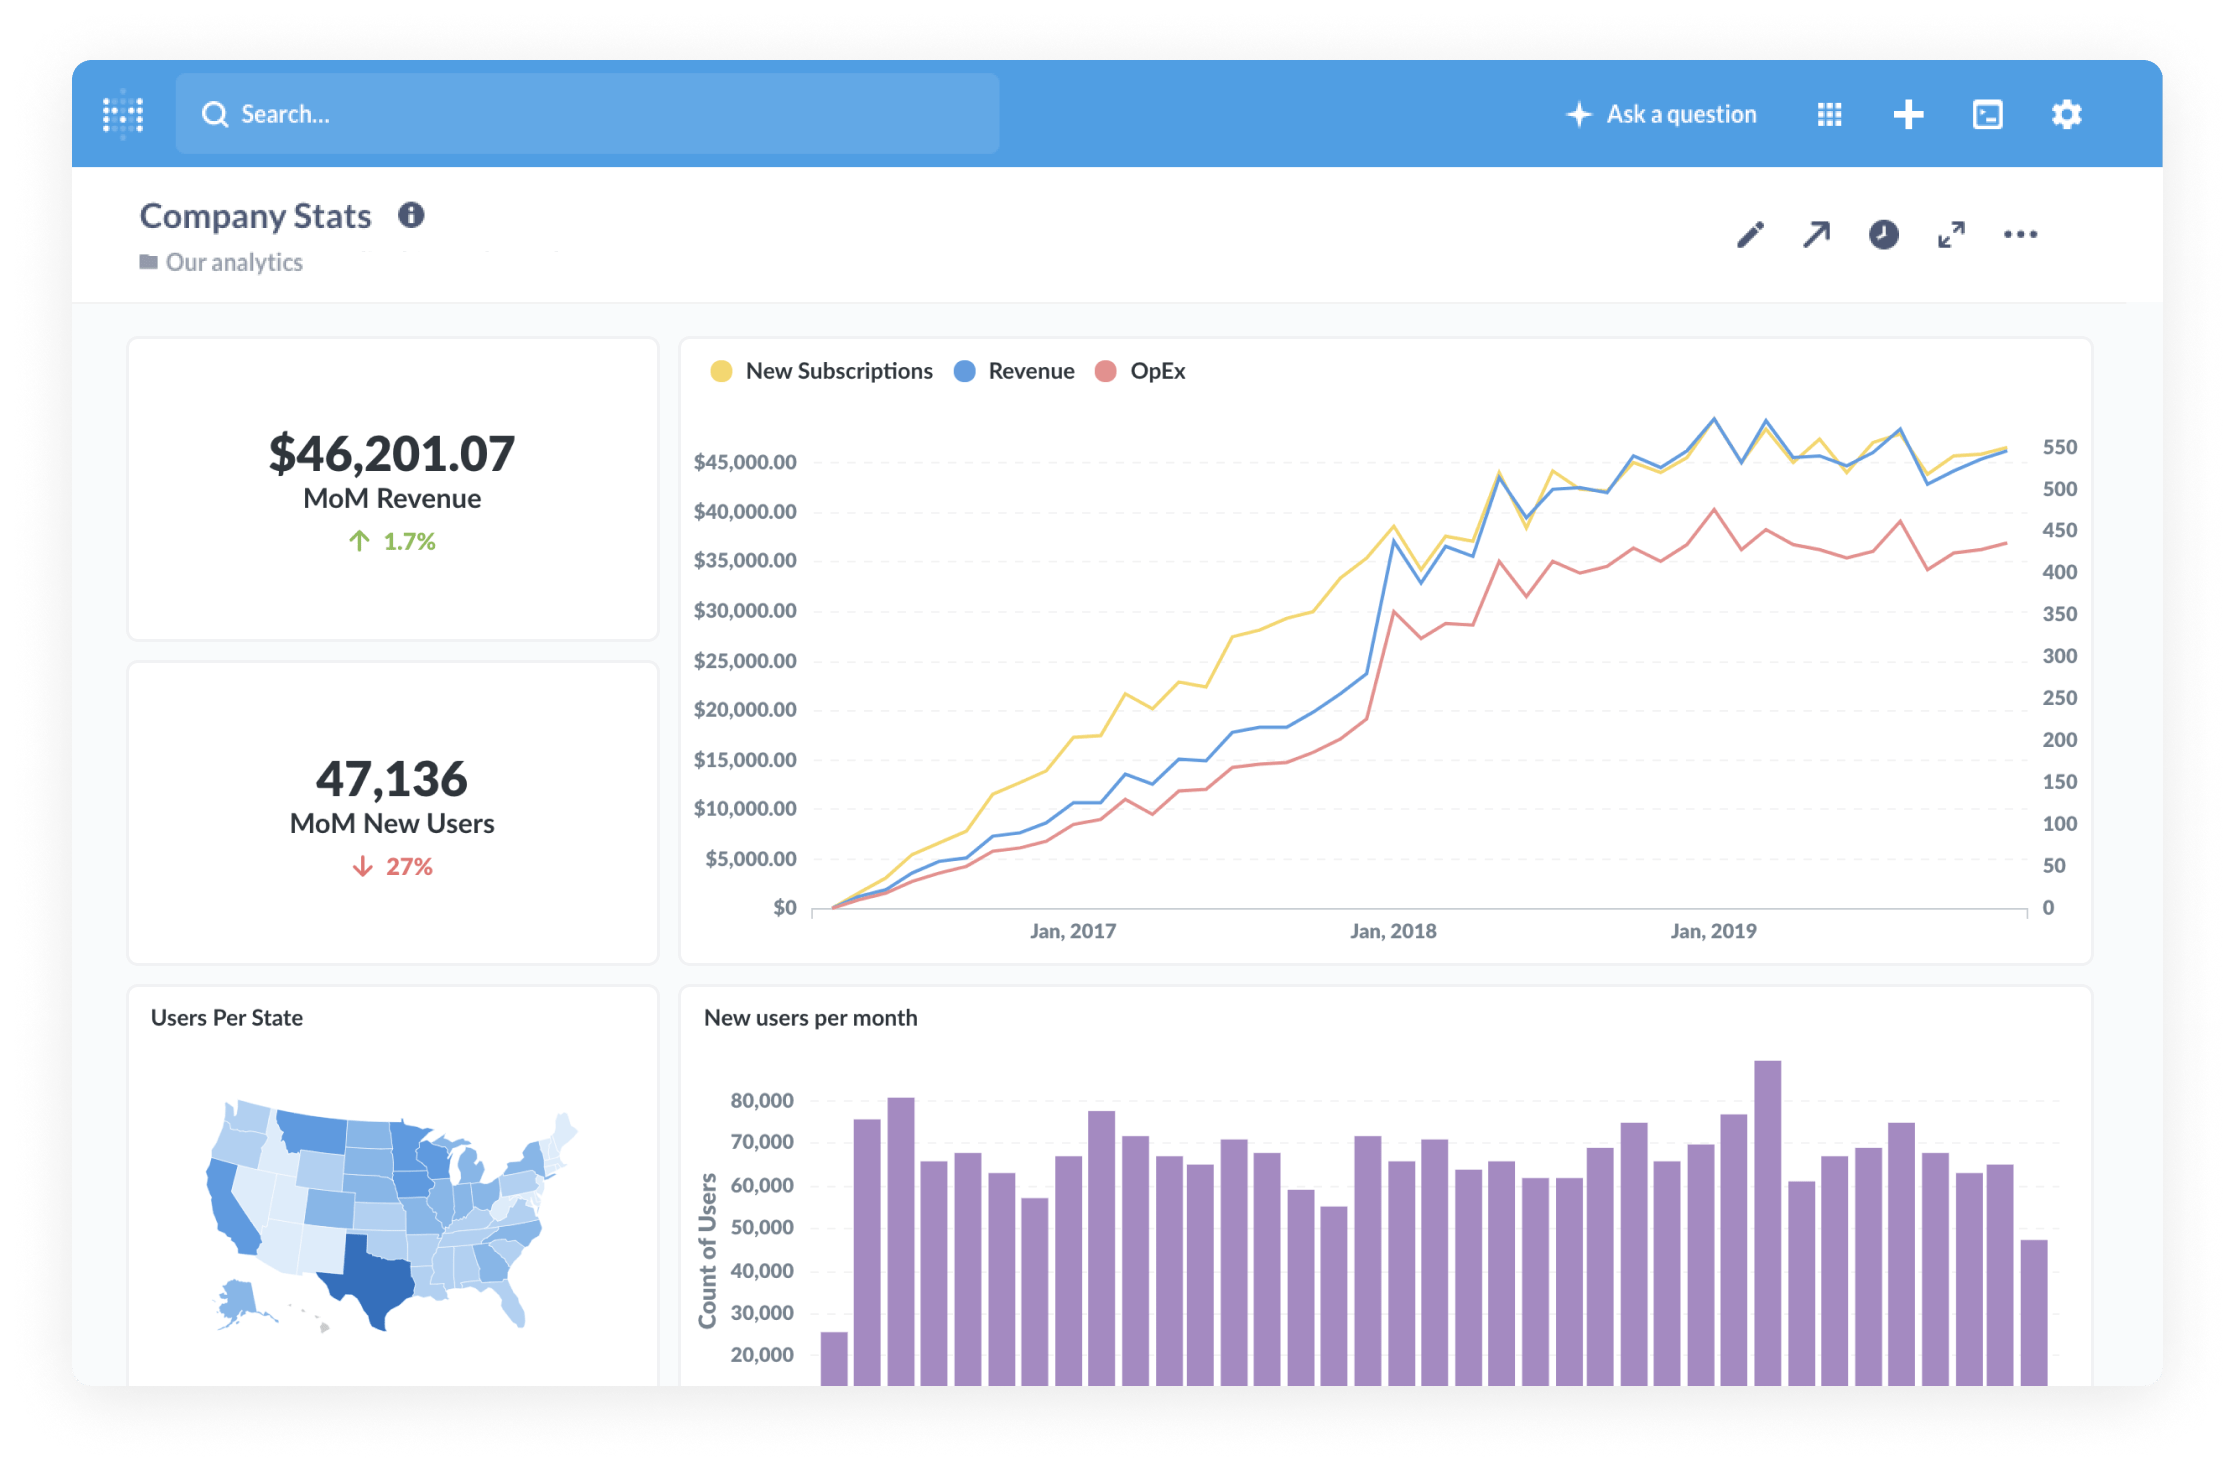
Metabase
Gain insights into your data with Metabase's interactive dashboard, designed for easy visualization and analysis of key business metrics.
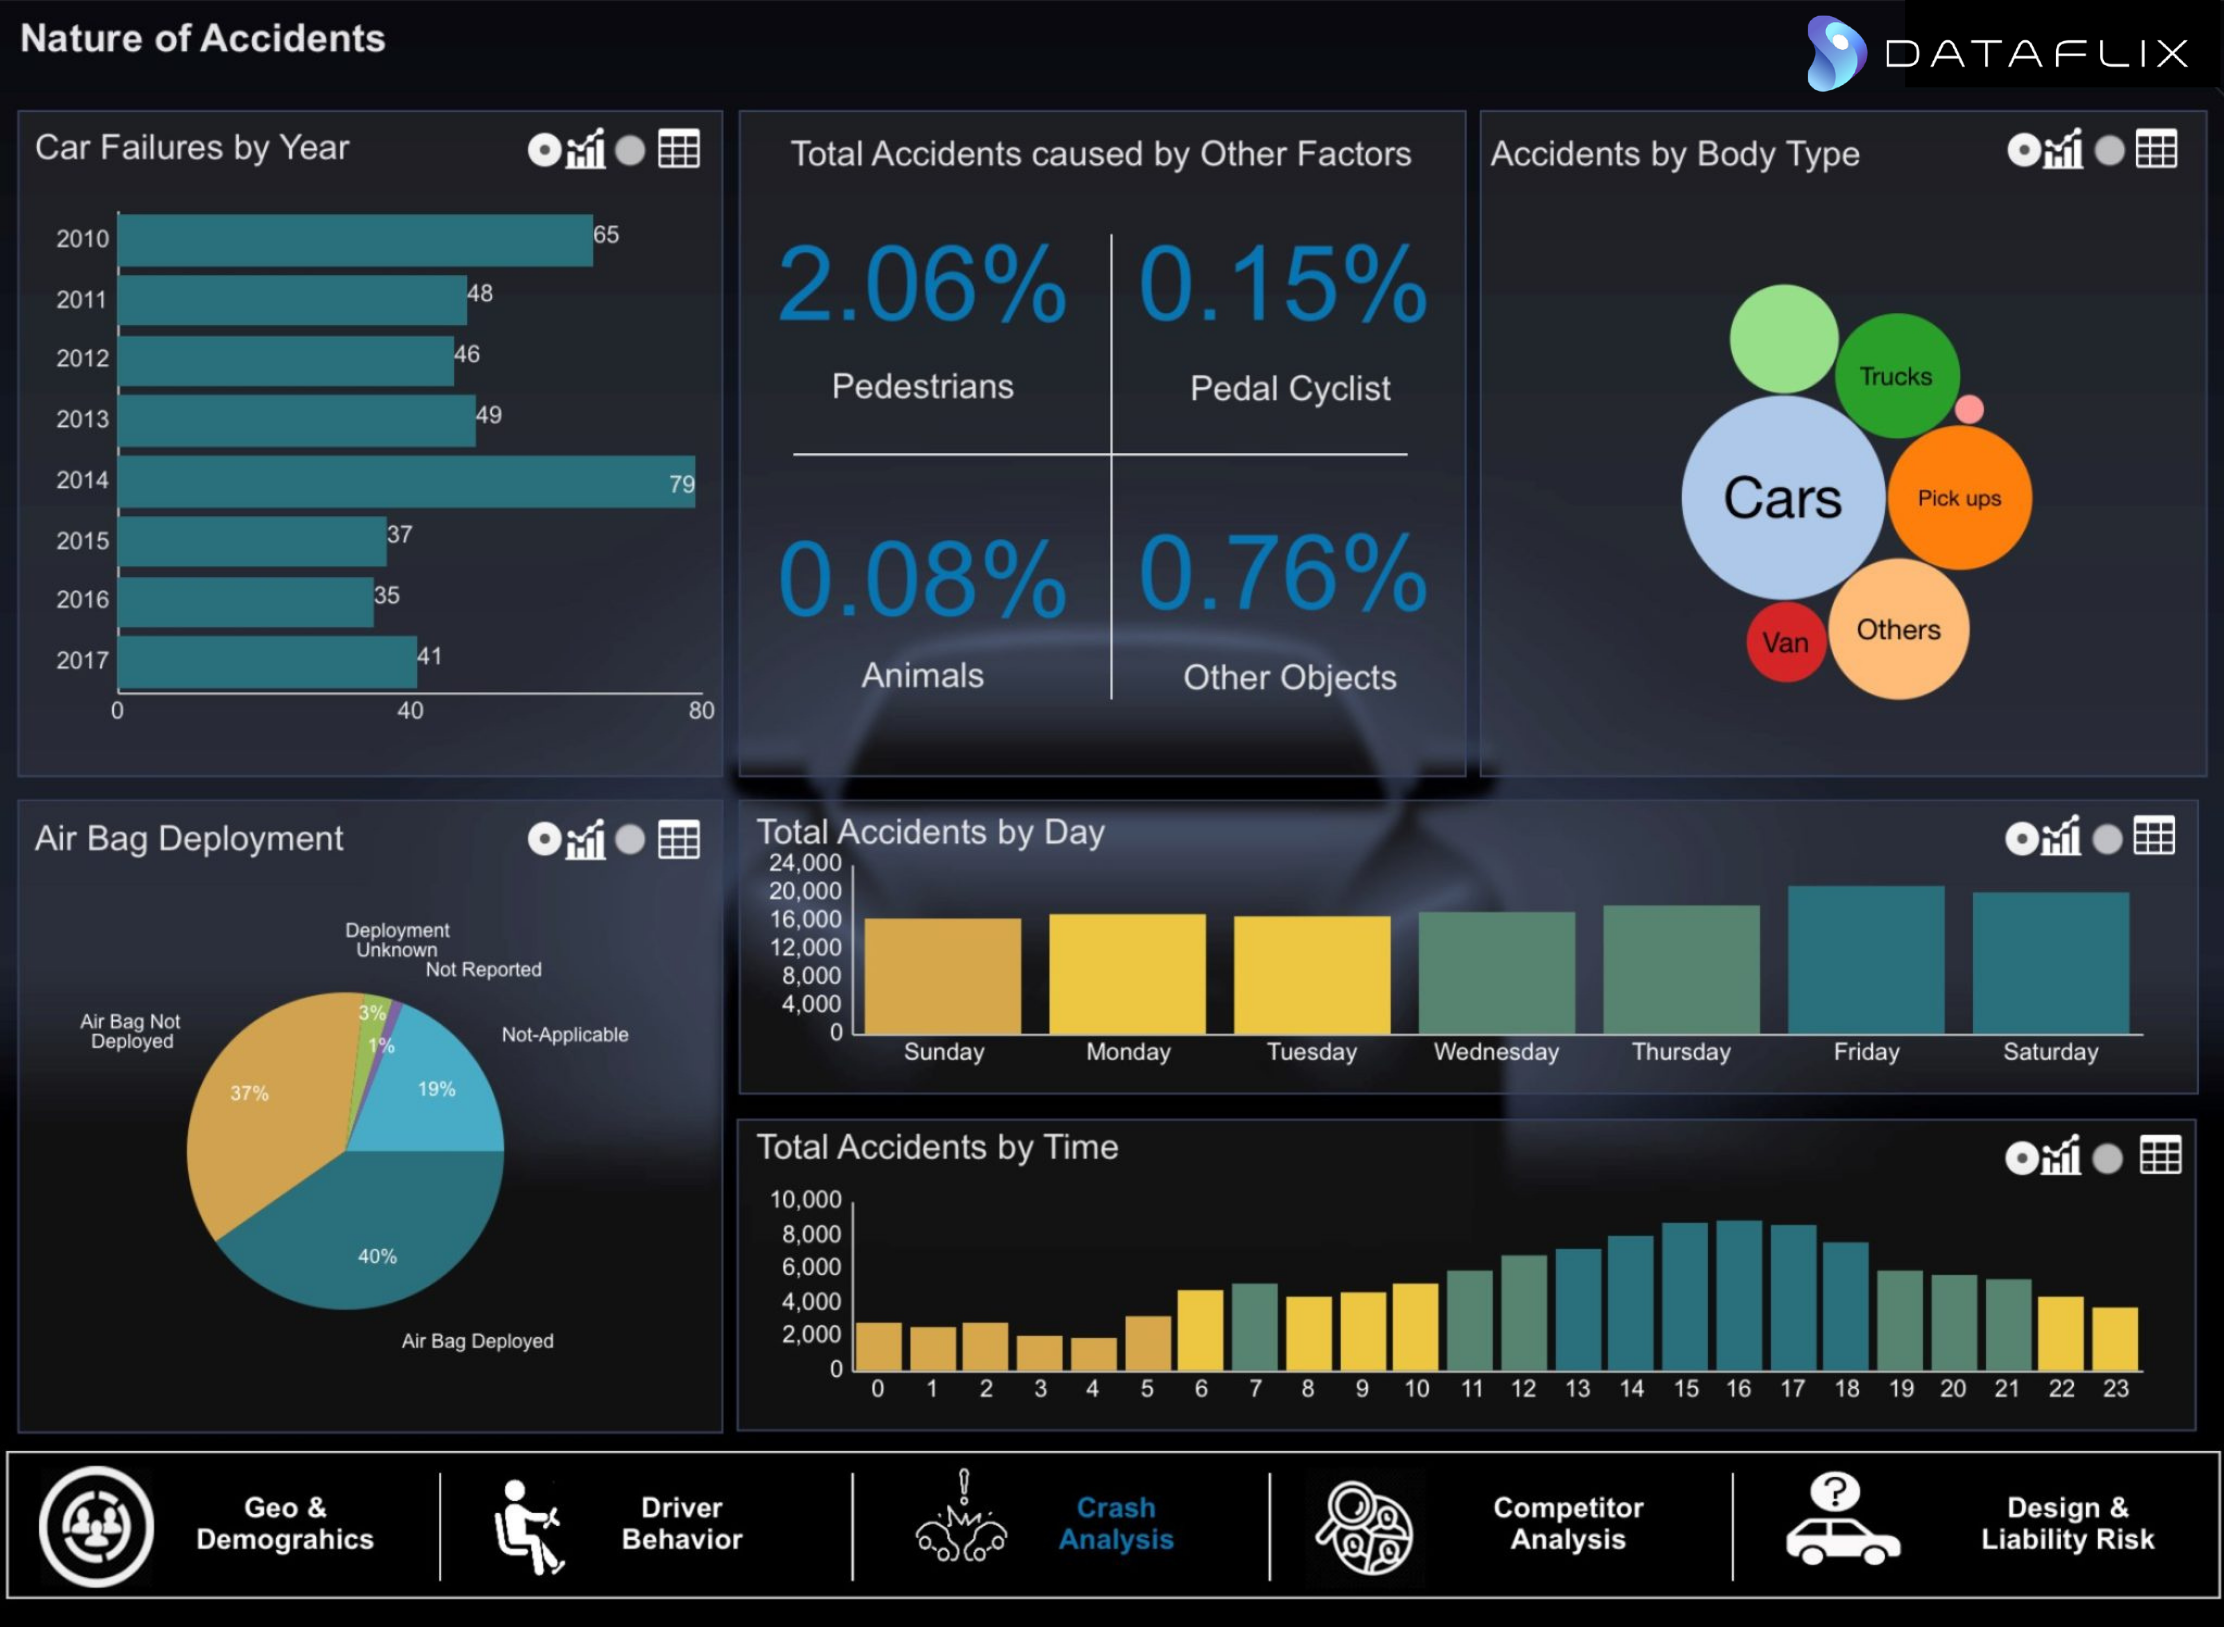
MicroStrategy
Gain insights with the MicroStrategy dashboard, offering real-time analytics, customizable reports, and data visualization for informed decision-making.
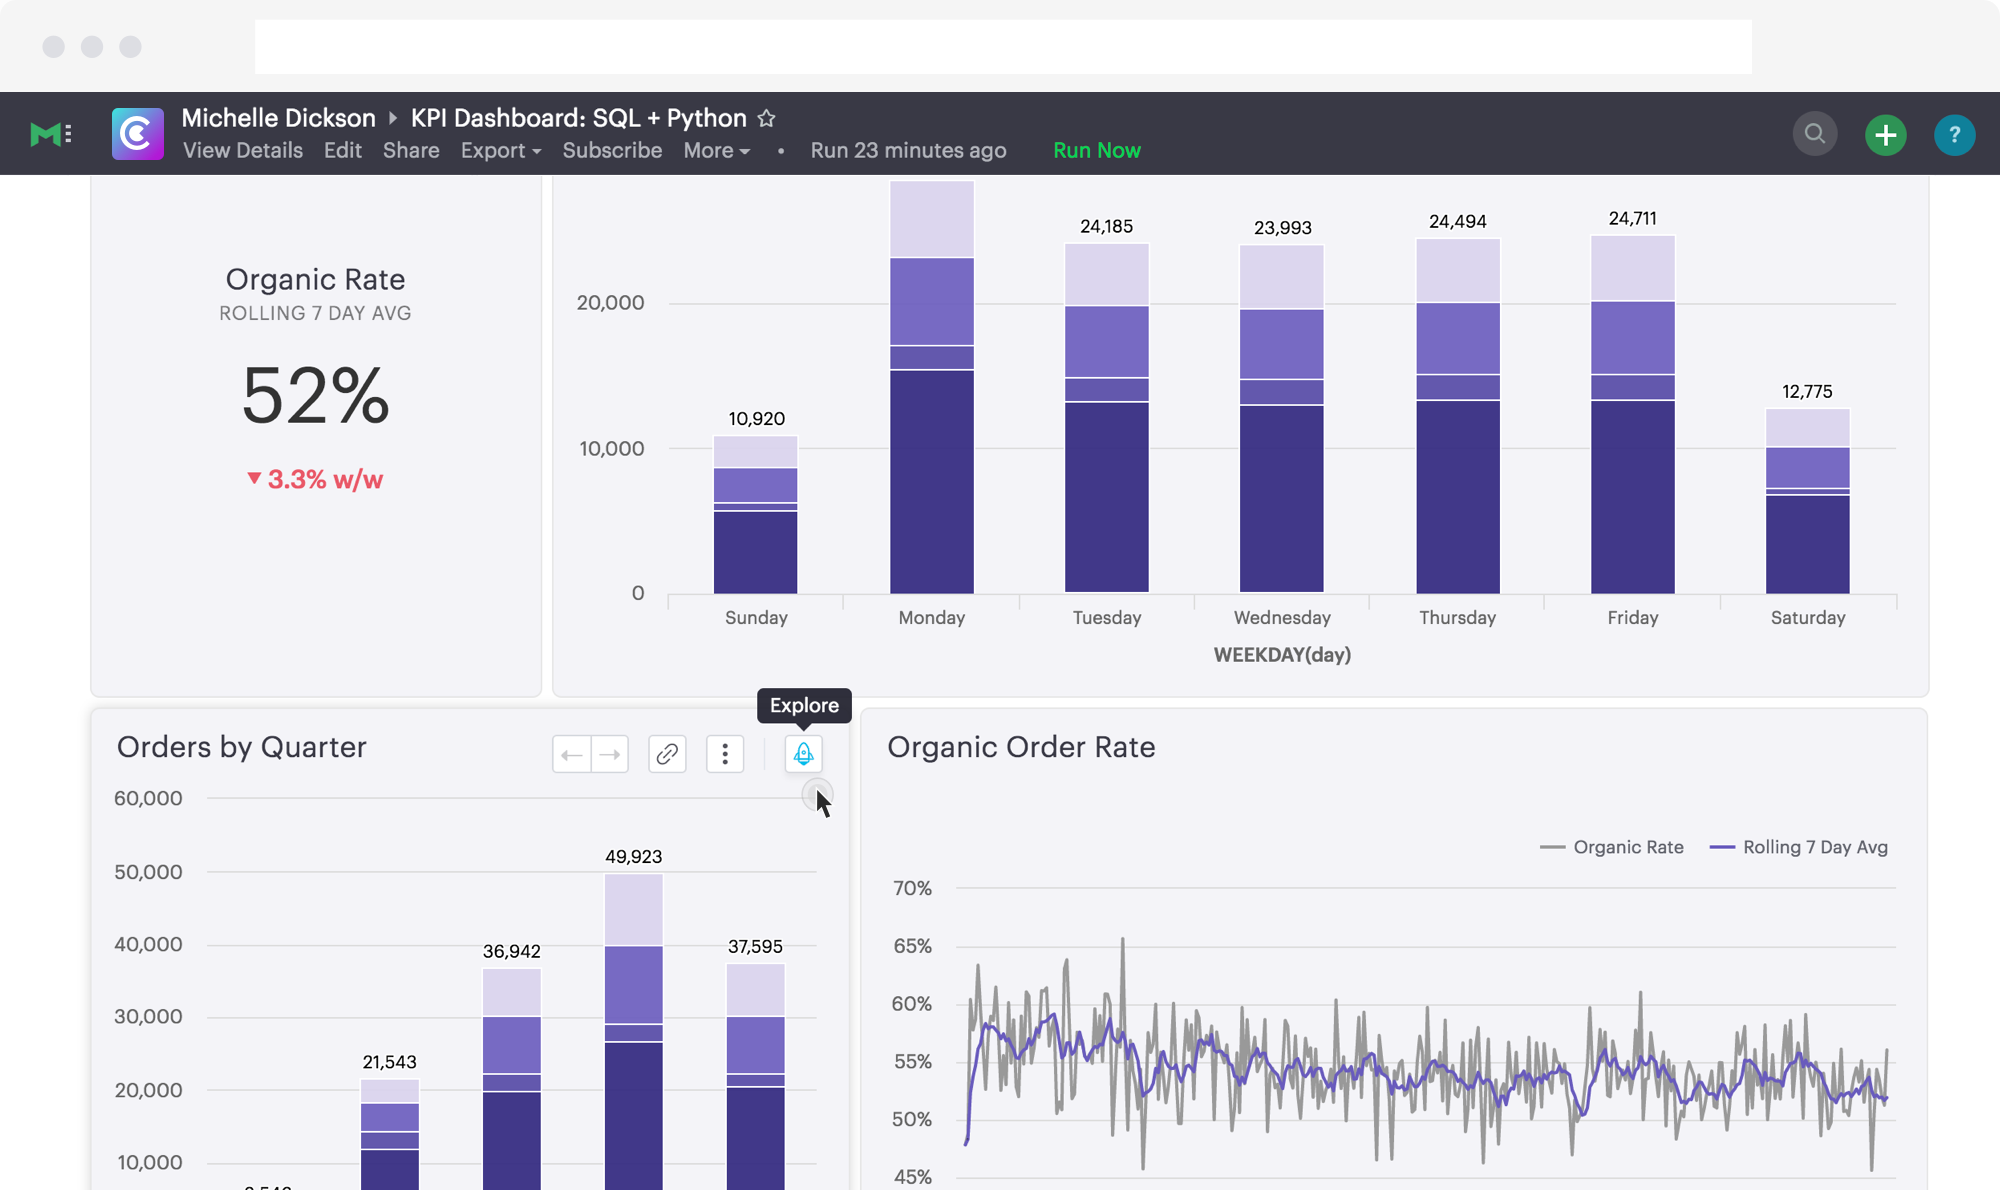
Mode Analytics
Explore comprehensive data insights and visualizations with the Mode Analytics dashboard, designed for efficient data-driven decision-making.

Oracle Analytics Cloud
Unlock insights with Oracle Analytics Cloud, offering real-time data visualization, predictive analytics, and collaborative features for informed decisions.
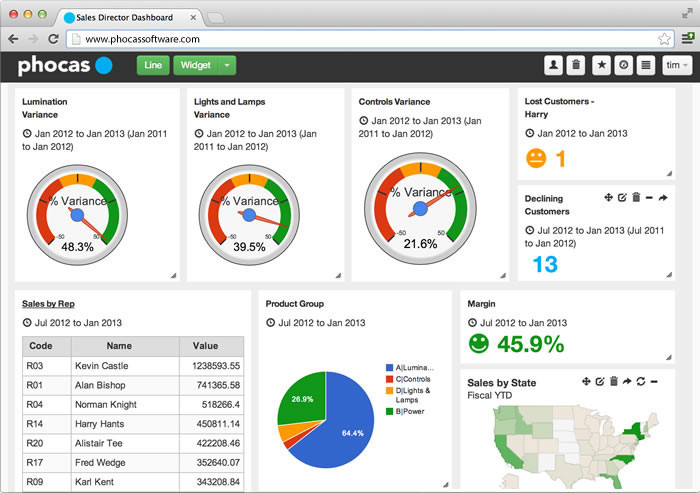
Phocas
Phocas dashboard offers intuitive data visualization and analysis tools, empowering businesses to make informed decisions with real-time insights.
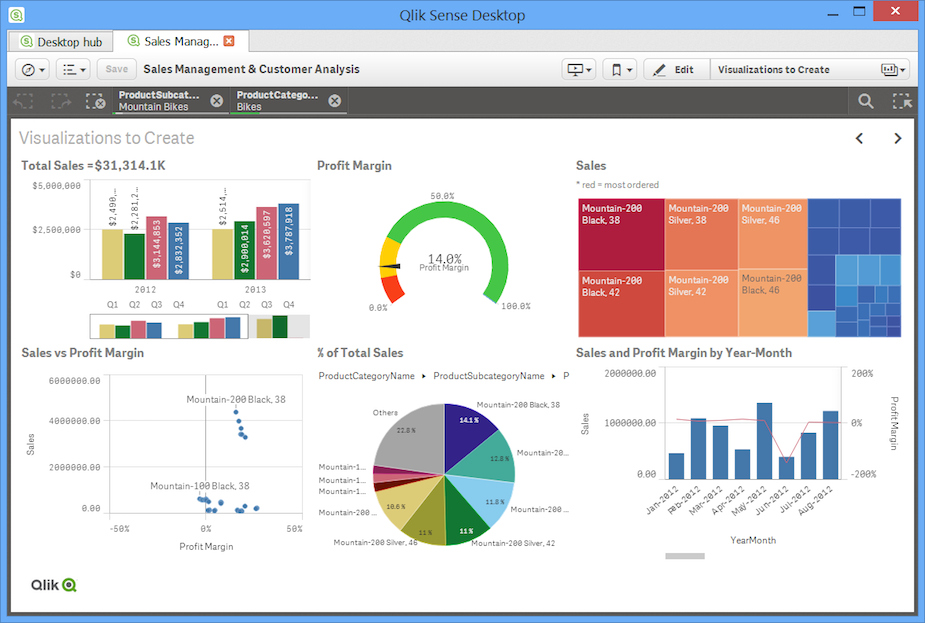
Qlik Sense
Visualize and analyze your data effortlessly with the Qlik Sense dashboard, offering interactive insights and real-time analytics for informed decision-making.

Redash
Gain insights and visualize data effortlessly with the Redash dashboard, designed for intuitive data exploration and seamless collaboration.

SAP Analytics Cloud
Gain real-time insights and make data-driven decisions with the SAP Analytics Cloud dashboard, designed for comprehensive business intelligence.

SAS Visual Analytics
Explore data insights with the SAS Visual Analytics dashboard, offering interactive visualizations and advanced analytics for informed decision-making.

Sigma Computing
Explore real-time data insights and analytics with Sigma Computing's intuitive dashboard, designed for seamless collaboration and decision-making.

Sisense
Unlock insights with Sisense's interactive dashboard, offering real-time data visualization and advanced analytics for informed decision-making.
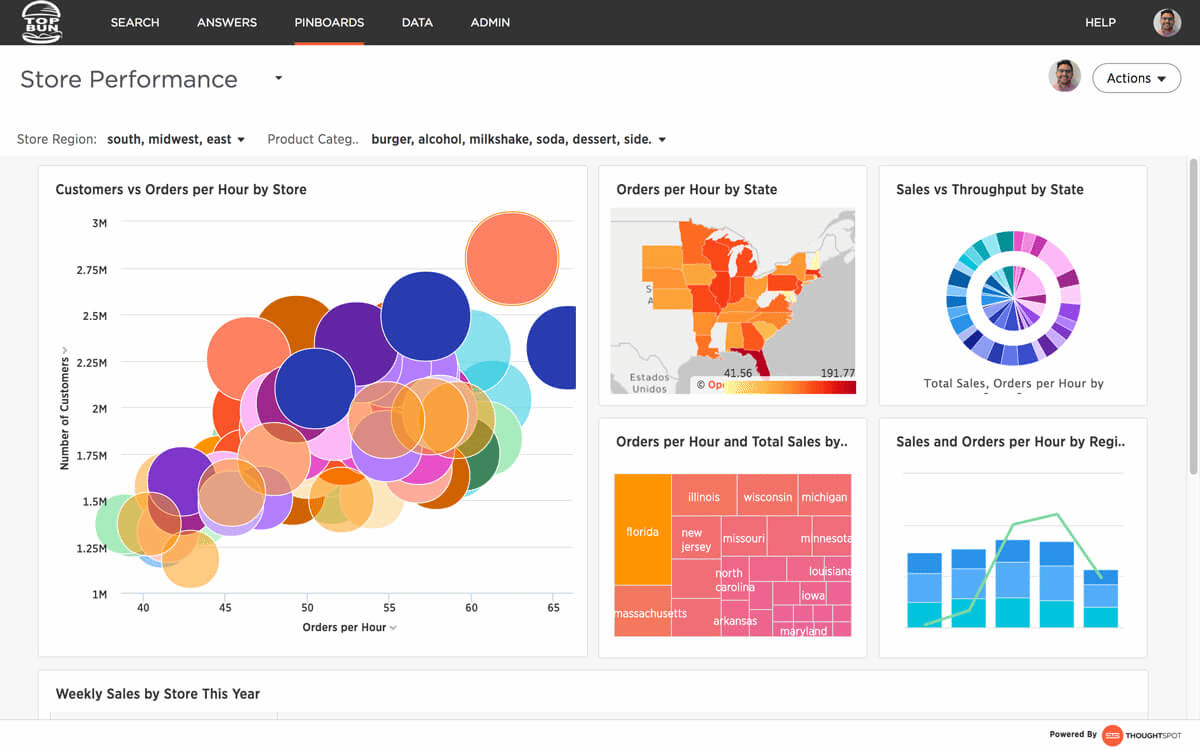
ThoughtSpot
Gain real-time insights and make data-driven decisions with the ThoughtSpot dashboard, featuring intuitive search and AI-driven analytics.

TIBCO Spotfire
This TIBCO Spotfire dashboard provides real-time data visualization and analytics to enhance decision-making and operational efficiency.

Yellowfin BI
Experience data-driven insights with Yellowfin BI's interactive dashboard, designed for real-time analytics and enhanced decision-making efficiency.
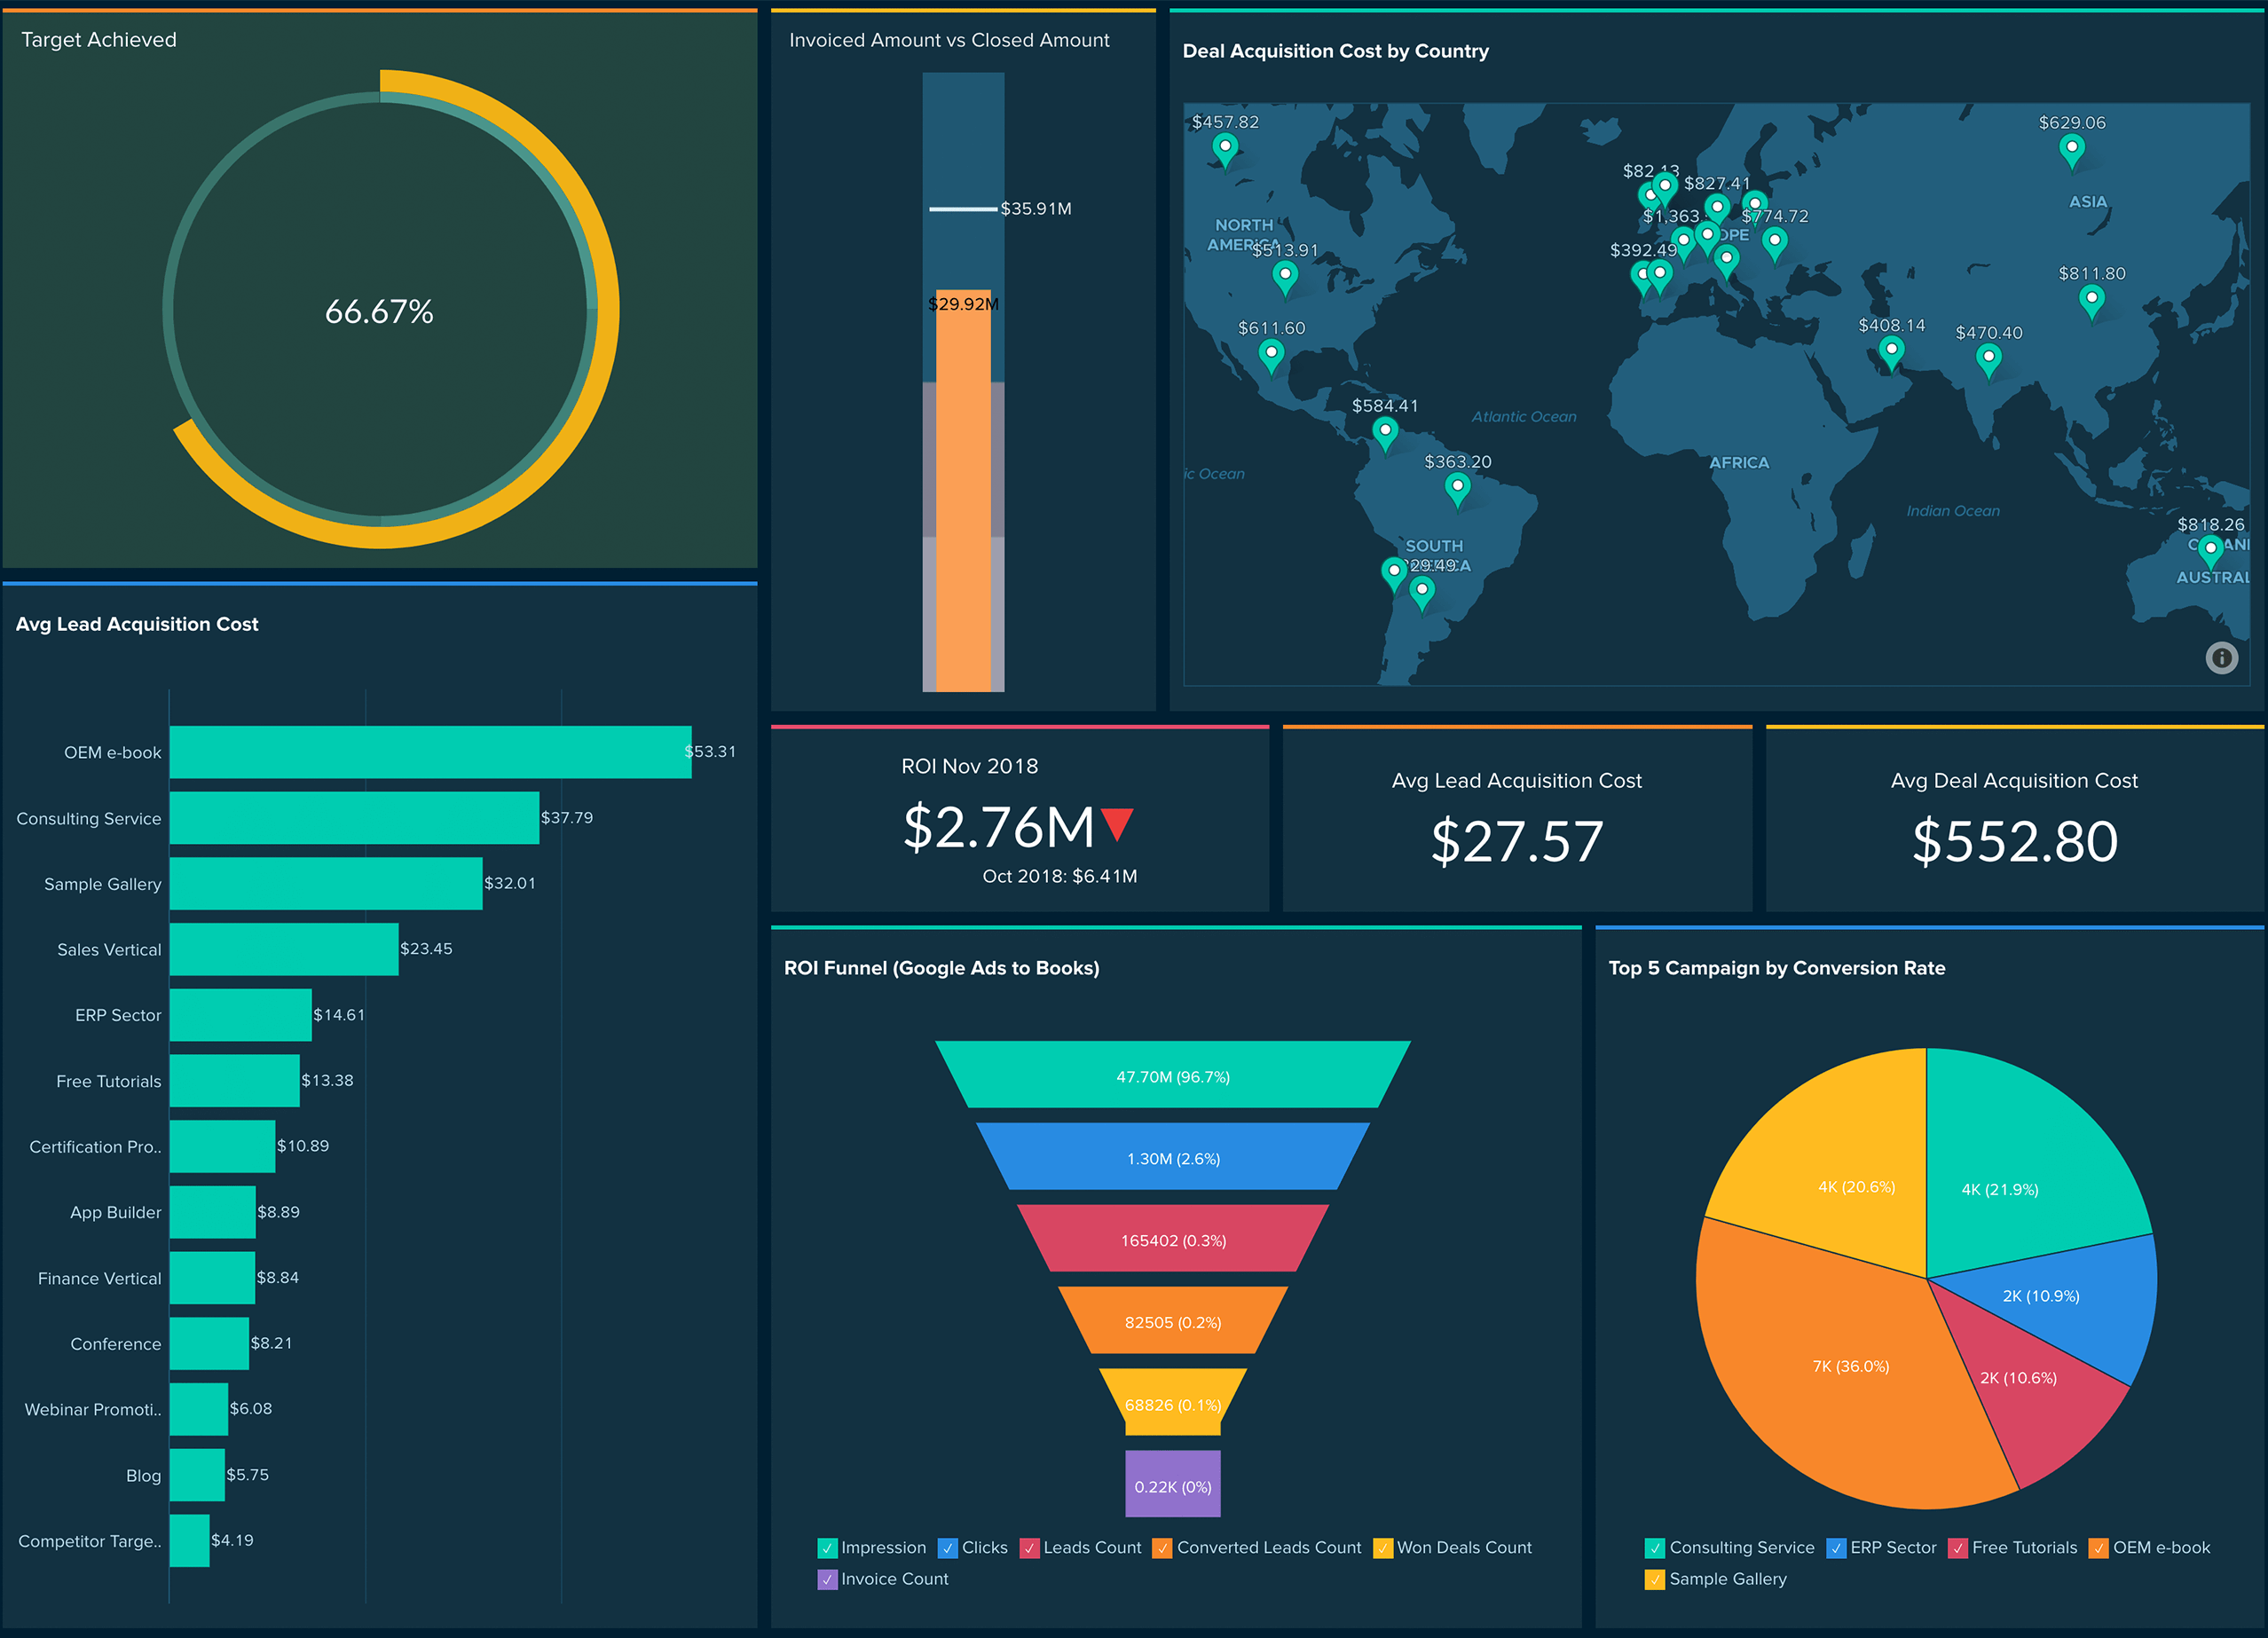
Zoho Analytics
Gain actionable insights with Zoho Analytics, a comprehensive dashboard offering real-time data visualization and customizable reports for informed decisions.
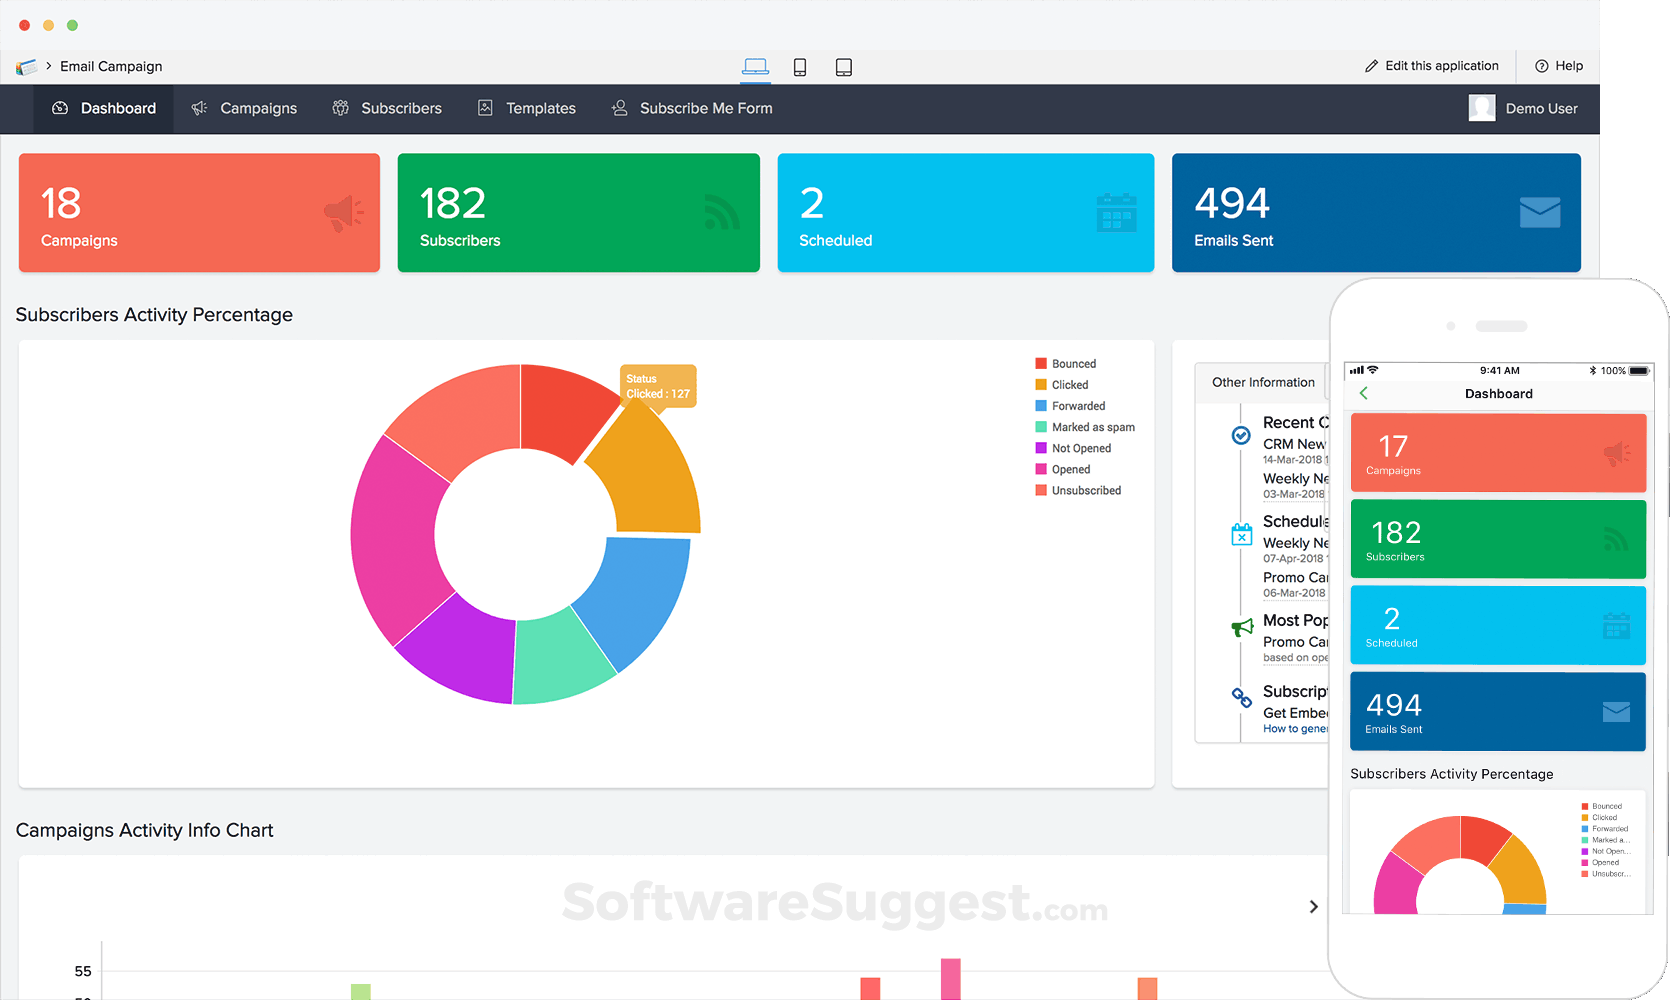
Zoho Creator
Zoho Creator dashboard offers a comprehensive view of your custom applications, providing real-time insights and analytics to enhance decision-making.

Alteryx
Unlock the power of data analytics with the Alteryx dashboard, offering seamless integration, visualization, and insights for data-driven decisions.

Anodot
Monitor and analyze business metrics in real-time with Anodot's AI-driven insights, ensuring proactive anomaly detection and efficient decision-making.

Panoply
Panoply's dashboard offers seamless data integration and visualization, empowering users to analyze and derive insights effortlessly from their datasets.

AWS QuickSight
Gain insights into your business data with AWS QuickSight, offering interactive visualizations and real-time analytics for informed decision-making.

Azure Synapse
Monitor and optimize your data integration, analytics, and storage performance with the Azure Synapse dashboard, providing real-time insights.

BigQuery
Gain insights with our BigQuery dashboard, offering real-time data analysis, visualization, and reporting for informed decision-making.
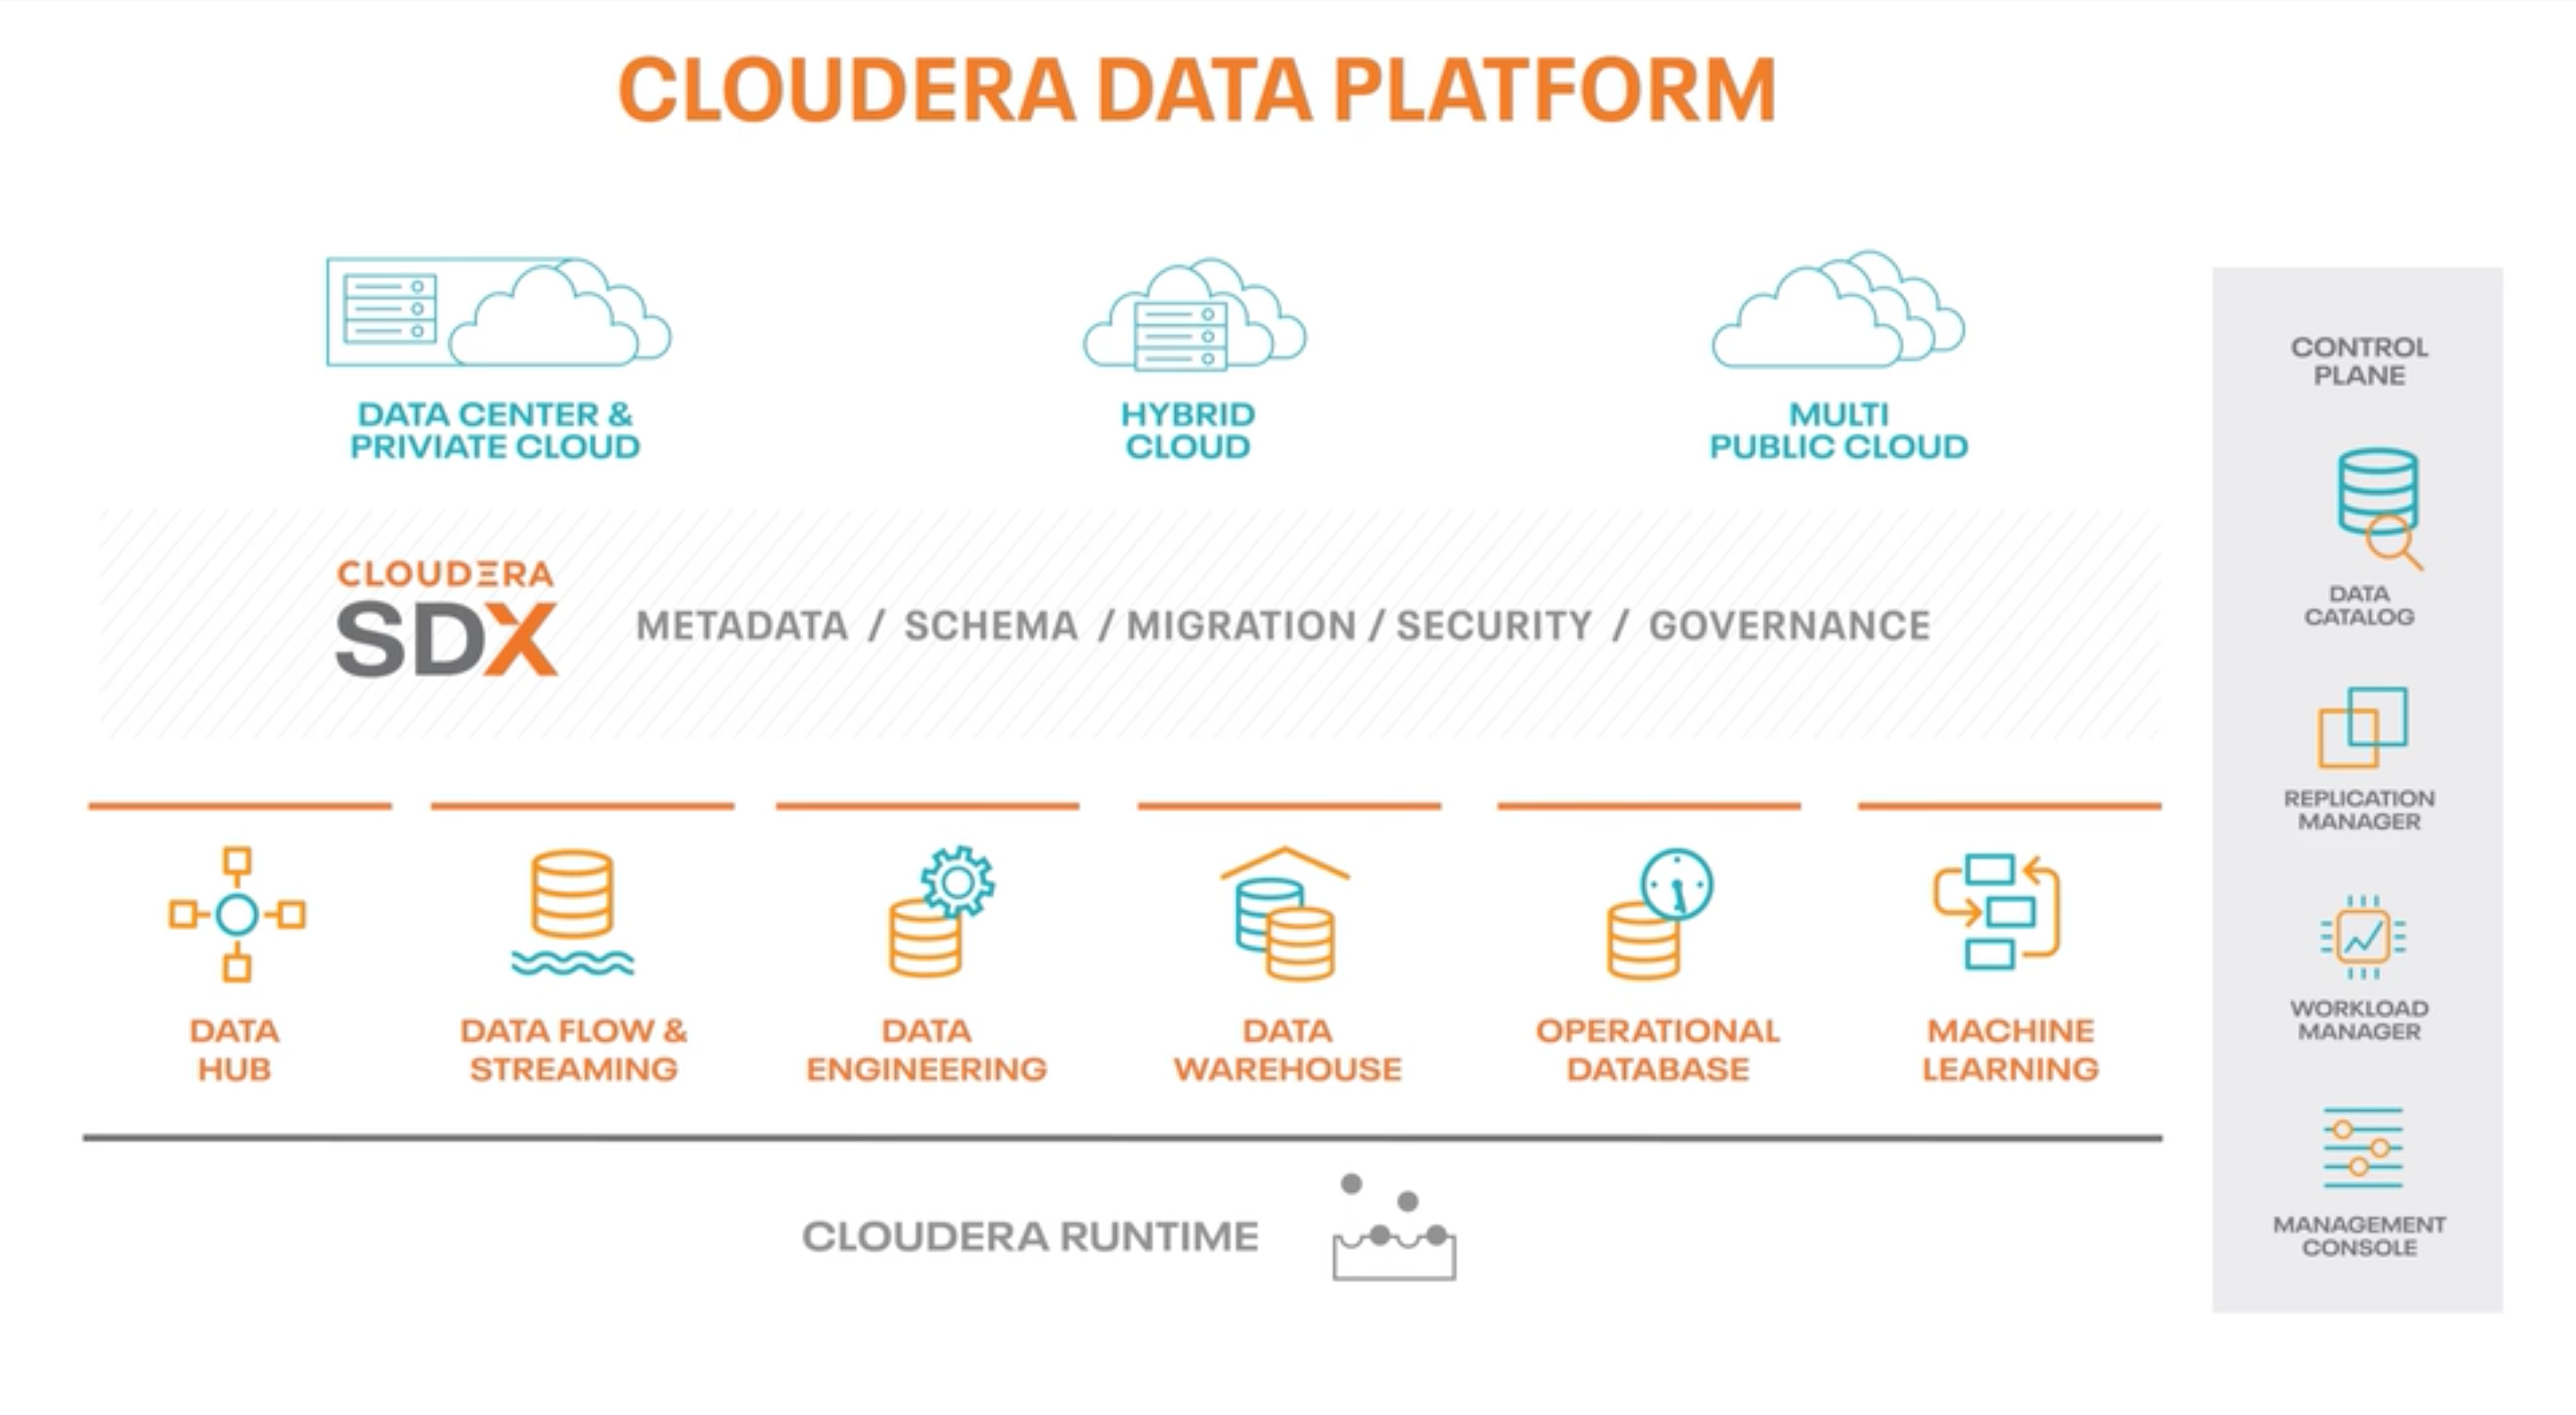
Cloudera Data Platform
Monitor, manage, and optimize your data operations seamlessly with the Cloudera Data Platform dashboard, designed for comprehensive data insights.

IBM Watson Analytics
Explore data insights with IBM Watson Analytics, offering intuitive visualizations and predictive analytics for smarter decision-making.

Redshift
Explore and analyze your data efficiently with the Redshift dashboard, offering real-time insights and advanced visualization tools for data-driven decisions.

Snowflake
Explore comprehensive data insights with the Snowflake dashboard, offering real-time analytics, customizable reports, and seamless data integration.
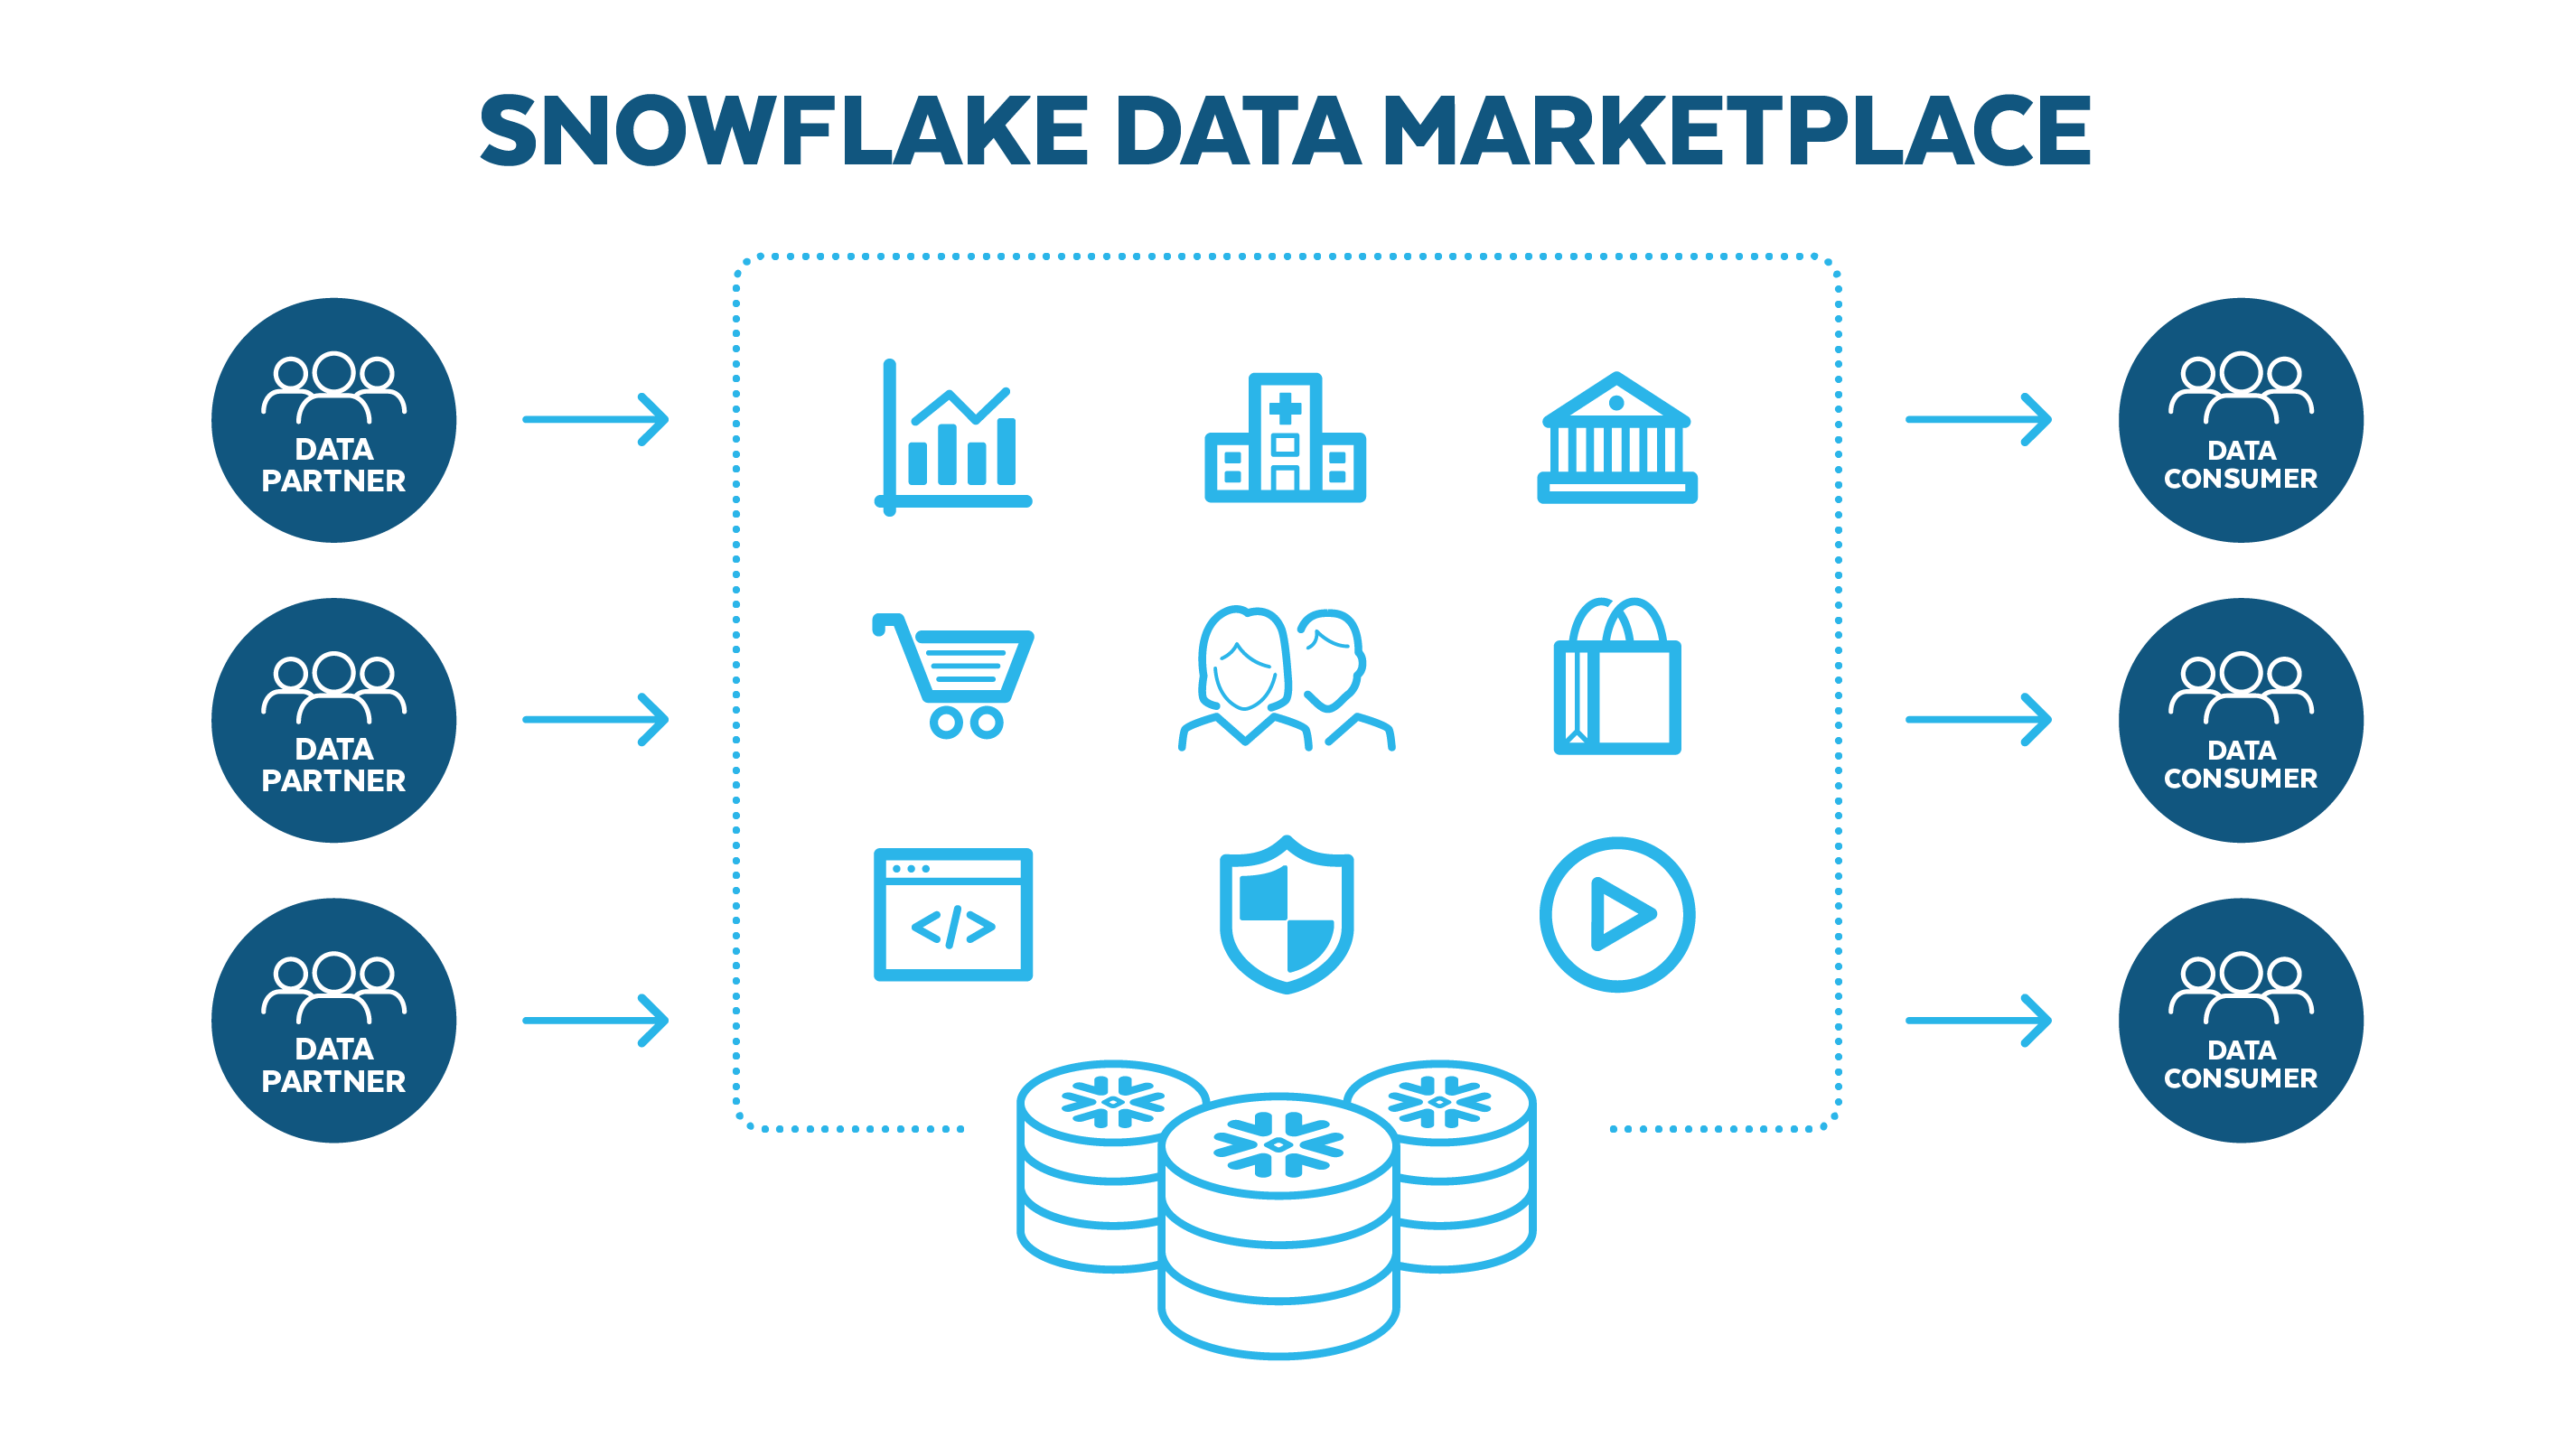
Snowflake Data Marketplace
Explore, access, and analyze a wide range of datasets seamlessly with the Snowflake Data Marketplace dashboard, enhancing data-driven decision-making.
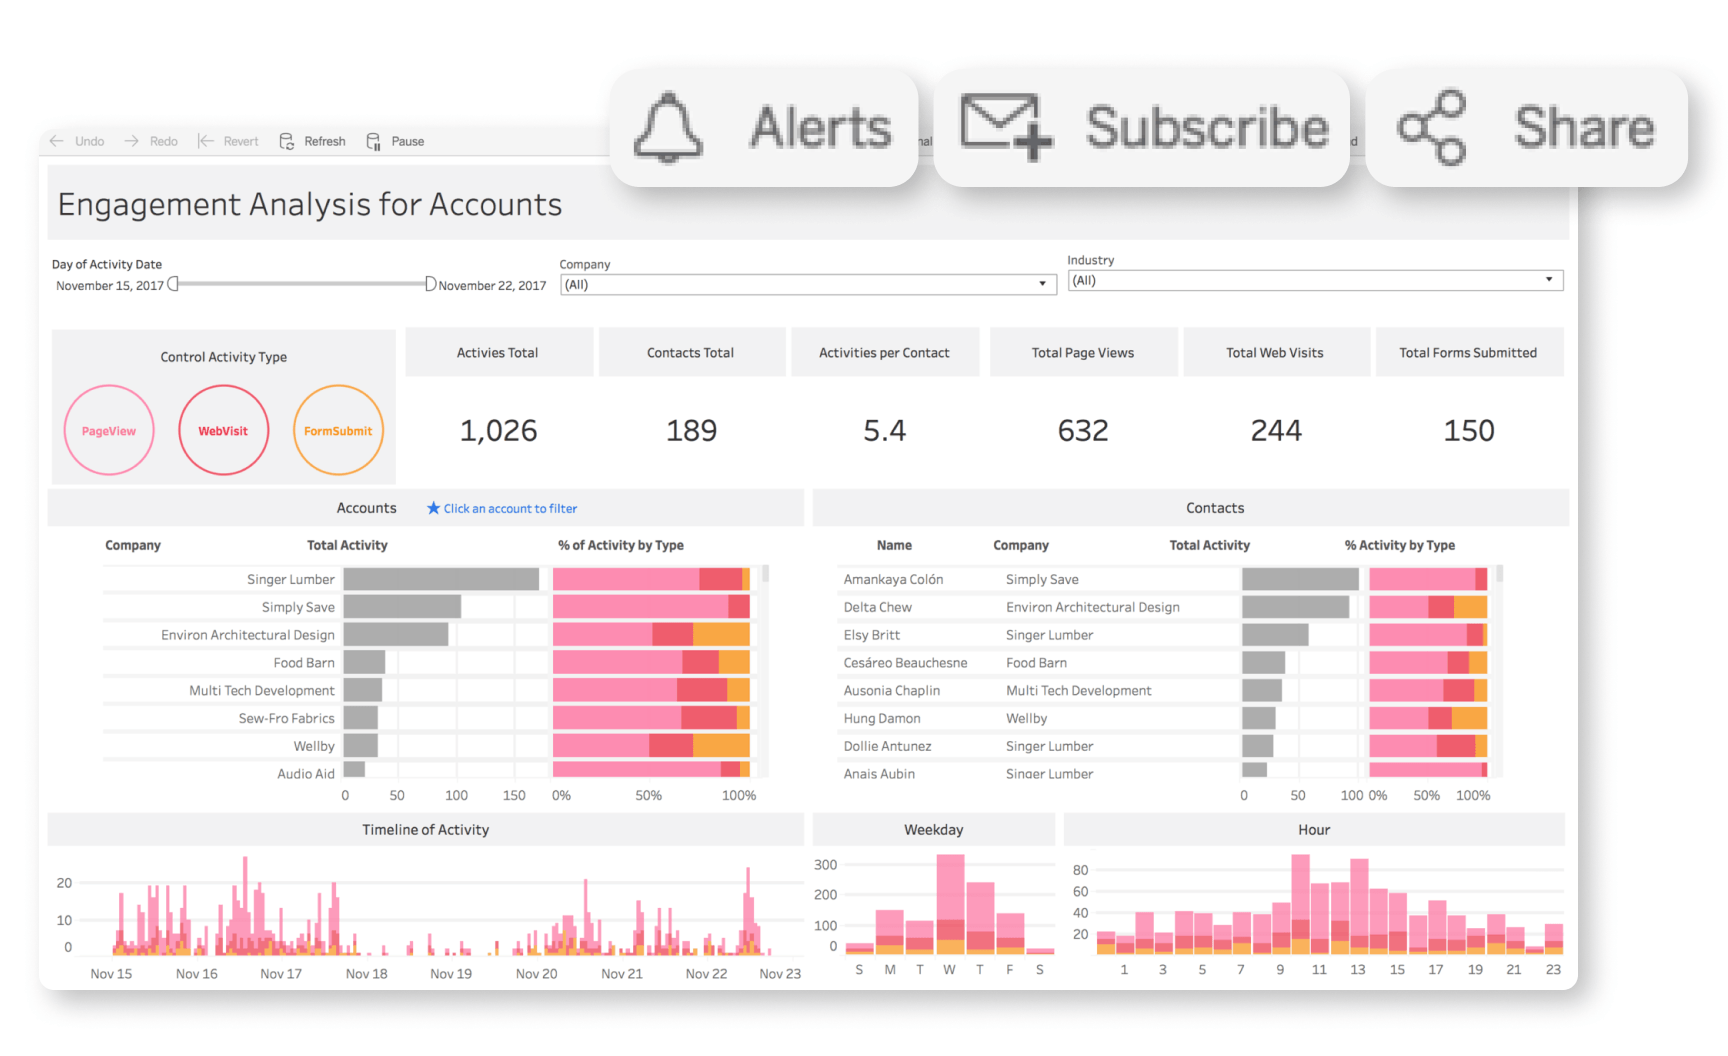
Tableau Cloud
Visualize and analyze your data seamlessly with Tableau Cloud, offering real-time insights and interactive dashboards for informed decision-making.
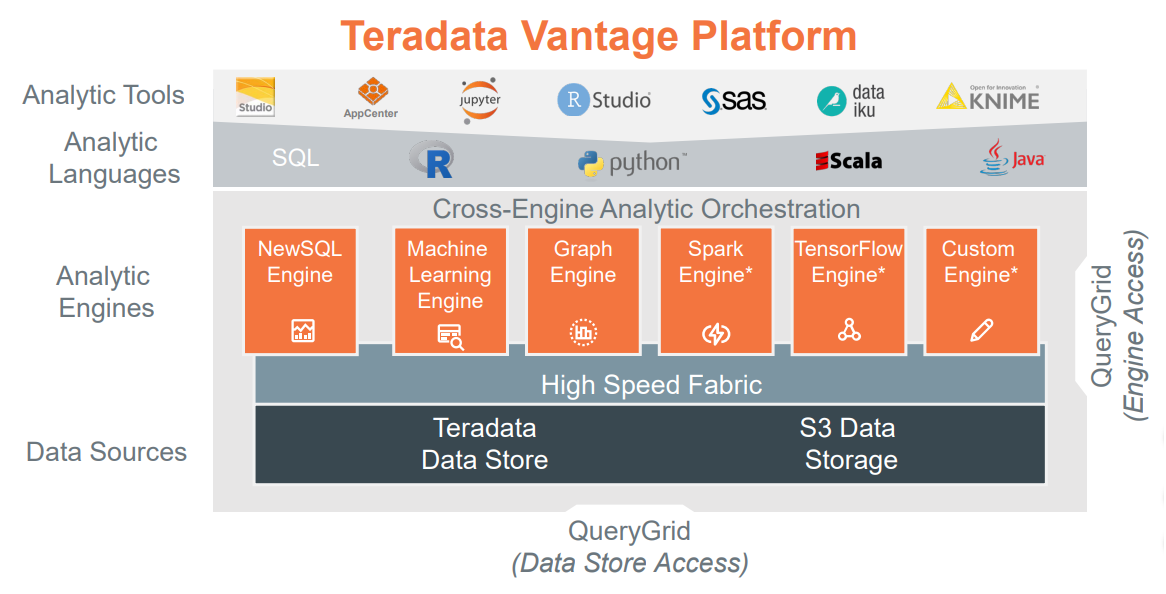
Teradata Vantage
Experience seamless data analytics and insights with the Teradata Vantage dashboard, designed for optimal performance and user-friendly navigation.
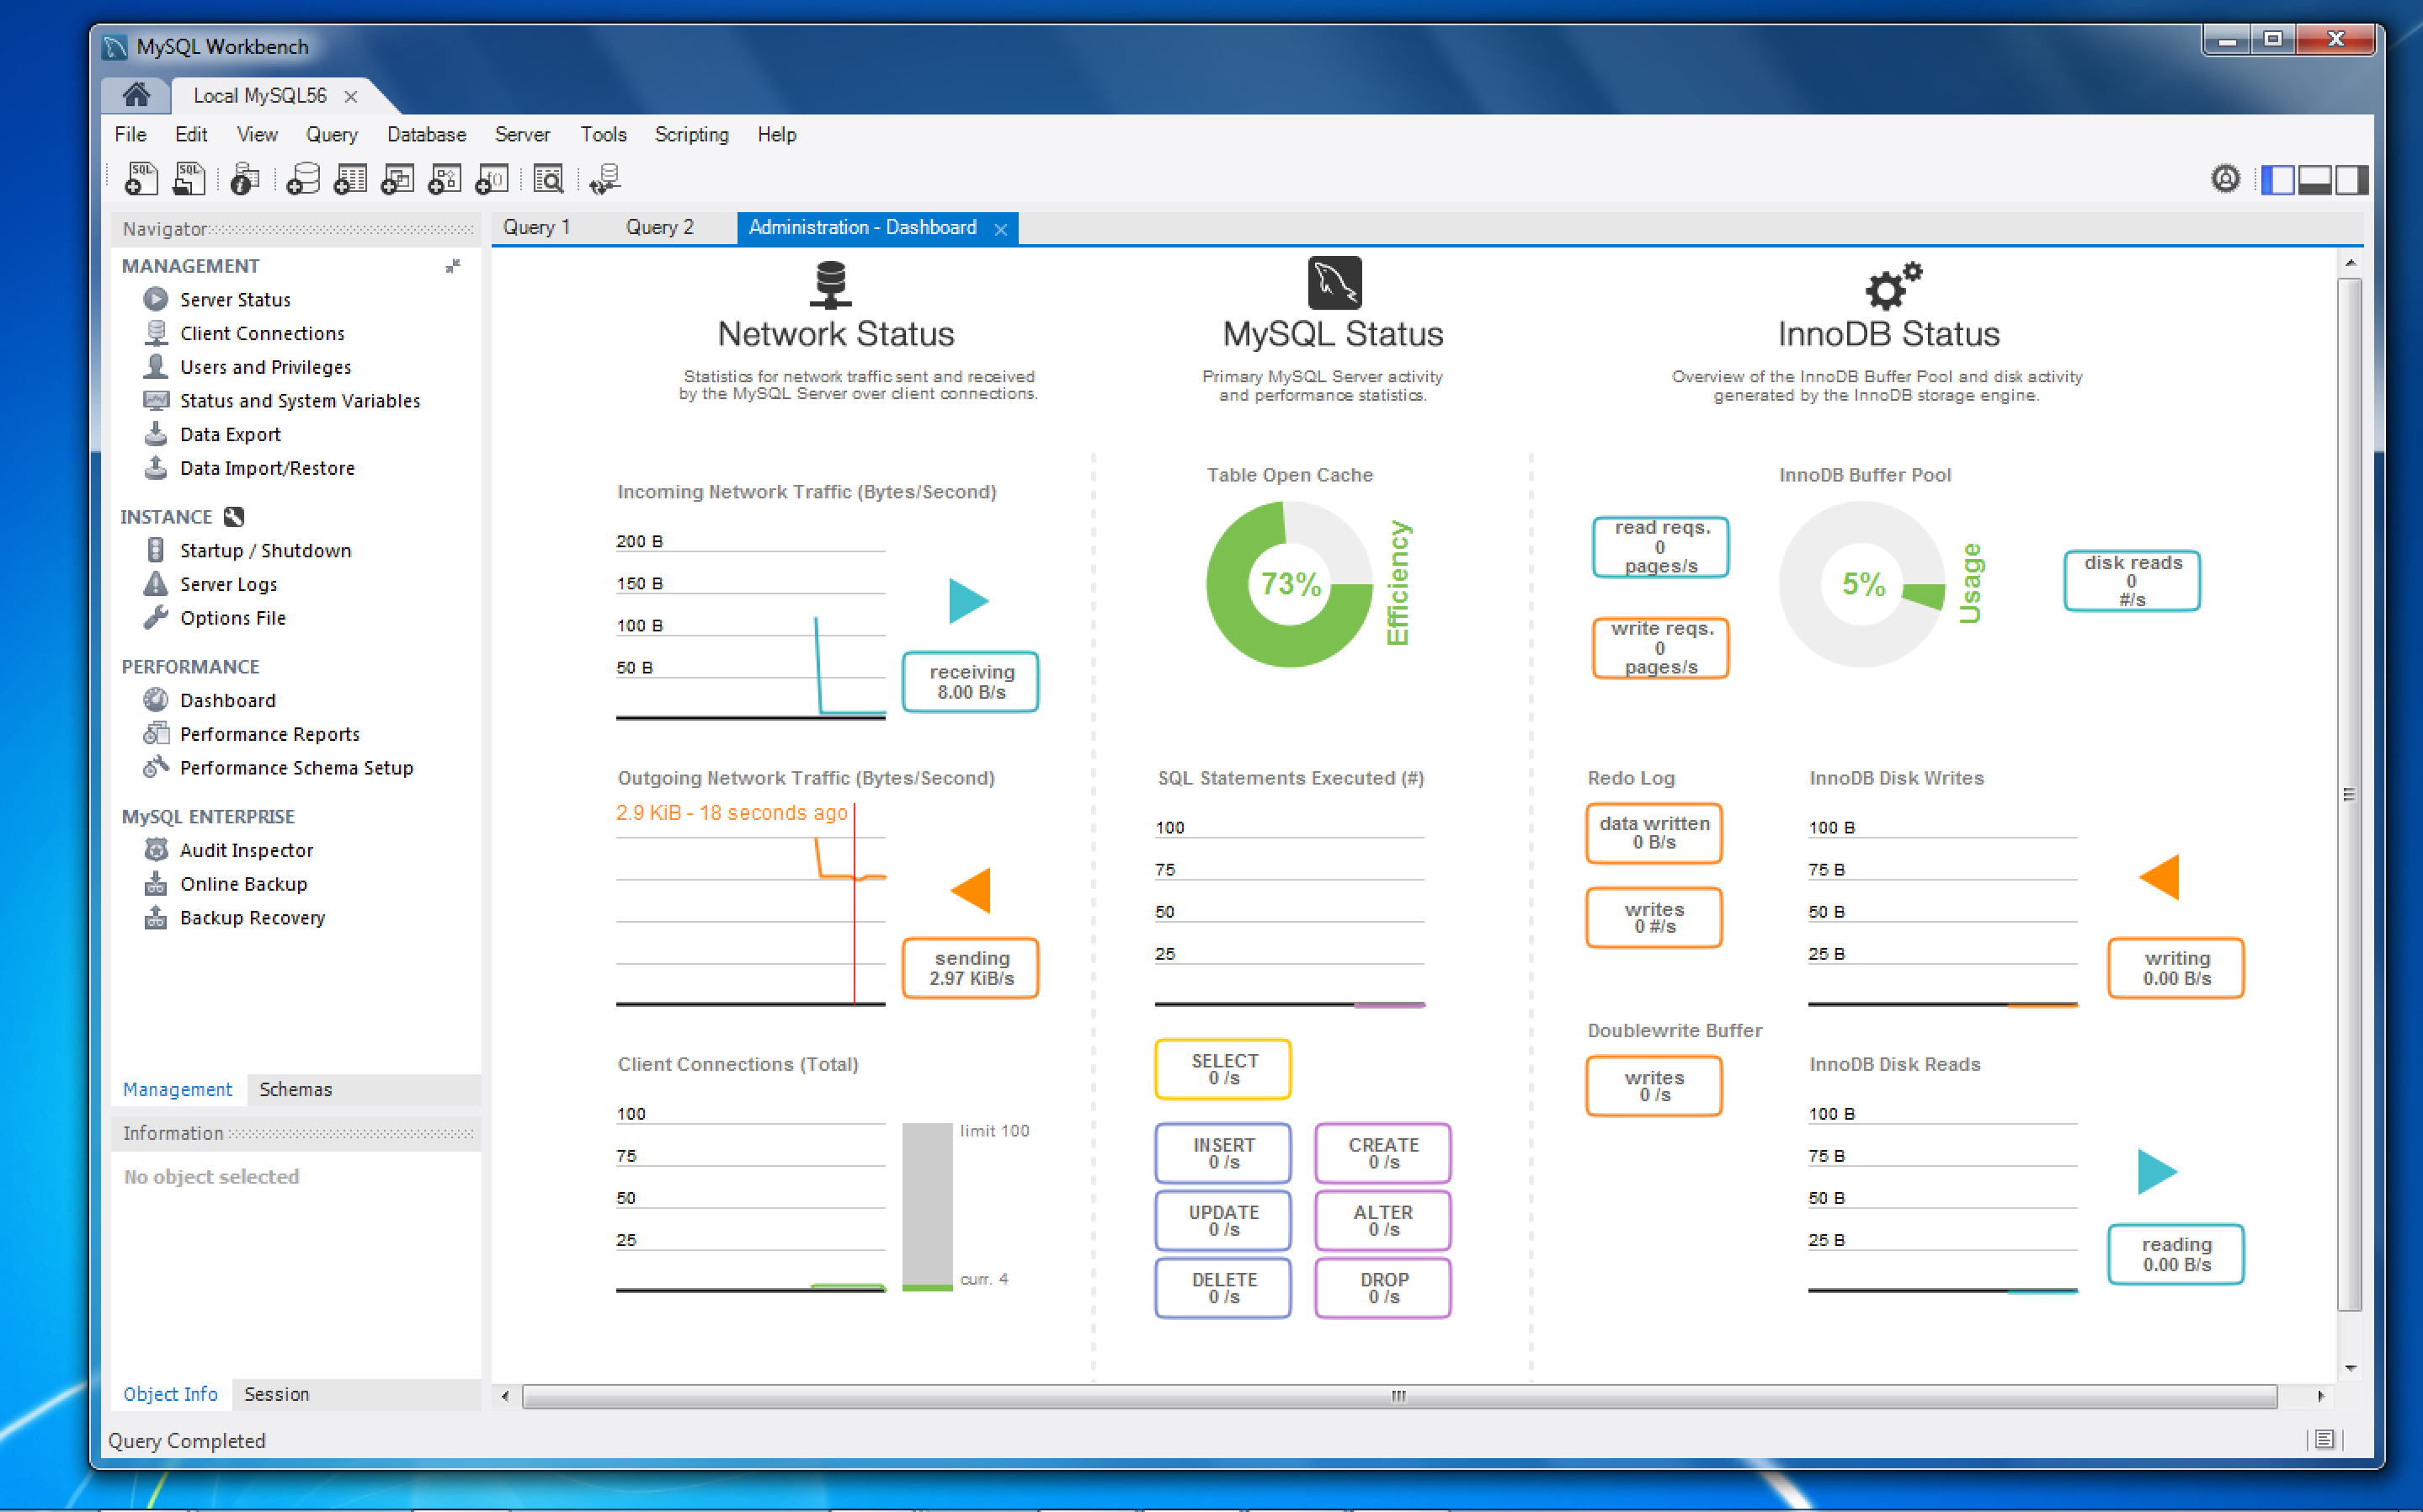
MySQL Workbench
Visualize, design, and manage your databases efficiently with the MySQL Workbench dashboard, offering intuitive tools for database architects and developers.
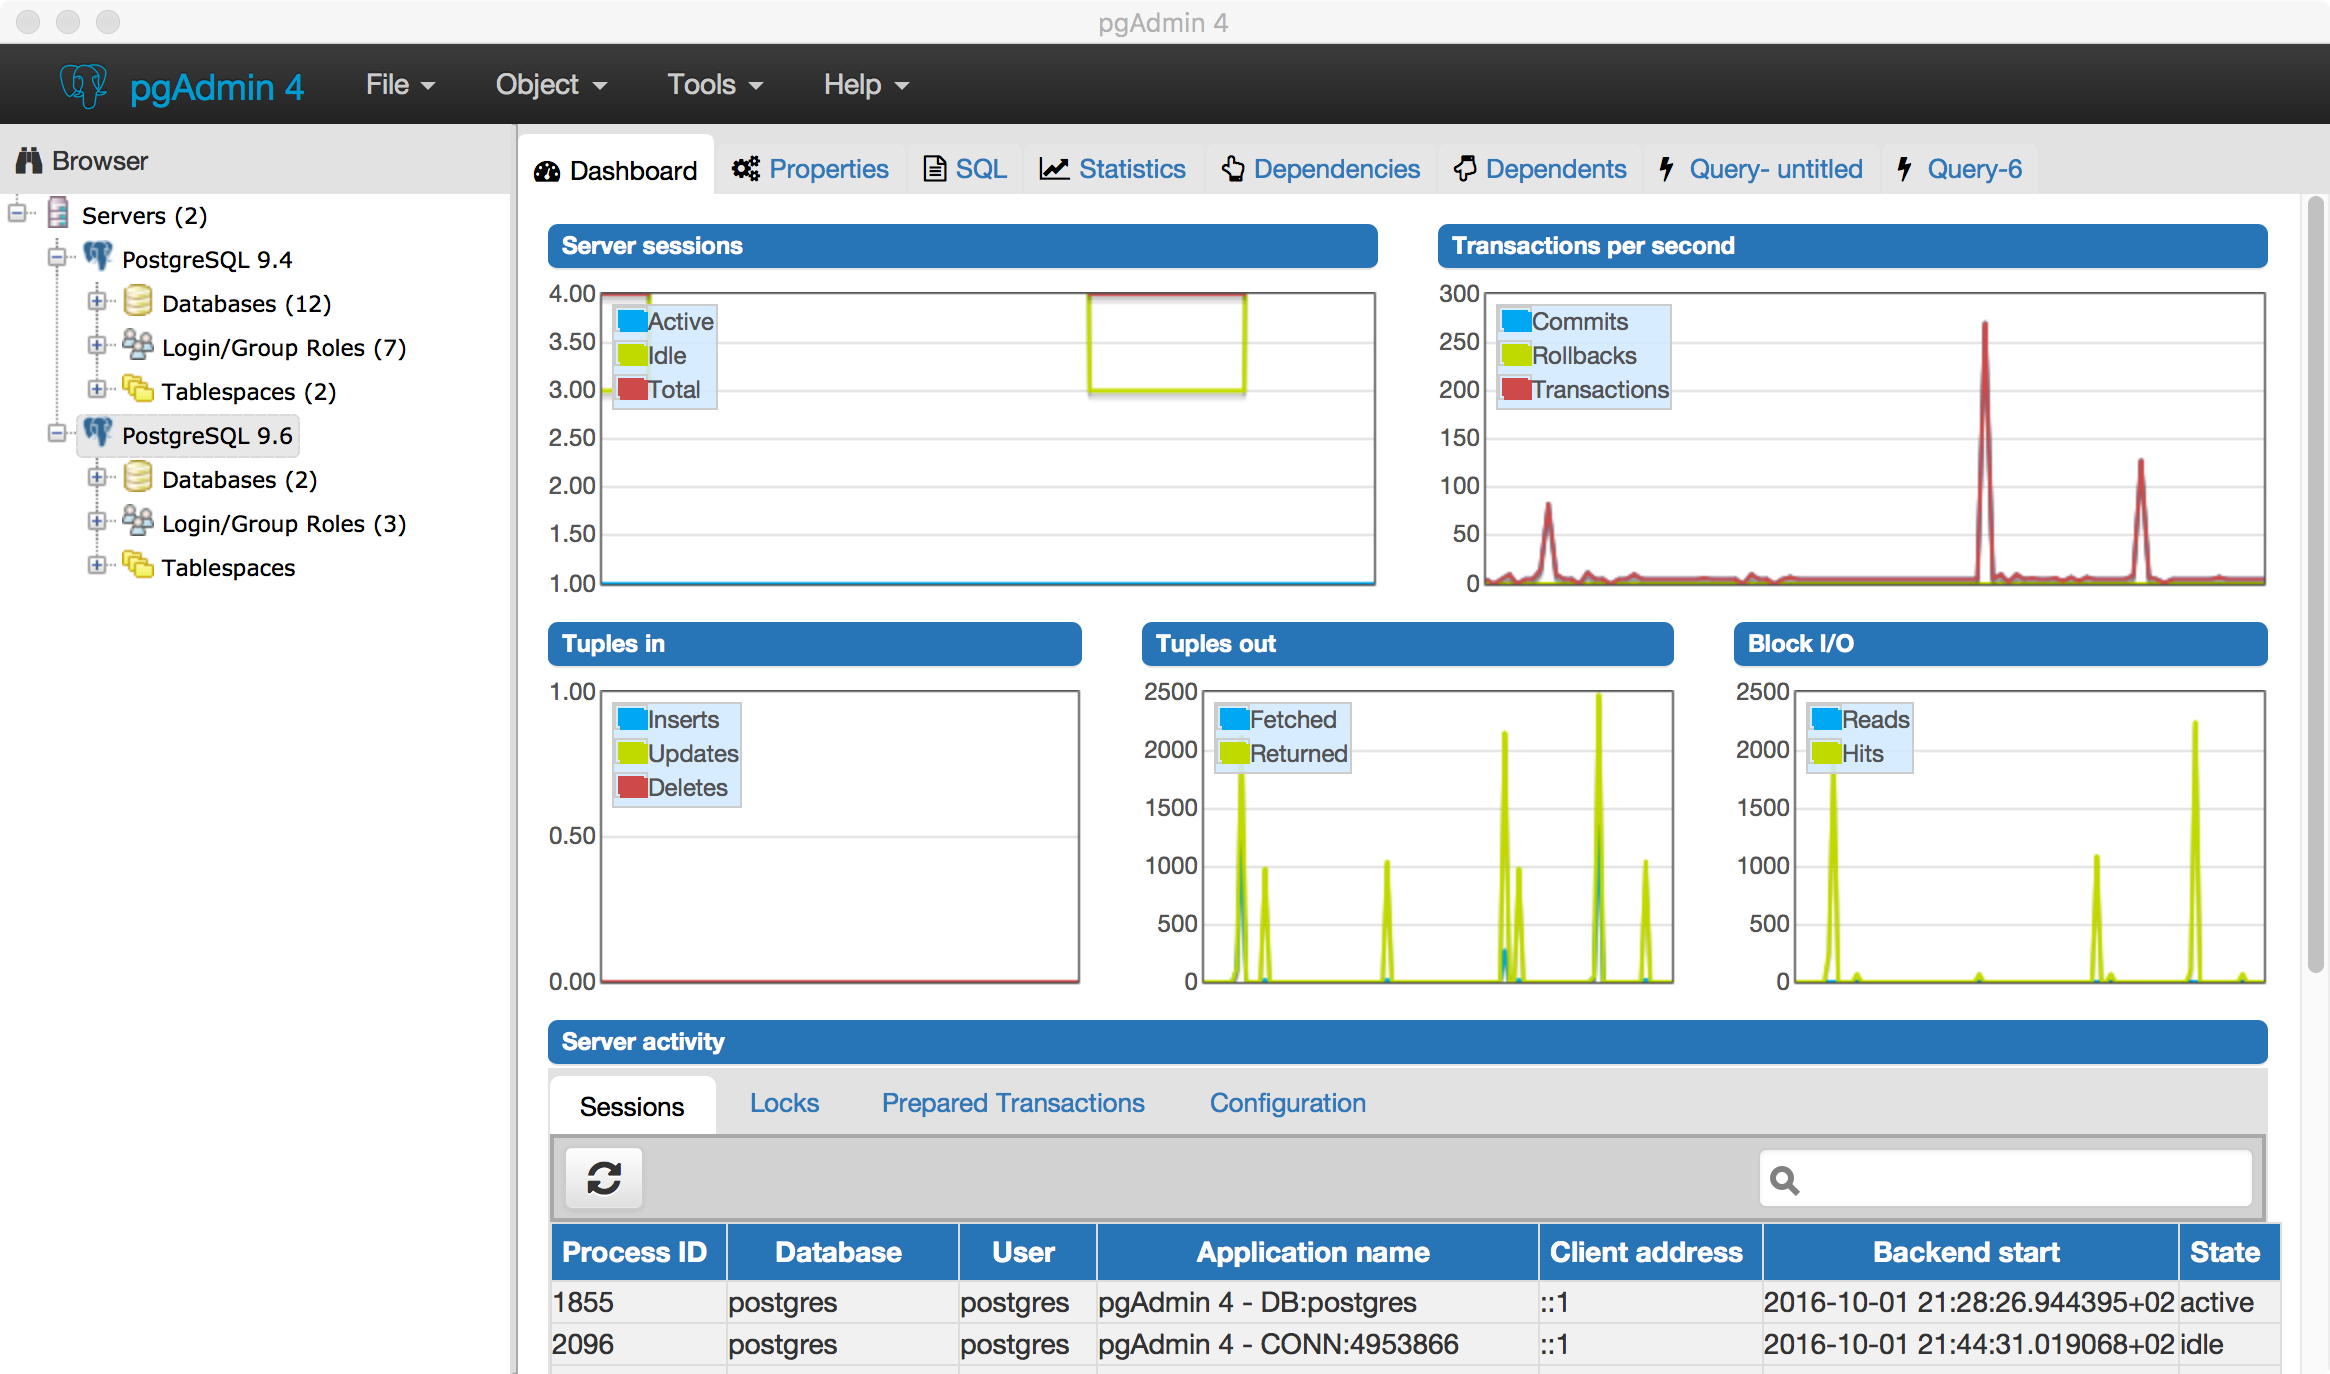
PostgreSQL pgAdmin
Effortlessly manage and monitor PostgreSQL databases with the pgAdmin dashboard, offering intuitive insights and robust tools for database administration.

Agile CRM
Streamline your sales, marketing, and customer service processes with Agile CRM's intuitive dashboard, designed for efficiency and collaboration.
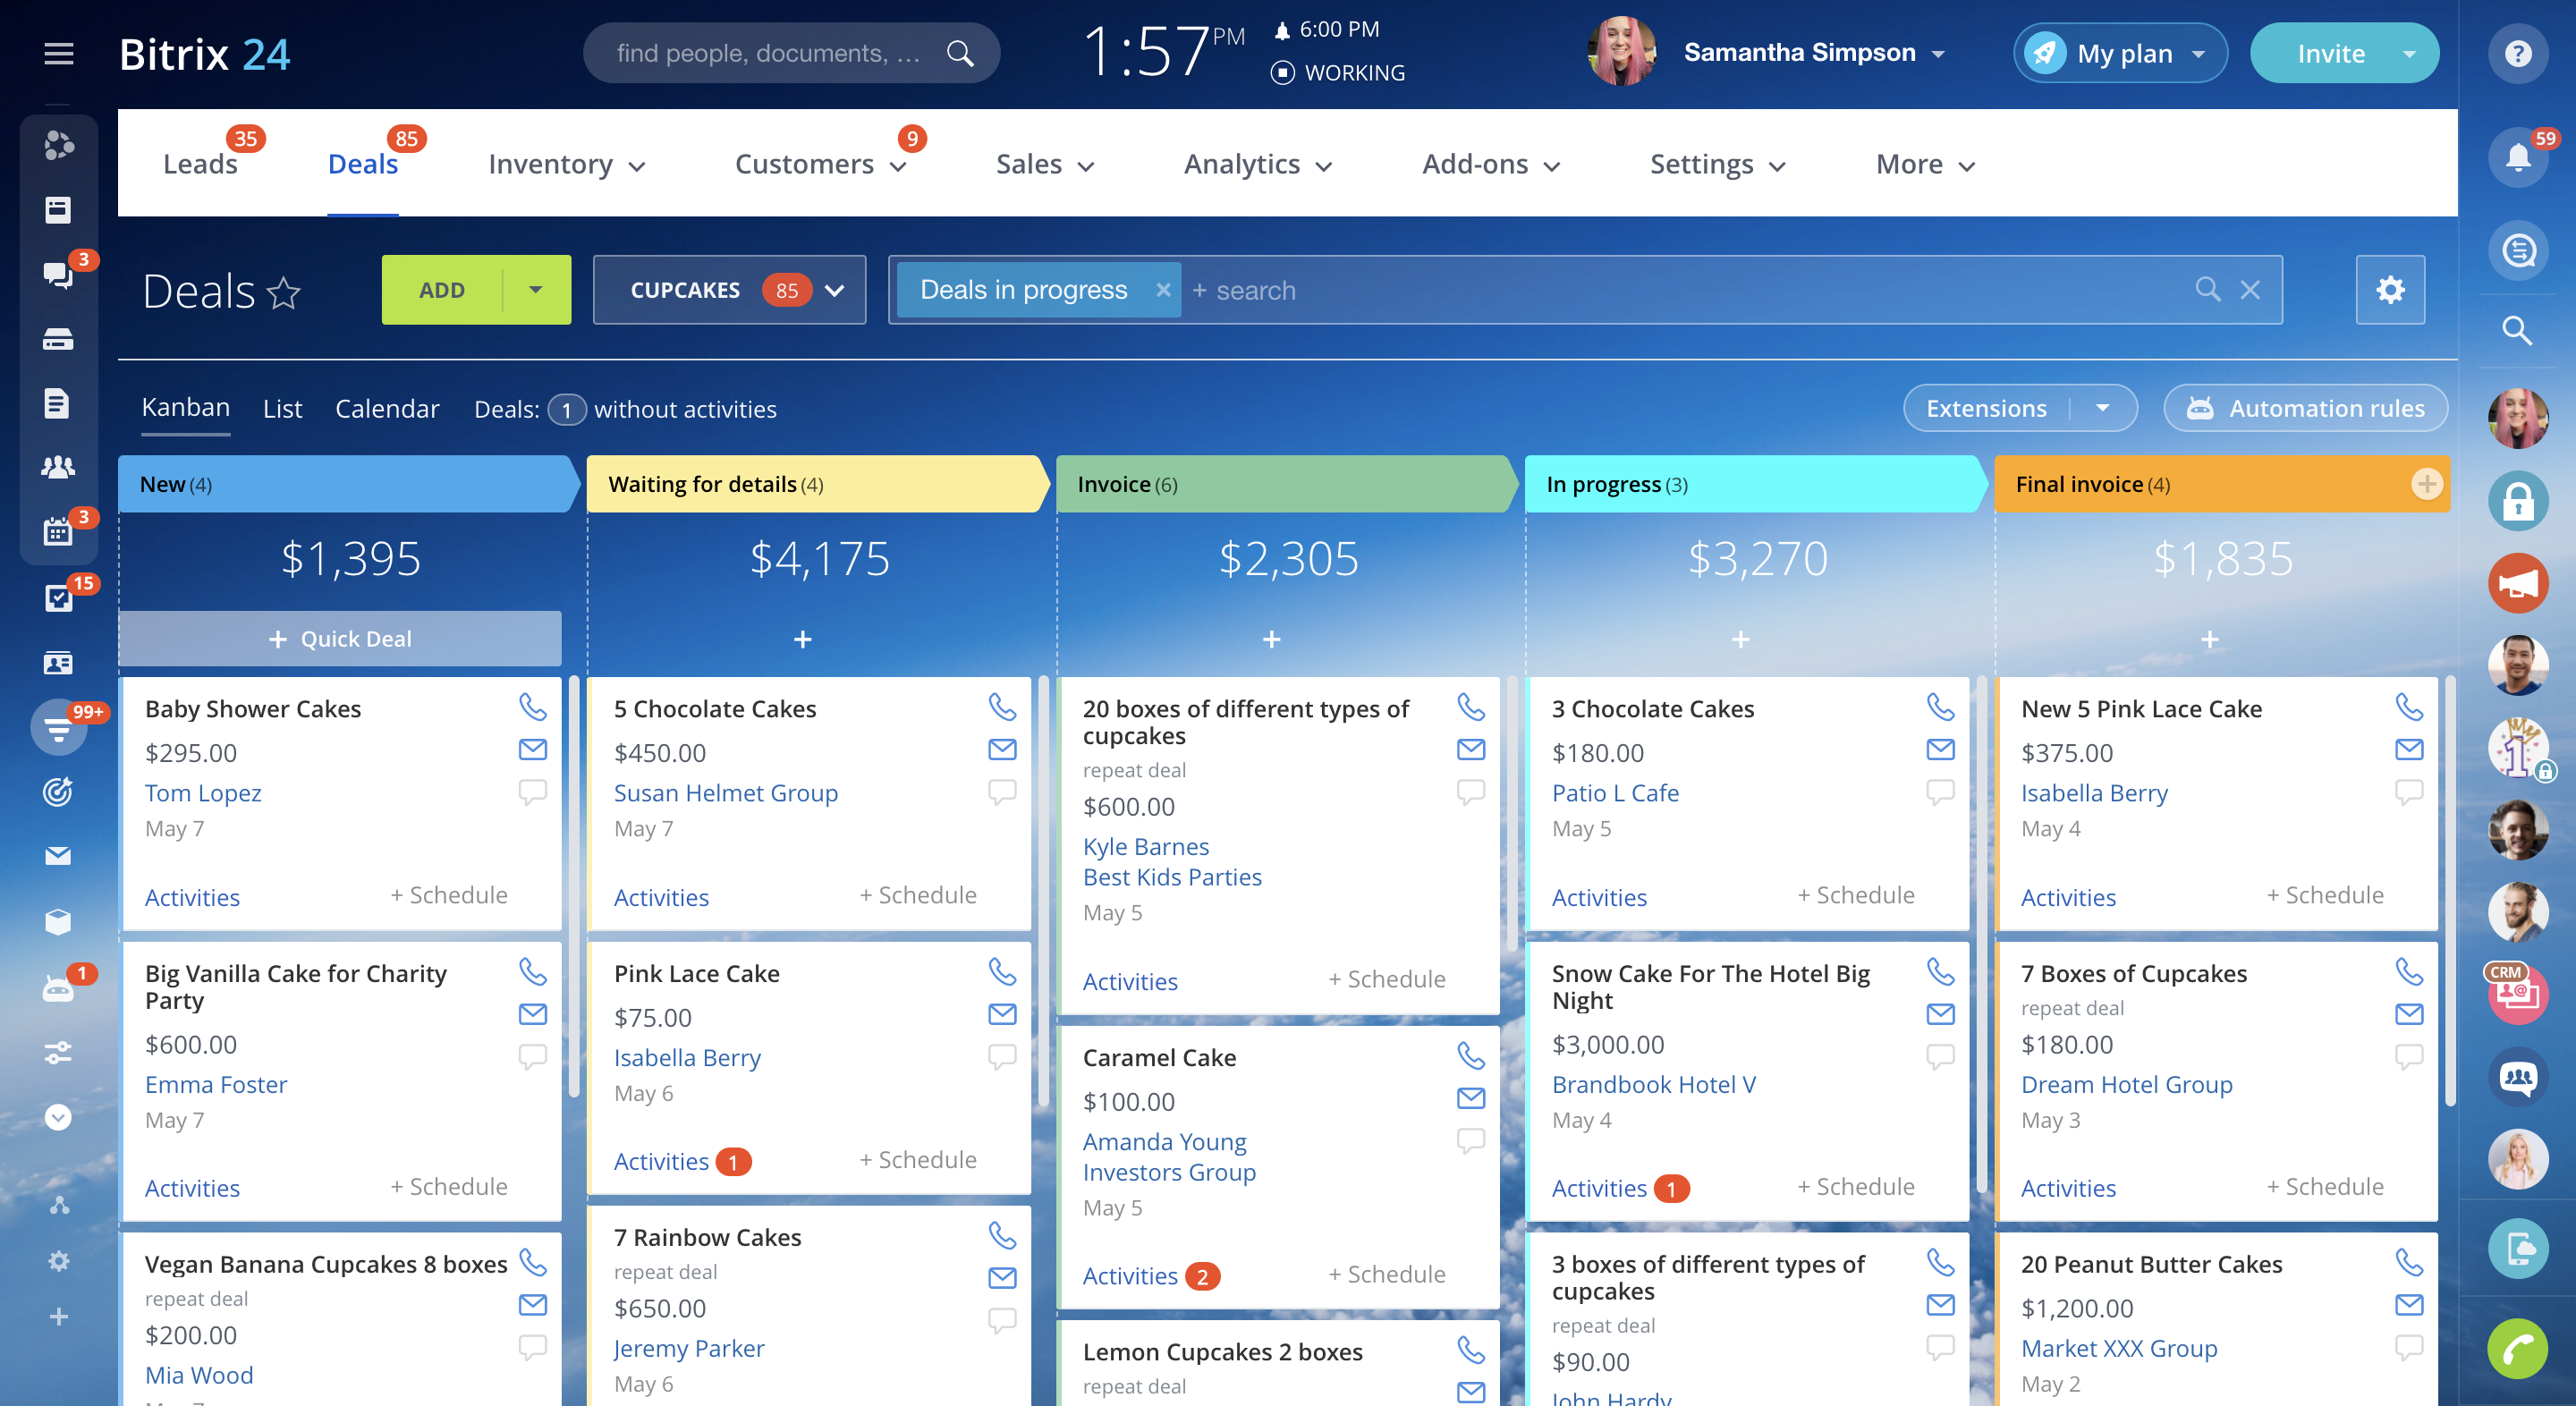
Bitrix24
The Bitrix24 dashboard offers a comprehensive view of team activities, project progress, and communication tools, enhancing collaboration and productivity.

Capsule CRM
Capsule CRM dashboard offers a streamlined view of your sales pipeline, customer interactions, and task management to enhance productivity and insights.

Copper
Explore comprehensive insights into copper market trends, pricing, and production with our user-friendly Copper dashboard, designed for industry professionals.

Freshdesk
Monitor and manage customer support activities efficiently with Freshdesk's intuitive dashboard, offering real-time insights and performance metrics.

Freshworks Analytics
Gain insights into customer interactions, sales, and support with Freshworks Analytics. Visualize data trends to drive informed business decisions.
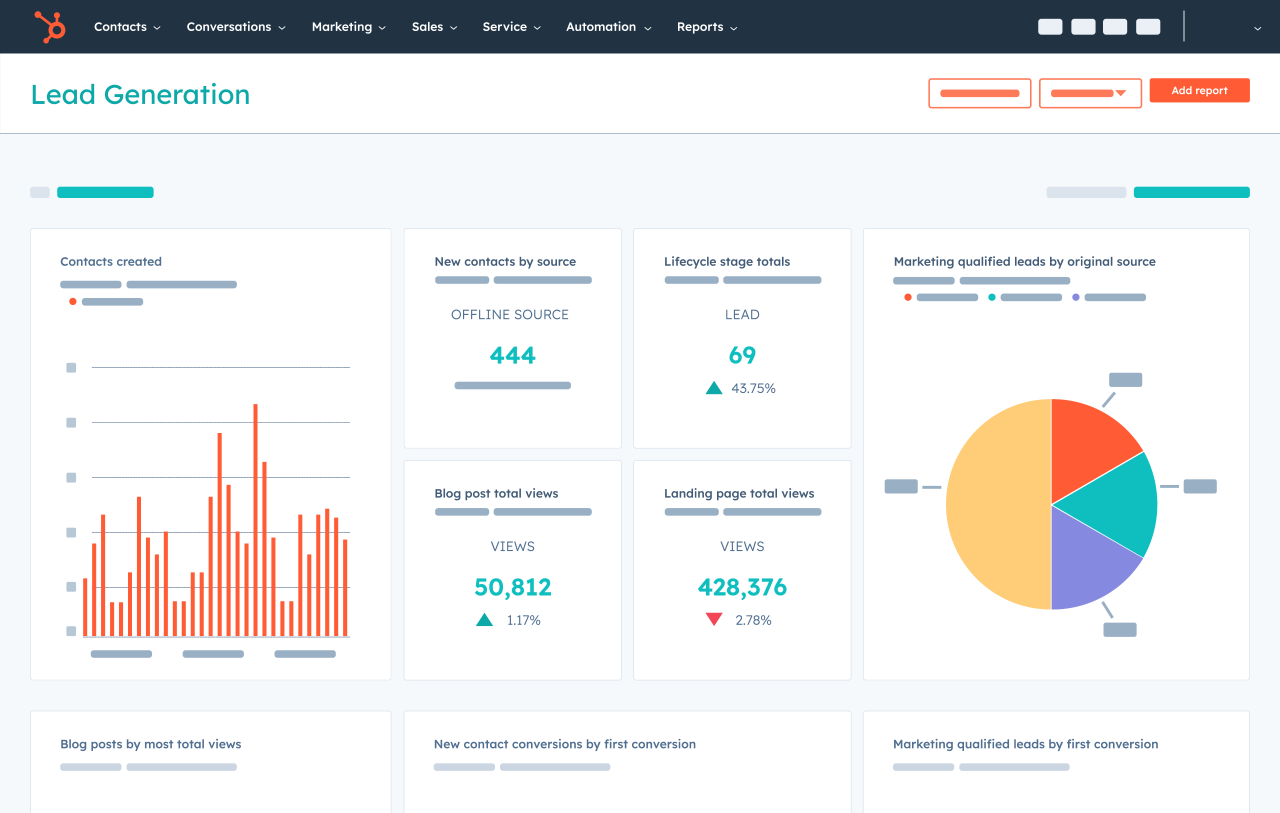
HubSpot
Optimize your marketing, sales, and service strategies with the HubSpot dashboard, offering real-time analytics and insights for business growth.

Insightly
Monitor sales performance, manage projects, and track customer interactions efficiently with the Insightly dashboard for enhanced business insights.

Intercom
The Intercom dashboard provides a comprehensive view of customer interactions, enabling efficient communication and insightful data analysis for your business.

Pipedrive
Get a comprehensive view of your sales pipeline with Pipedrive's intuitive dashboard, designed to streamline your sales process and boost productivity.

Zendesk Explore
Gain insights into your customer support operations with Zendesk Explore's comprehensive dashboard, offering real-time analytics and performance metrics.
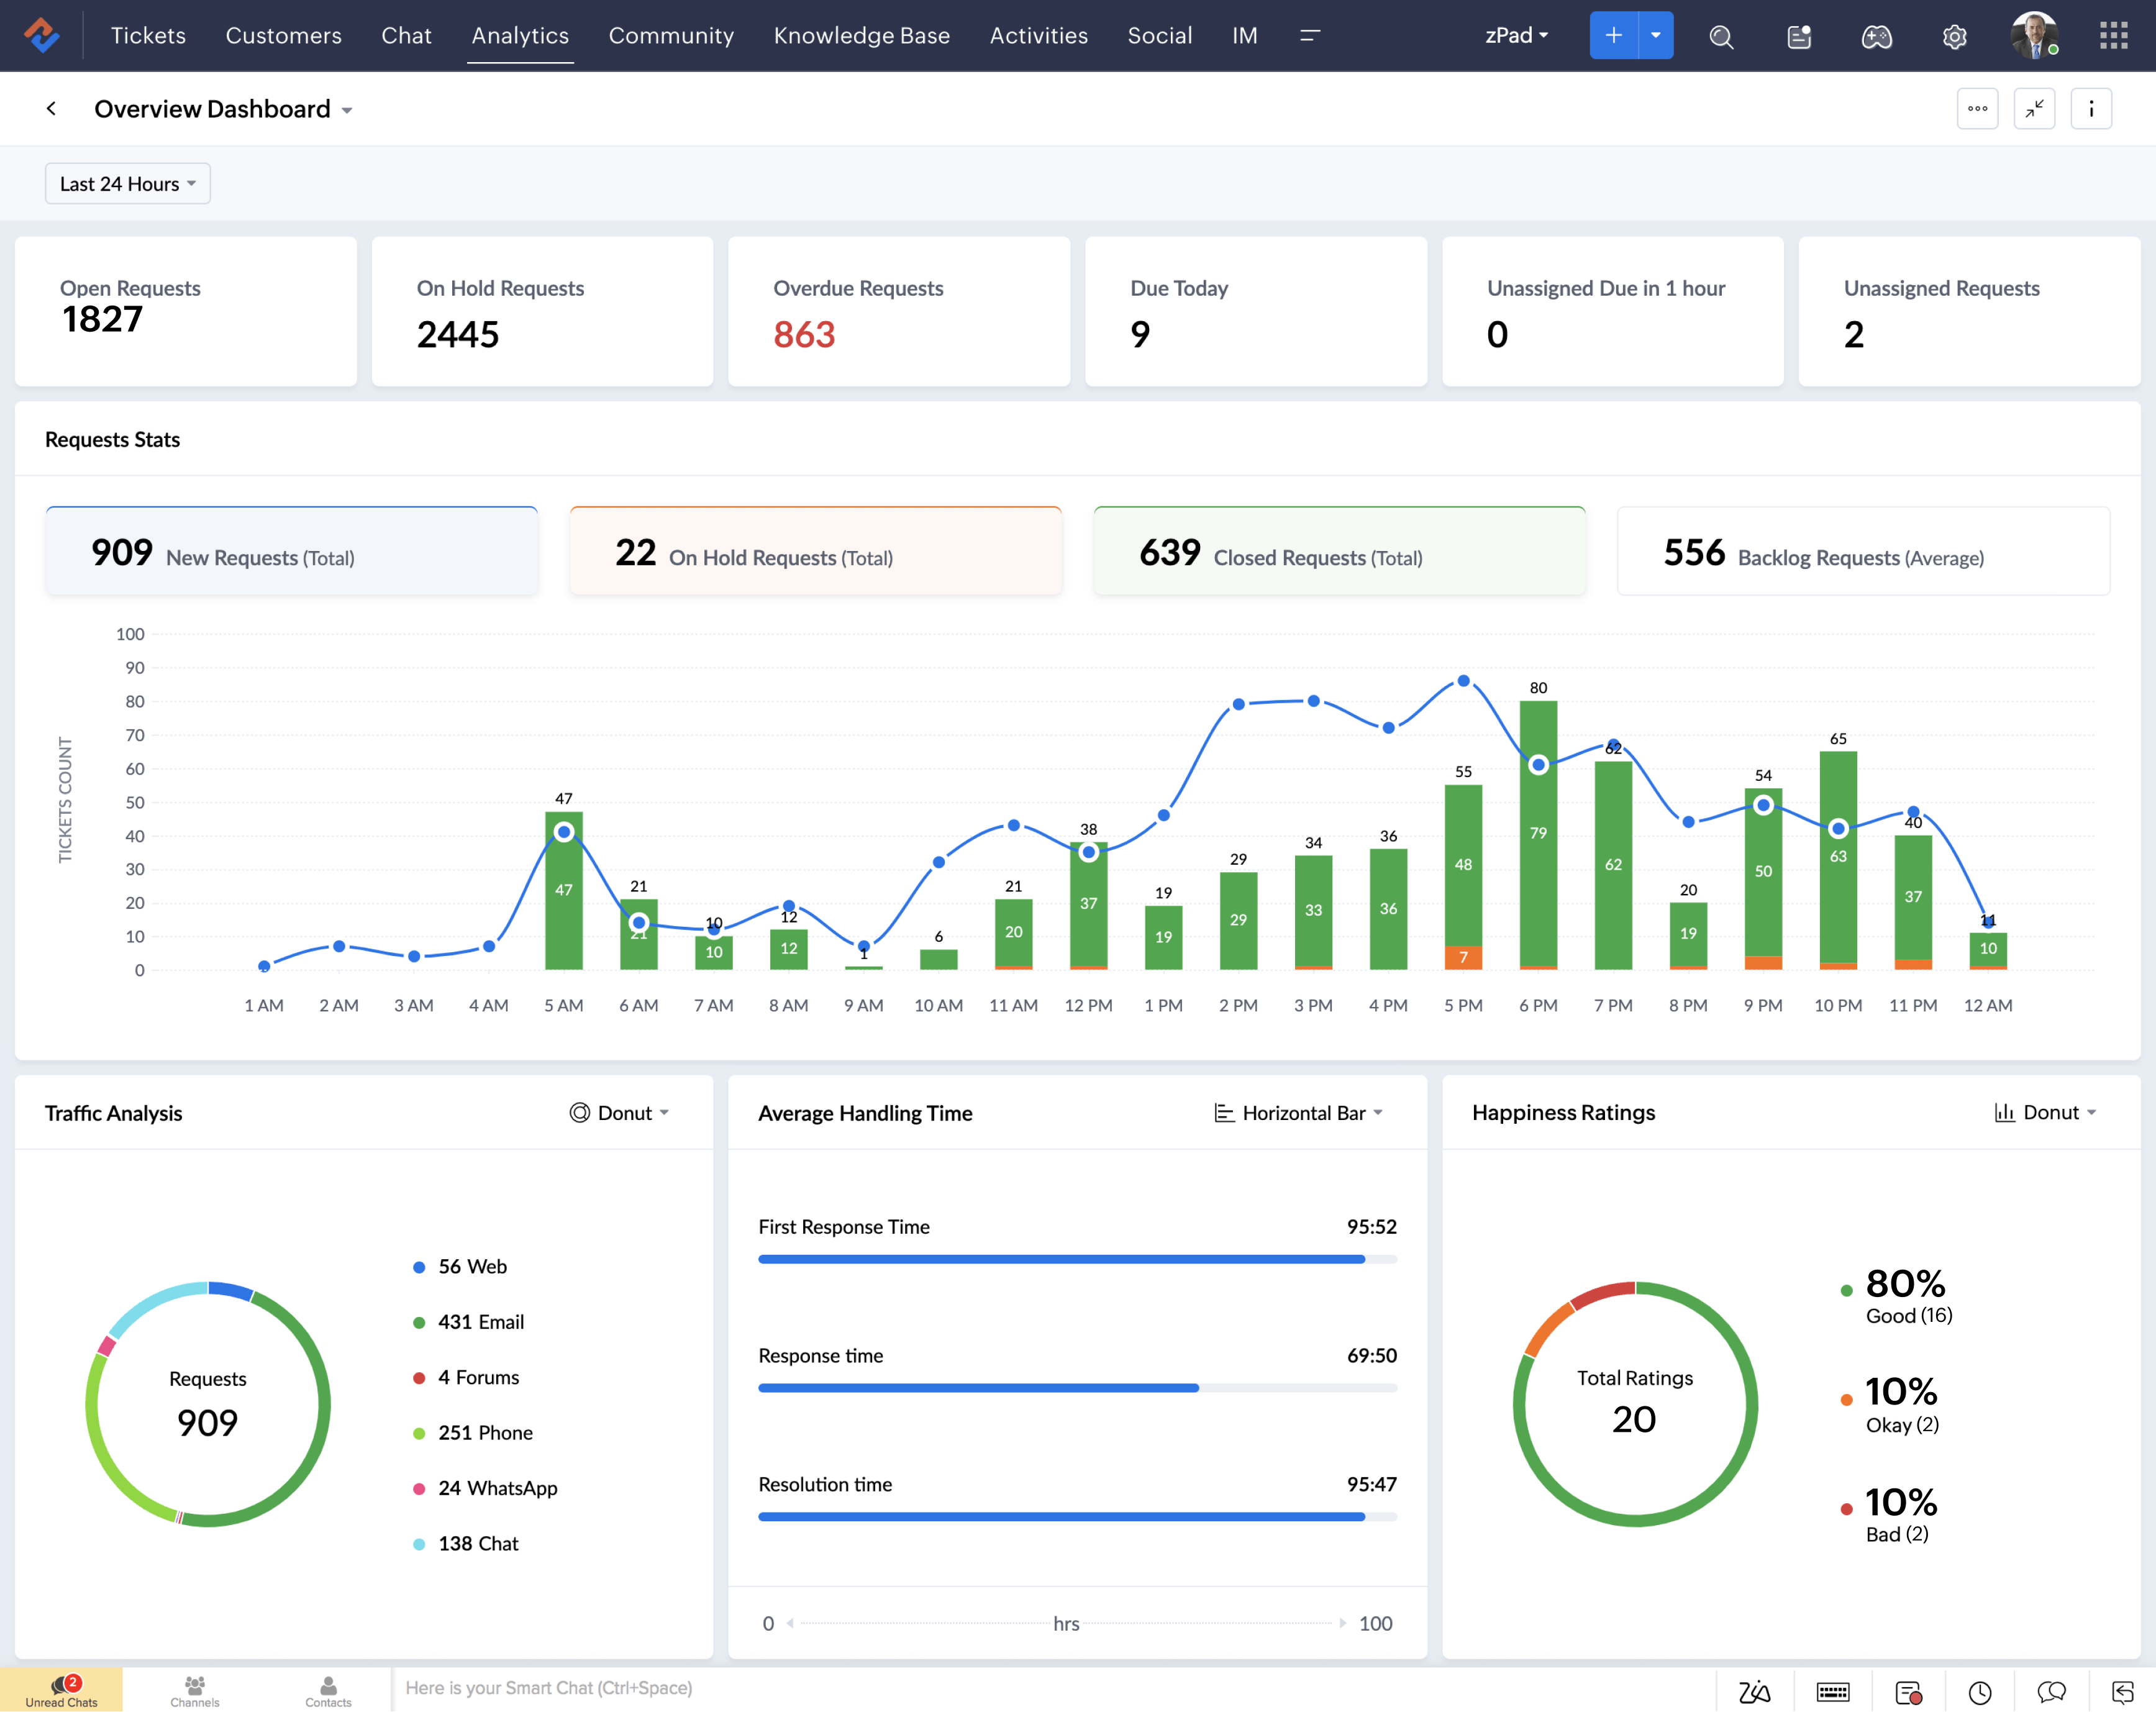
Zoho Desk
Zoho Desk dashboard provides real-time insights into customer support metrics, enhancing team performance and customer satisfaction efficiently.
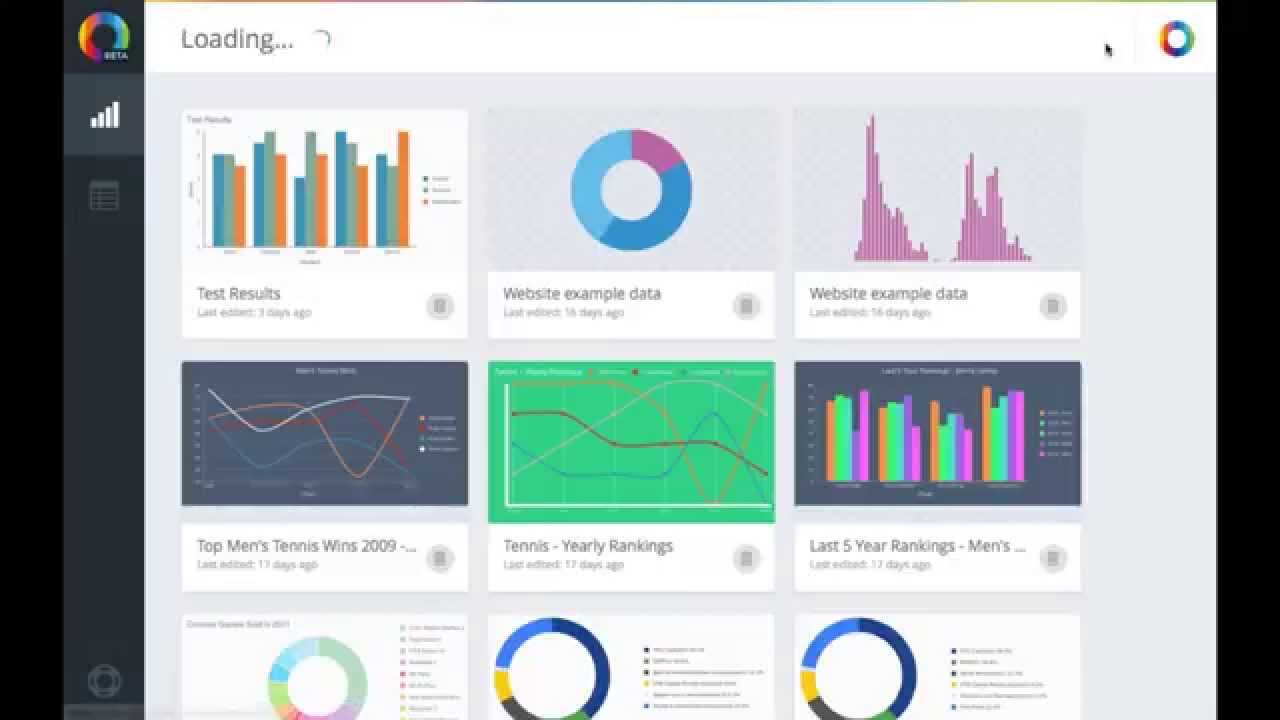
ChartBlocks
Explore dynamic data visualization with ChartBlocks, offering customizable charts and real-time updates for insightful decision-making.

ChartMogul
Gain insights into your subscription business with ChartMogul's comprehensive dashboard, offering real-time analytics and performance metrics.
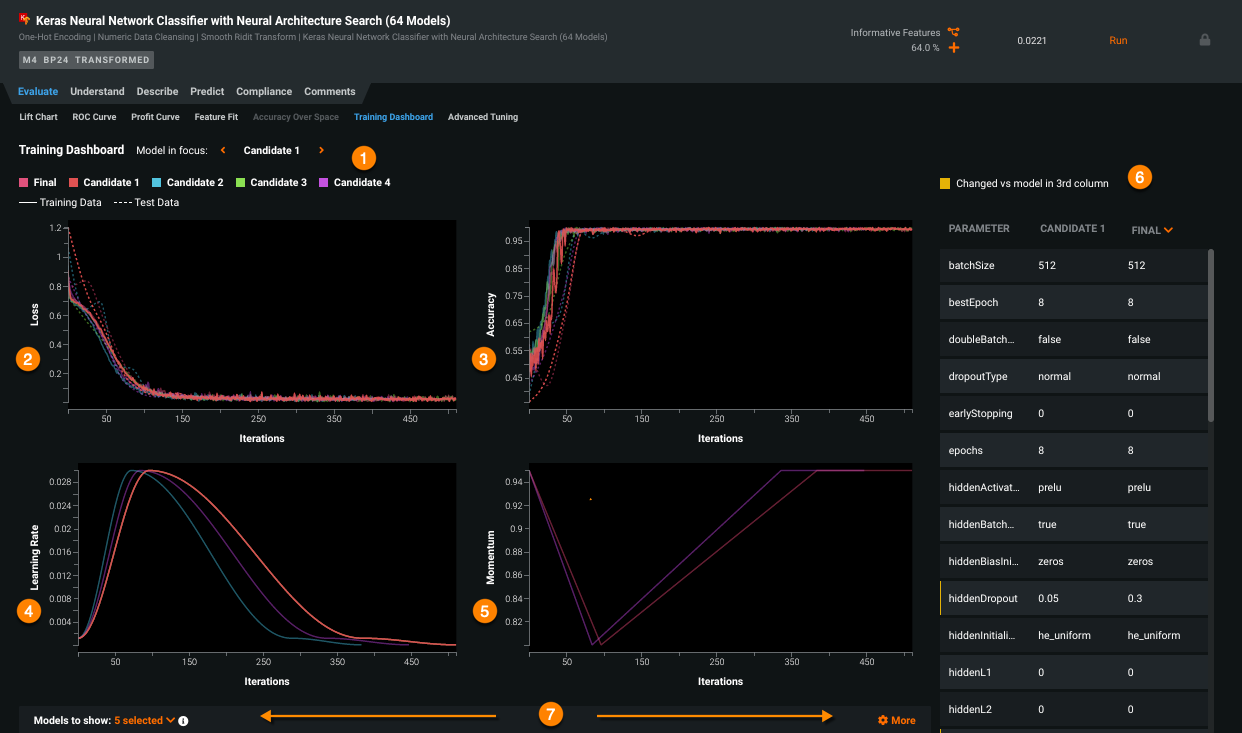
DataRobot
Explore DataRobot's intuitive dashboard for seamless AI model management, offering real-time insights and predictive analytics to drive business decisions.
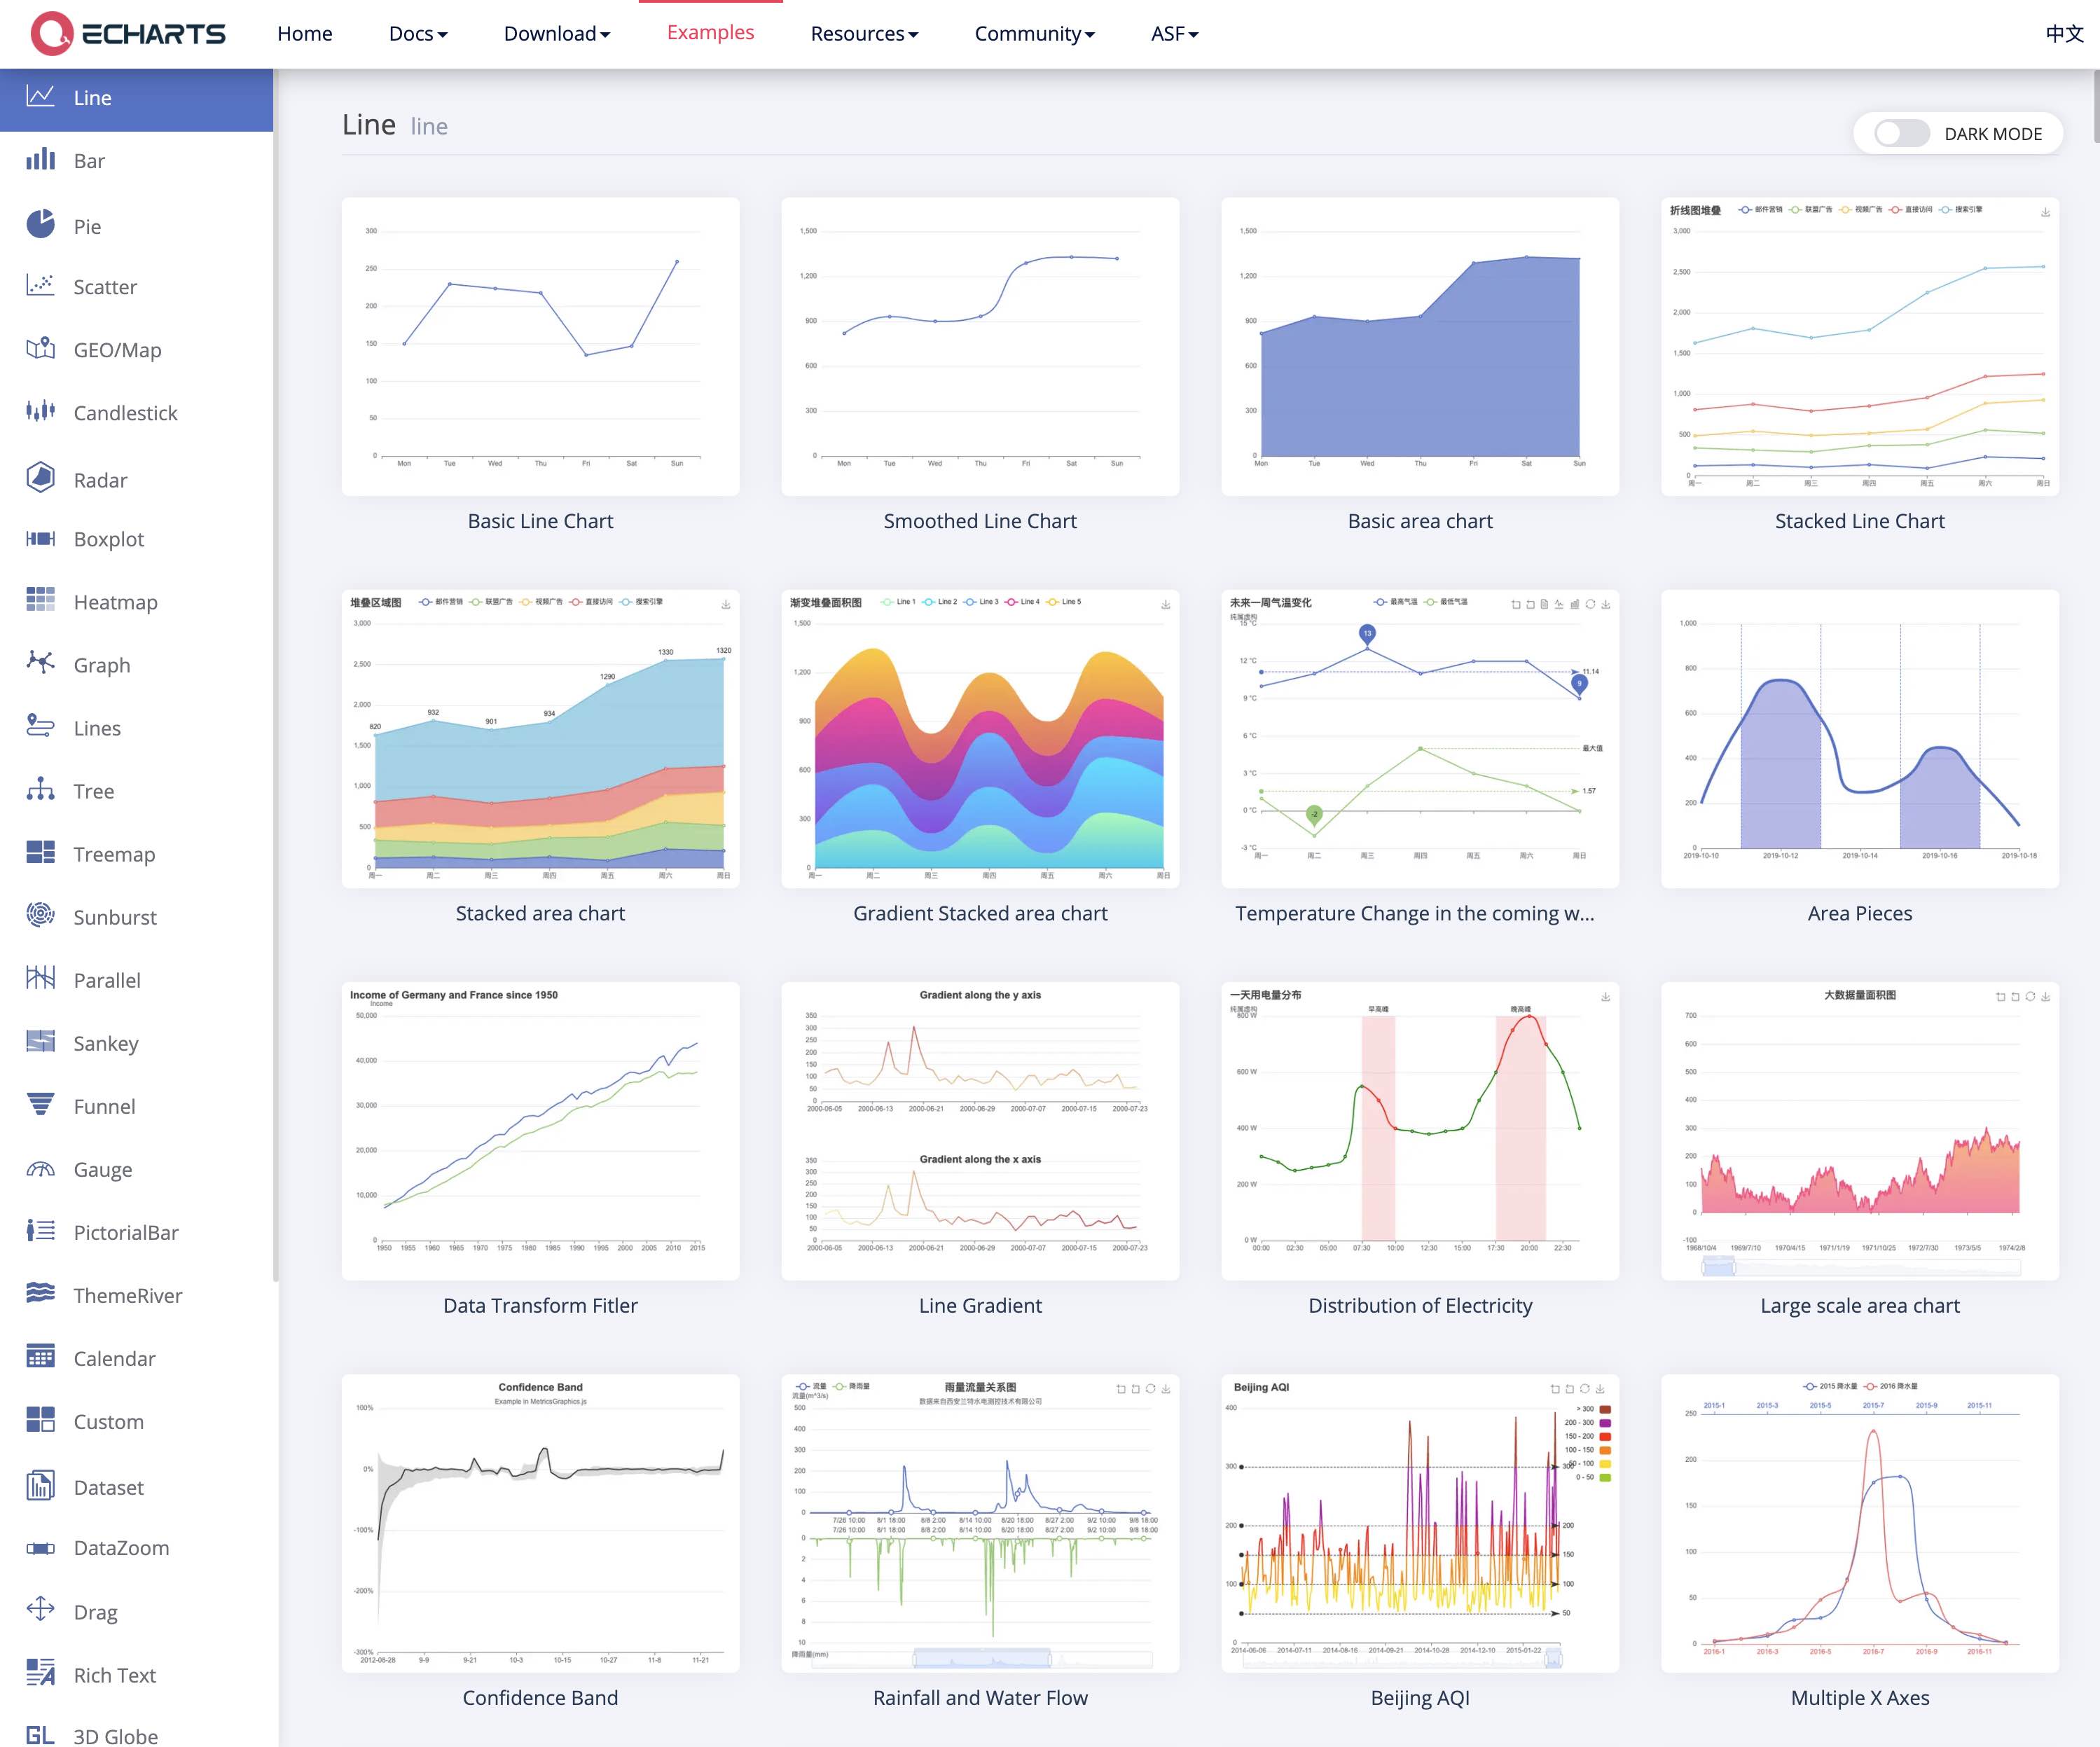
ECharts
Visualize complex data effortlessly with the ECharts dashboard, offering interactive charts and graphs for insightful data analysis and presentation.

Excel Power Query
Efficiently transform, analyze, and visualize data with the Excel Power Query dashboard, streamlining your data management process effortlessly.

Google Apps Script
Streamline your workflows with the Google Apps Script dashboard, offering seamless integration and automation across Google Workspace applications.

Google Sheets
Visualize and analyze your data seamlessly with our Google Sheets dashboard, offering real-time insights and customizable templates for all users.
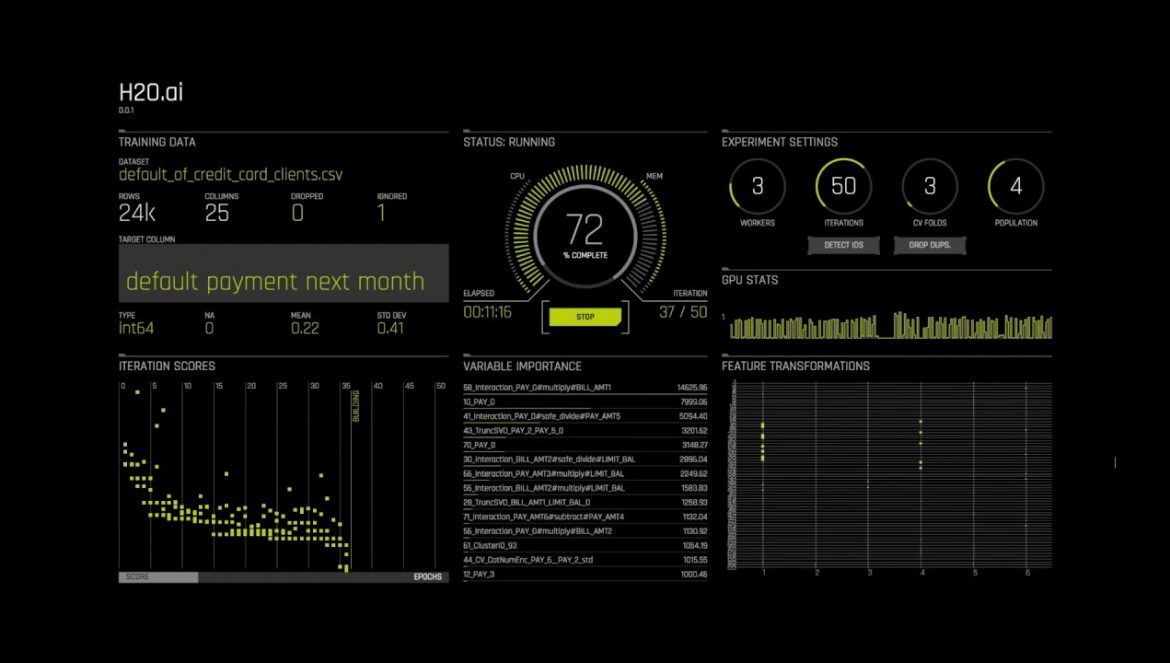
H2O.ai
Explore H2O.ai's intuitive dashboard for seamless AI model building, deployment, and monitoring, enhancing data-driven decision-making.

Highcharts
Explore dynamic data visualizations with the Highcharts dashboard, offering interactive charts and graphs for insightful data analysis and presentation.

Infogram
Visualize data effortlessly with Infogram's interactive dashboard, offering dynamic charts, maps, and infographics for impactful presentations.

Microsoft Access
Streamline your data management with the Microsoft Access dashboard, offering intuitive insights and seamless database interactions for efficient decision-making.
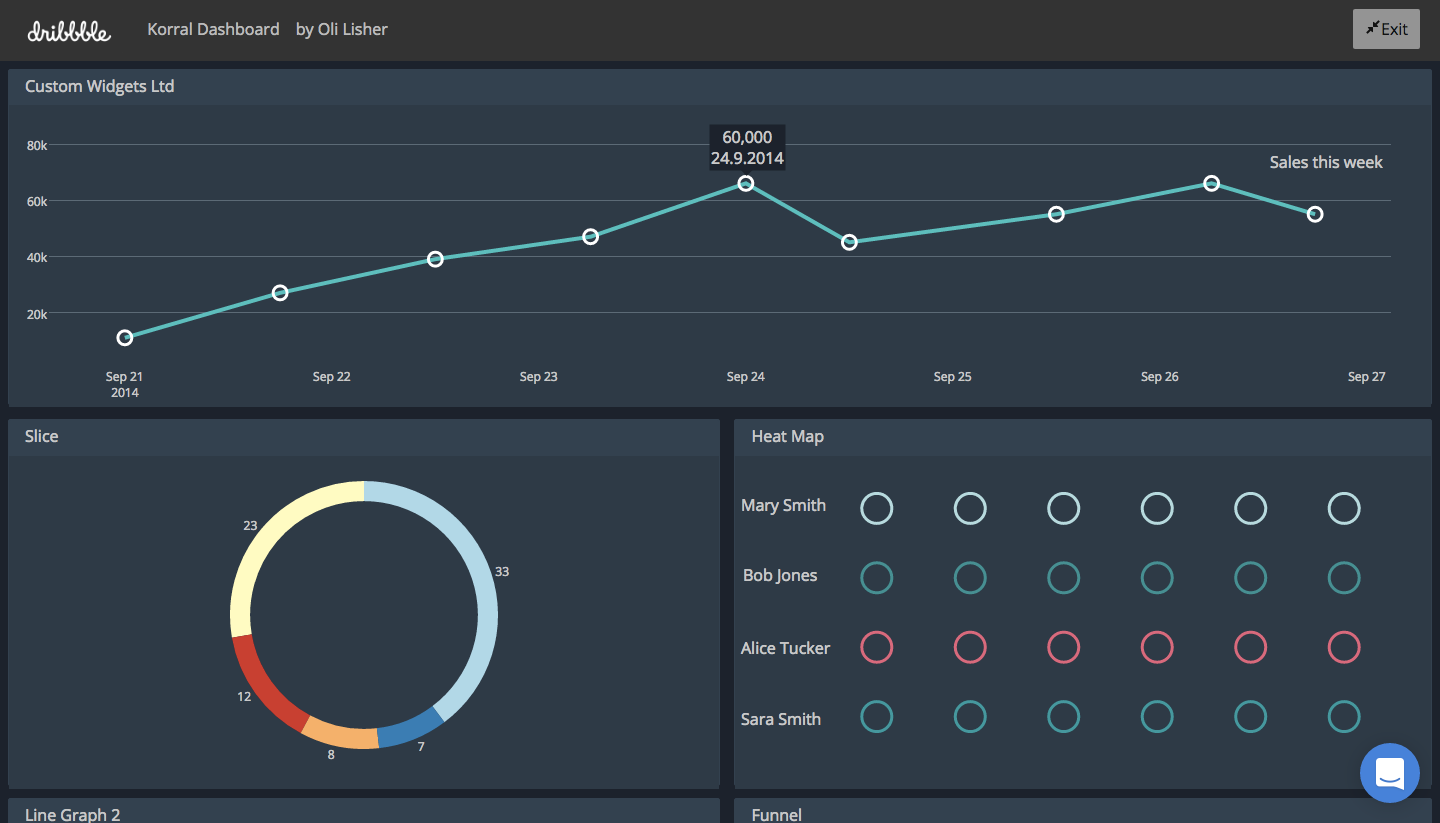
Plotly
Explore interactive visualizations and data insights with the Plotly dashboard, designed for dynamic data analysis and real-time decision-making.

Plotly Dash
Interactive Plotly Dash dashboard for real-time data visualization and analysis, offering dynamic charts and user-friendly interface for insightful decisions.
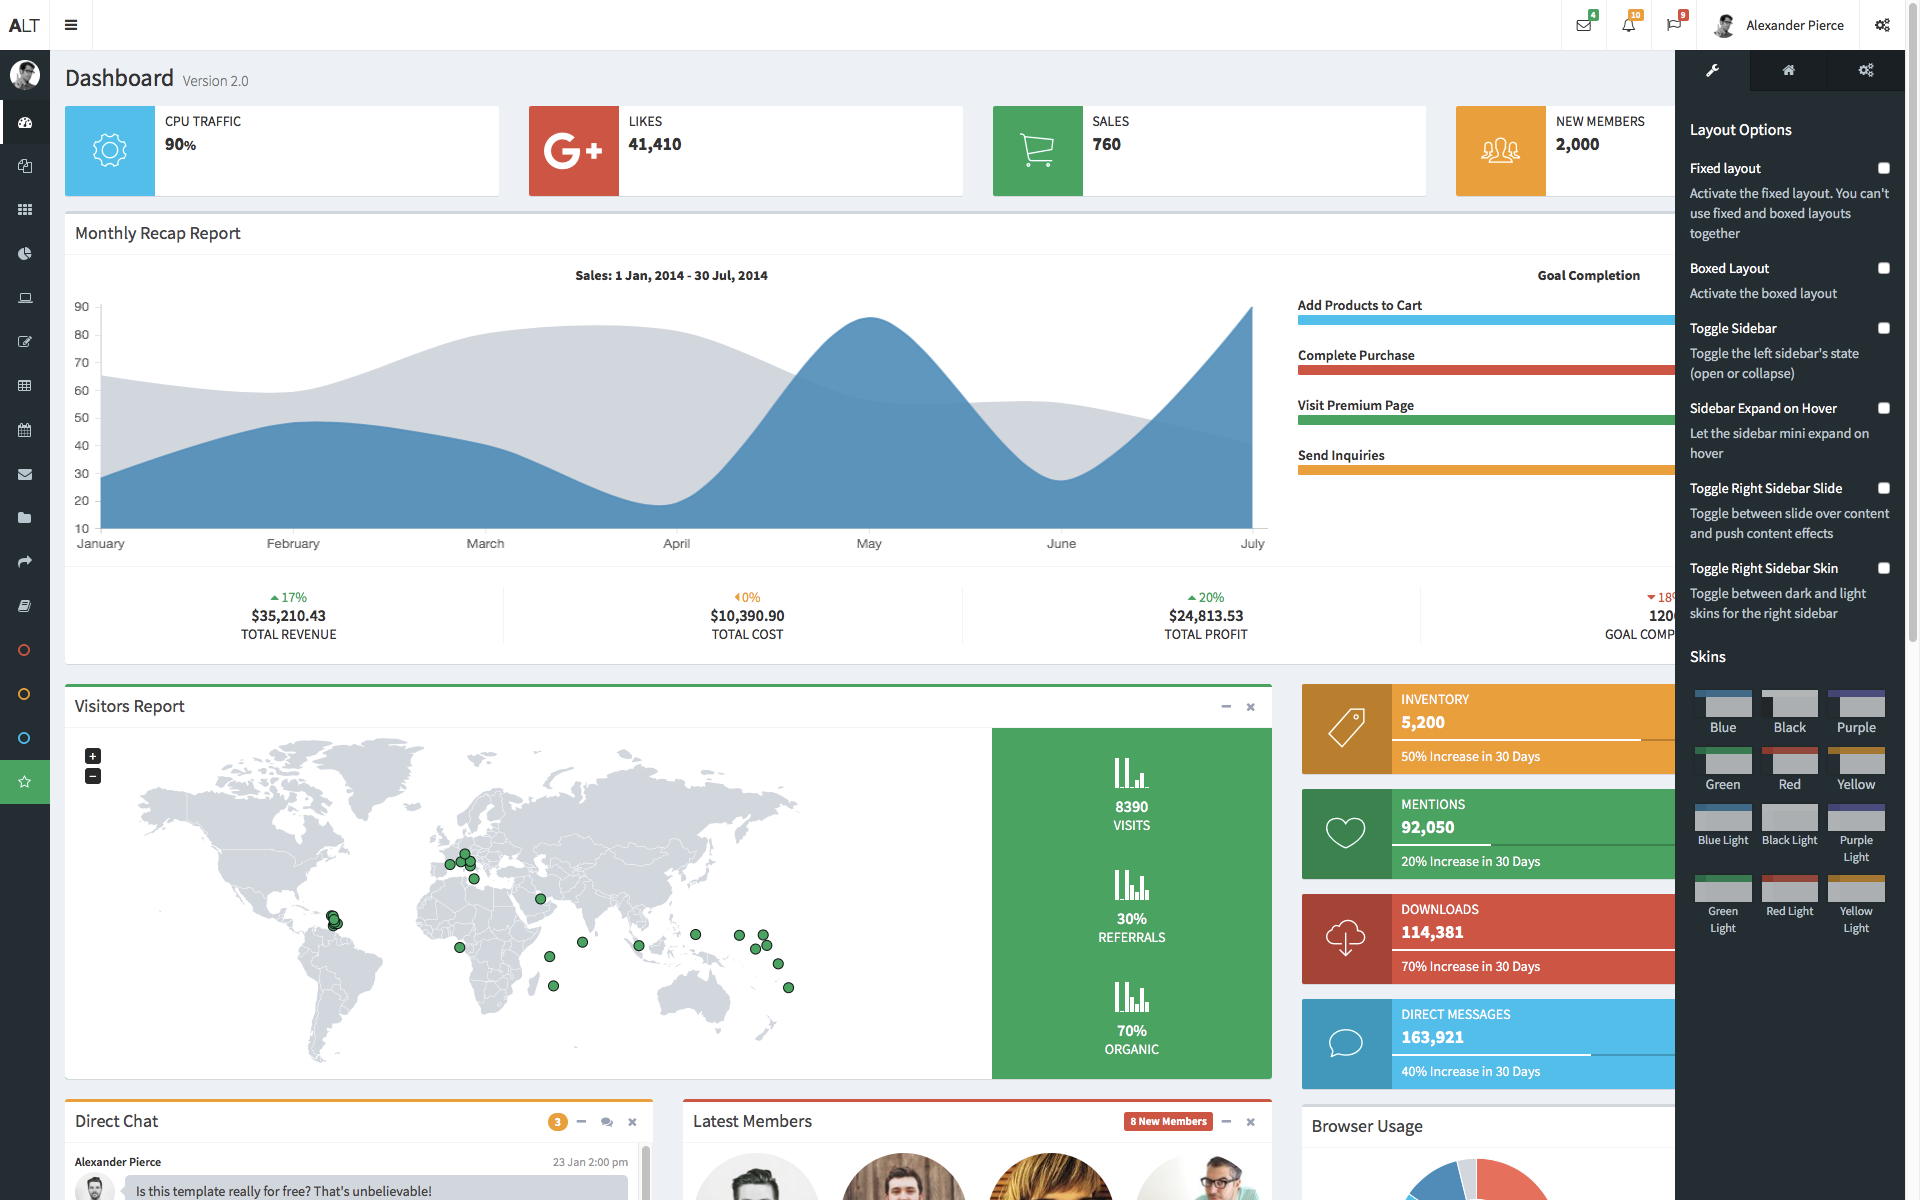
R Shiny
Explore interactive data visualizations and analytics with the R Shiny dashboard, designed for real-time insights and user-friendly data exploration.

RAWgraphs
Explore and visualize complex data effortlessly with RAWgraphs, a versatile dashboard designed for creating custom, insightful visualizations.

SQL Server Reporting Services (SSRS)
The SQL Server Reporting Services (SSRS) dashboard provides comprehensive insights and analytics, enabling data-driven decisions with interactive reports.

Tableau Online
Visualize and analyze your data seamlessly with the Tableau Online dashboard, offering real-time insights and interactive data exploration.
Tableau Public
Explore dynamic data visualizations with this Tableau Public dashboard, offering insights into diverse datasets for informed decision-making.

Venngage
Venngage's dashboard offers intuitive design tools and analytics for creating and managing stunning infographics and visual content effortlessly.

Visme
Visme's dashboard offers an intuitive interface for creating, managing, and analyzing visual content, streamlining your design projects efficiently.
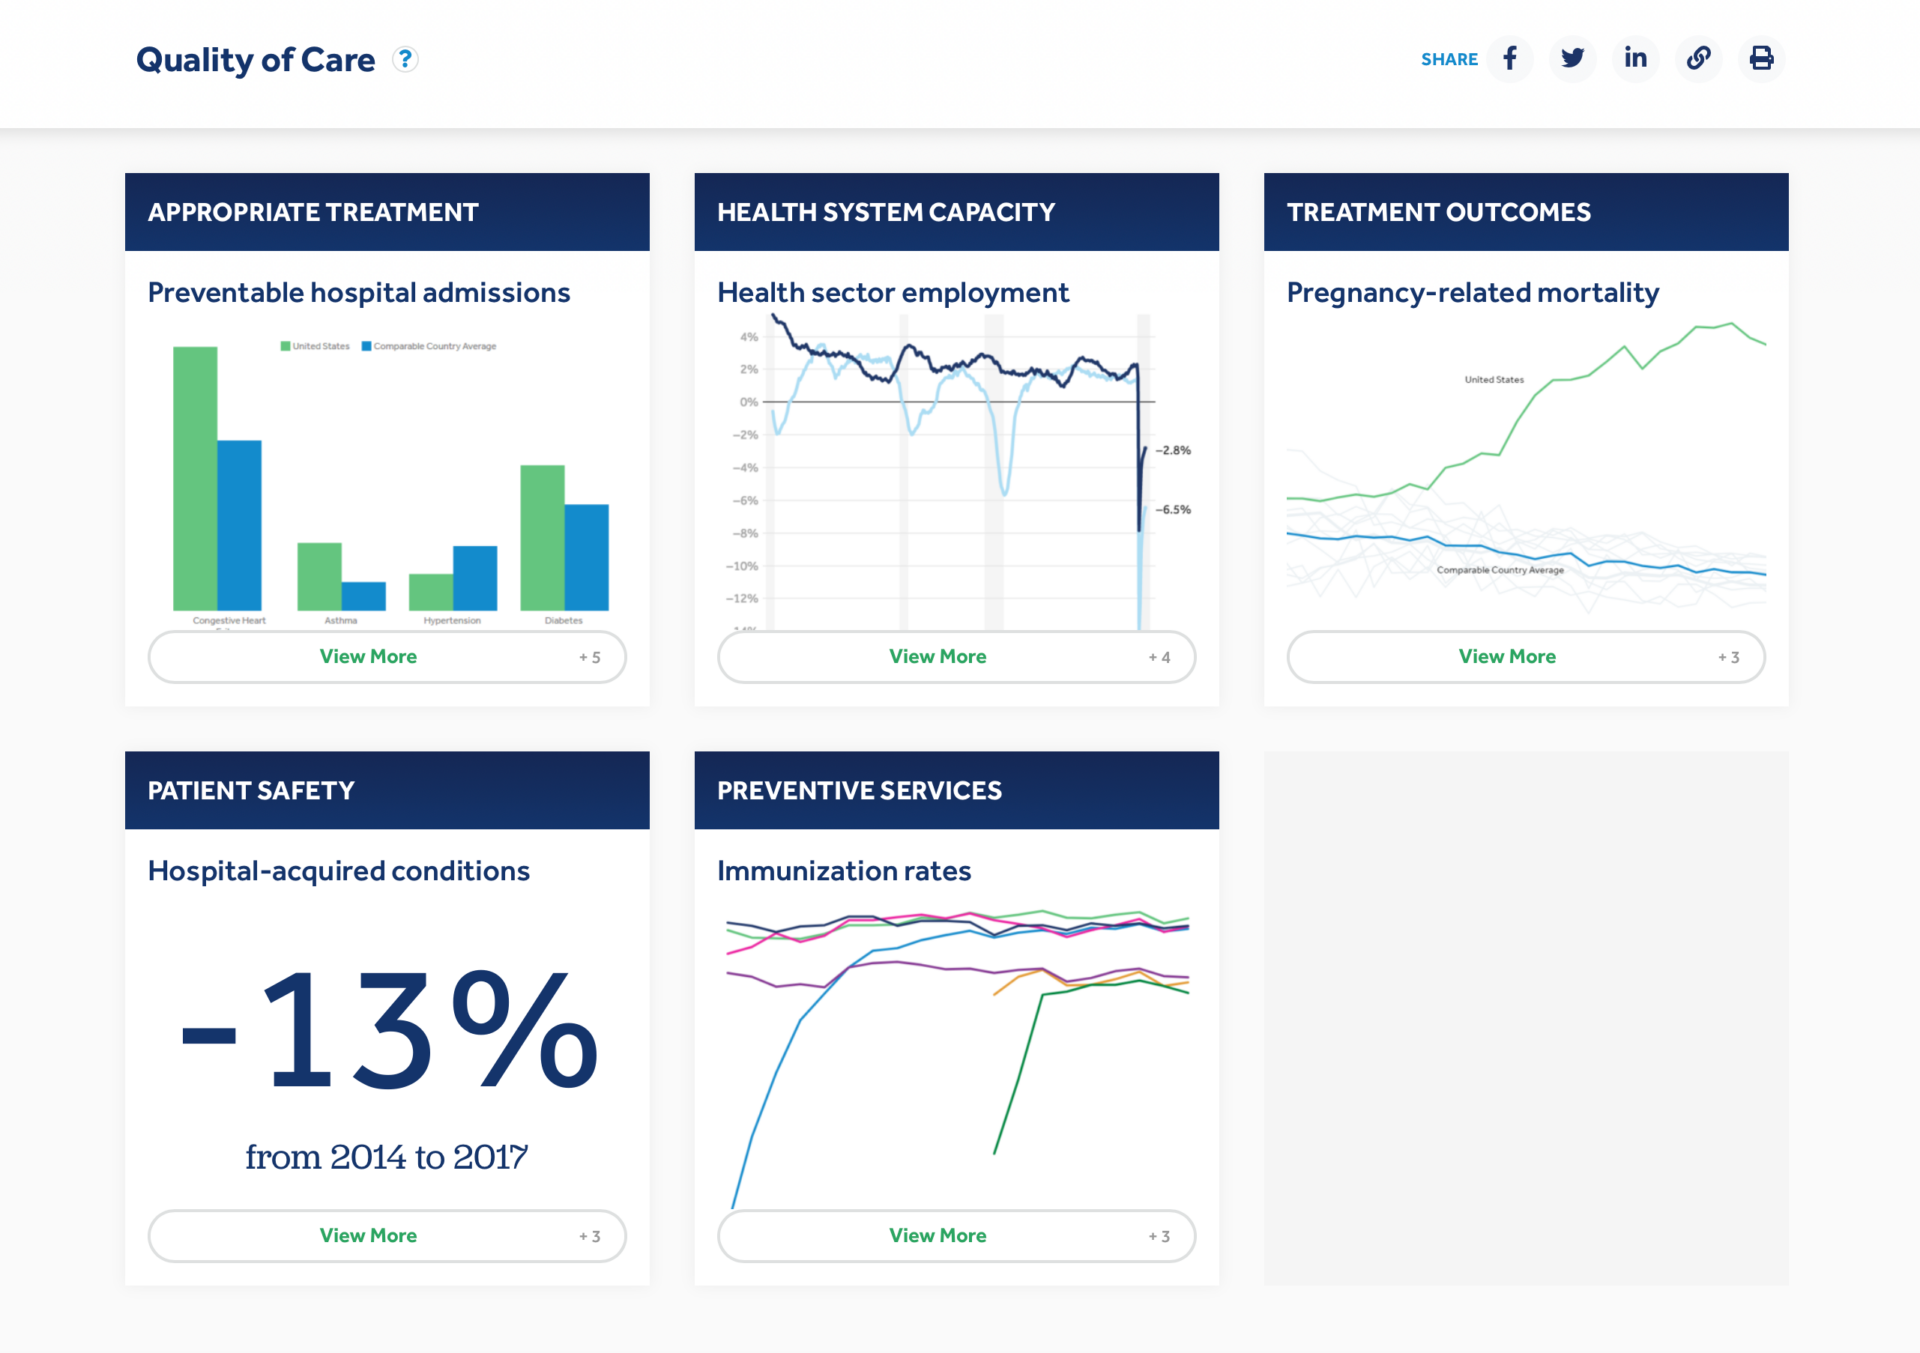
Datawrapper
Explore interactive visualizations and data insights with the Datawrapper dashboard, designed for dynamic data presentation and analysis.
Microsoft Excel
Analyze data efficiently with the Microsoft Excel dashboard, offering dynamic visualizations and insights to streamline your data-driven decisions.

Canva Charts
Visualize data effortlessly with Canva Charts, offering customizable templates and intuitive design tools for impactful presentations and reports.

Ansible Tower
Monitor and manage your Ansible automation workflows efficiently with real-time insights and control using the Ansible Tower dashboard.

AppDynamics
Gain real-time insights into application performance, user experience, and business outcomes with the AppDynamics dashboard.
Bitbucket Analytics
Gain insights into your Bitbucket repositories with real-time analytics on commits, pull requests, and code reviews to enhance team productivity.

Chef Automate
Chef Automate dashboard offers comprehensive insights into infrastructure automation, compliance, and application delivery in real-time.
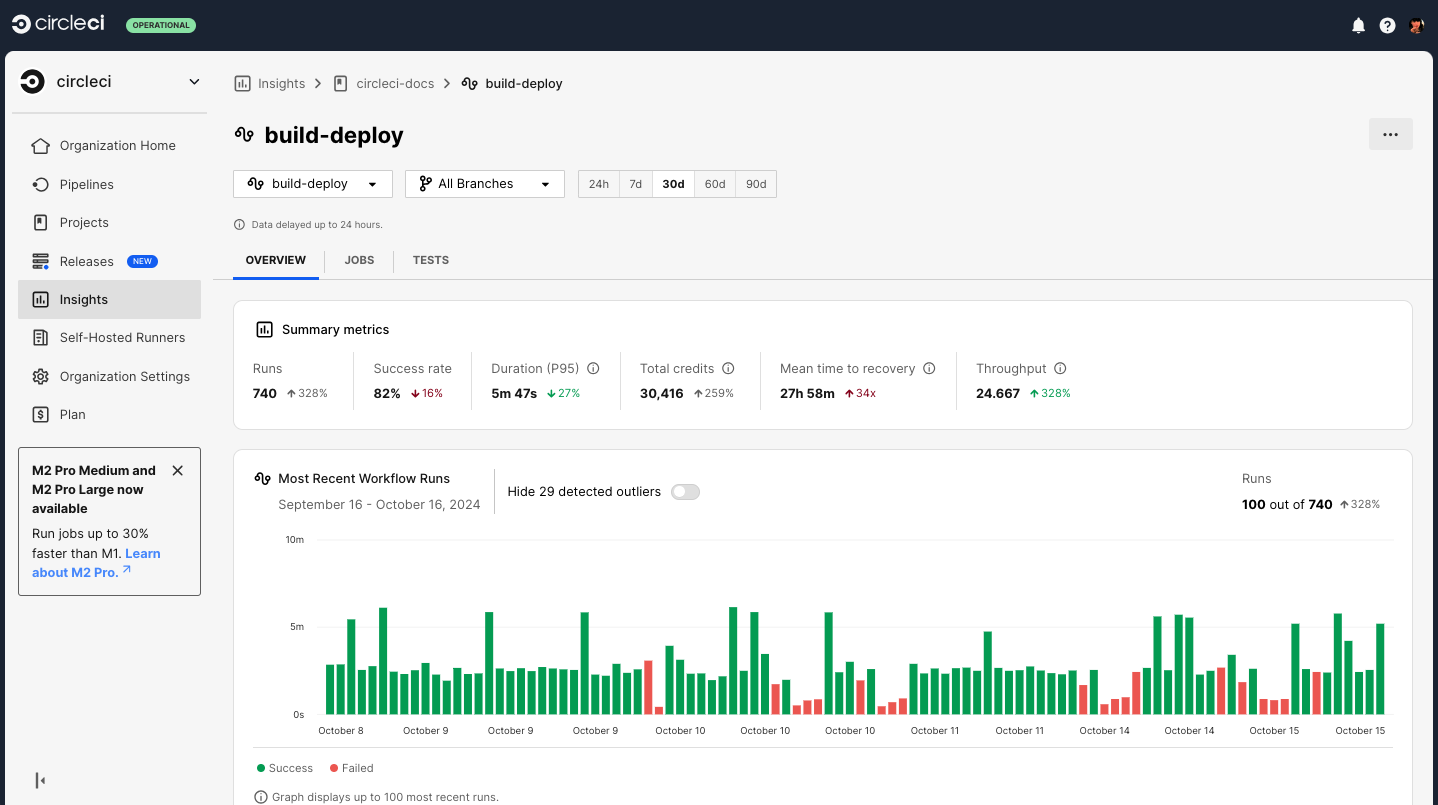
CircleCI Insights
CircleCI Insights provides real-time analytics on your CI/CD pipelines, helping teams optimize performance and improve software delivery efficiency.

GitHub Insights
Gain actionable insights into your GitHub repositories with real-time analytics and trends to optimize project management and collaboration.
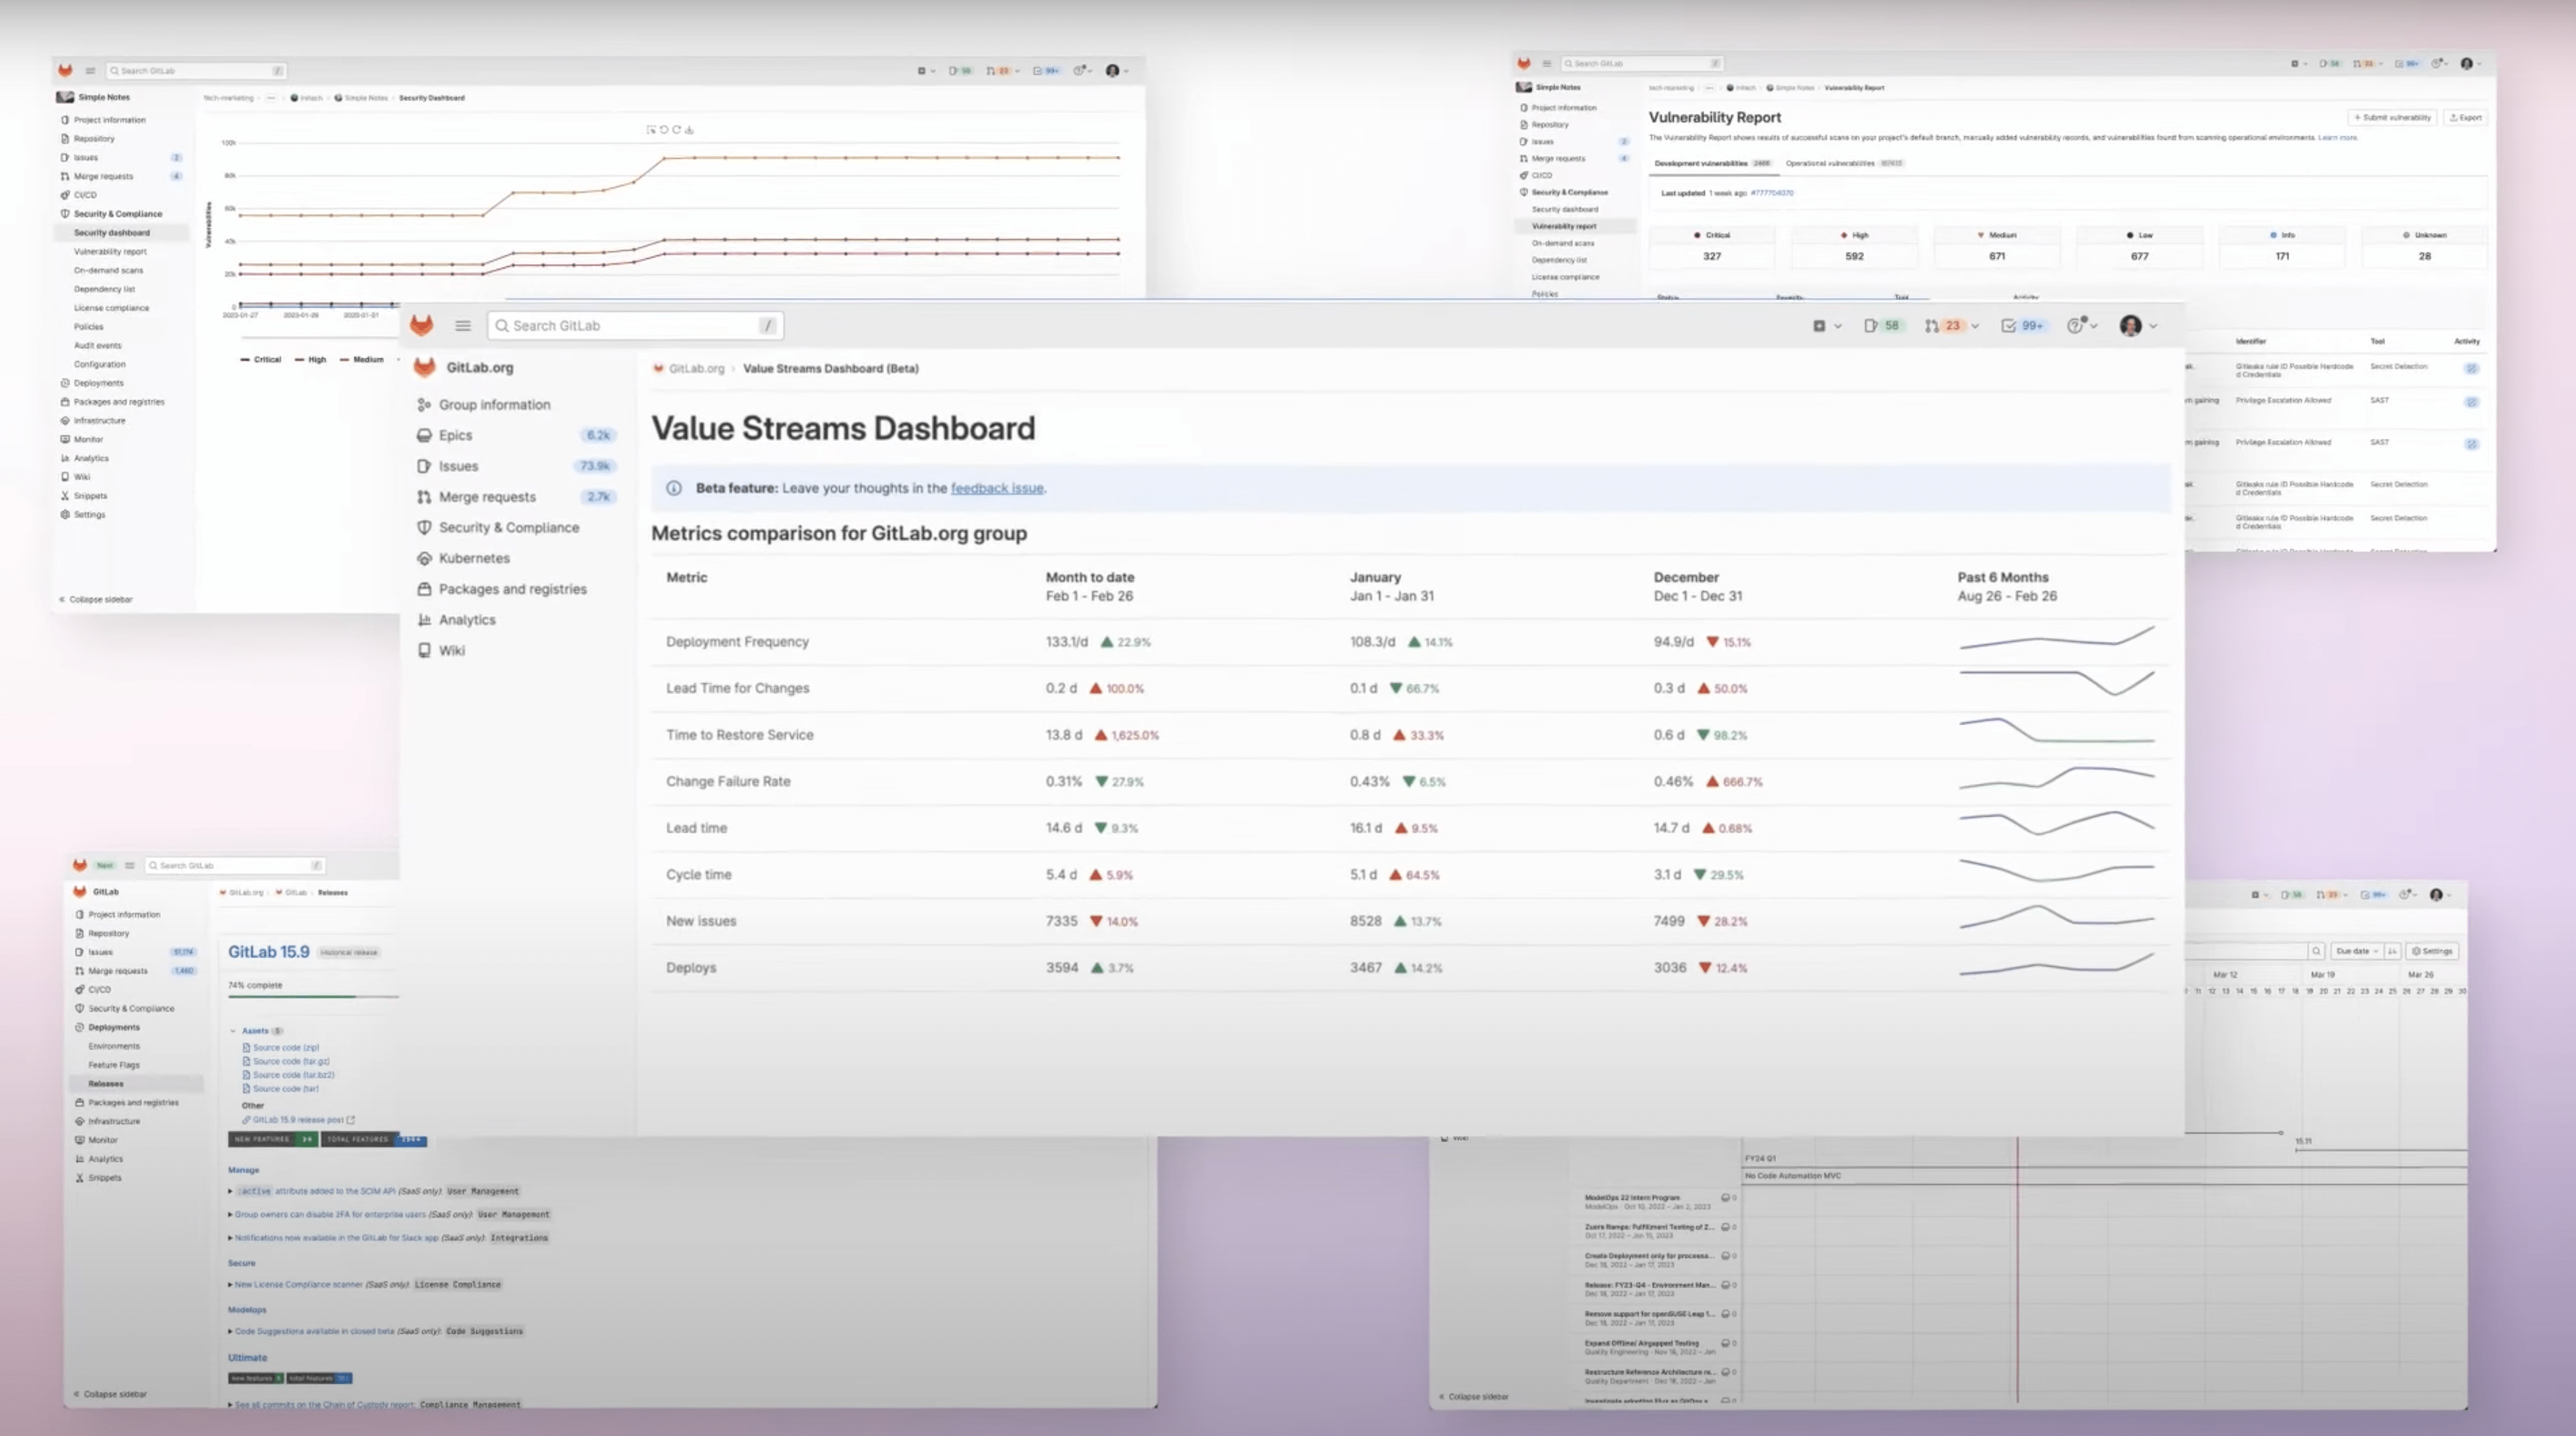
GitLab Analytics
Gain insights into your GitLab projects with real-time analytics, tracking performance, productivity, and collaboration metrics efficiently.
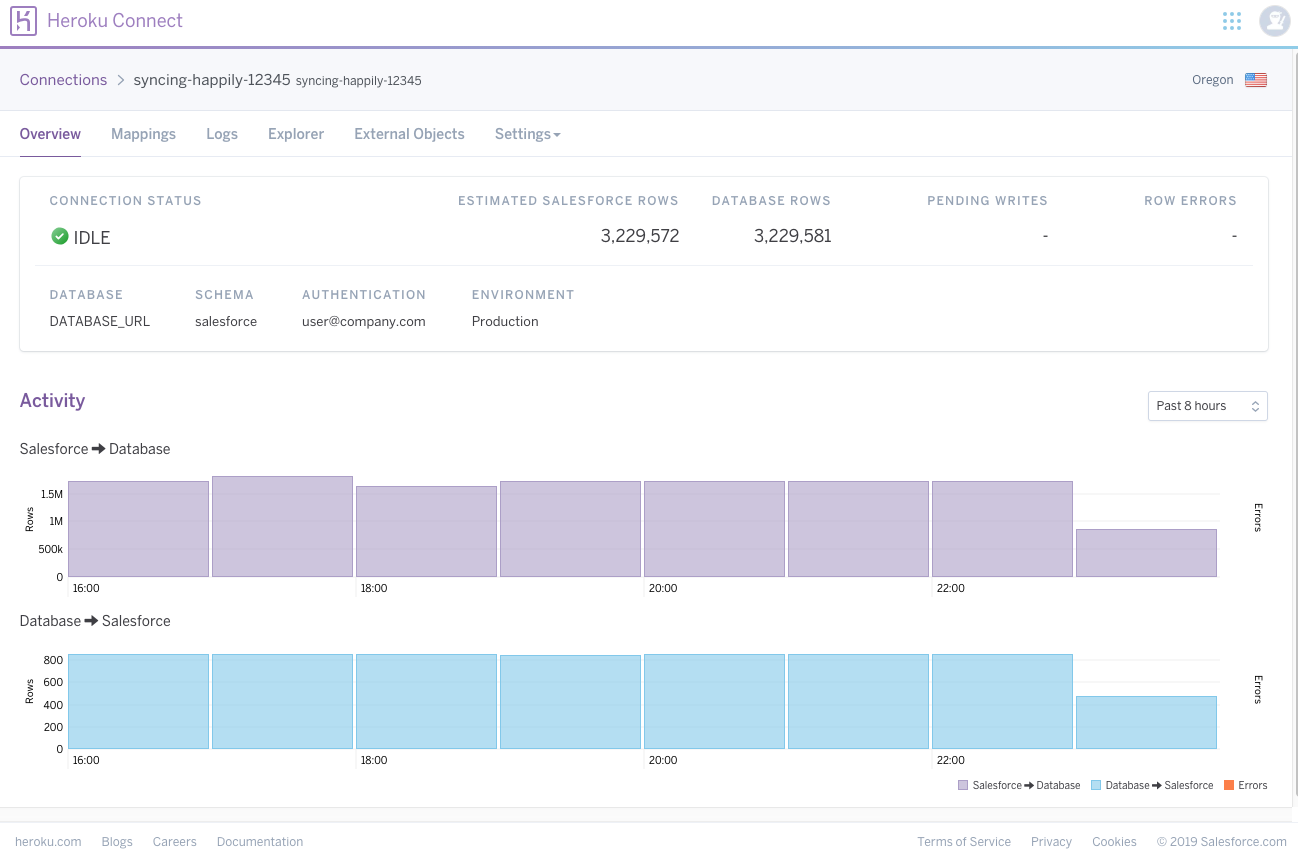
Heroku Dashboard
The Heroku Dashboard provides a comprehensive view of your applications, enabling efficient management, monitoring, and deployment in a user-friendly interface.
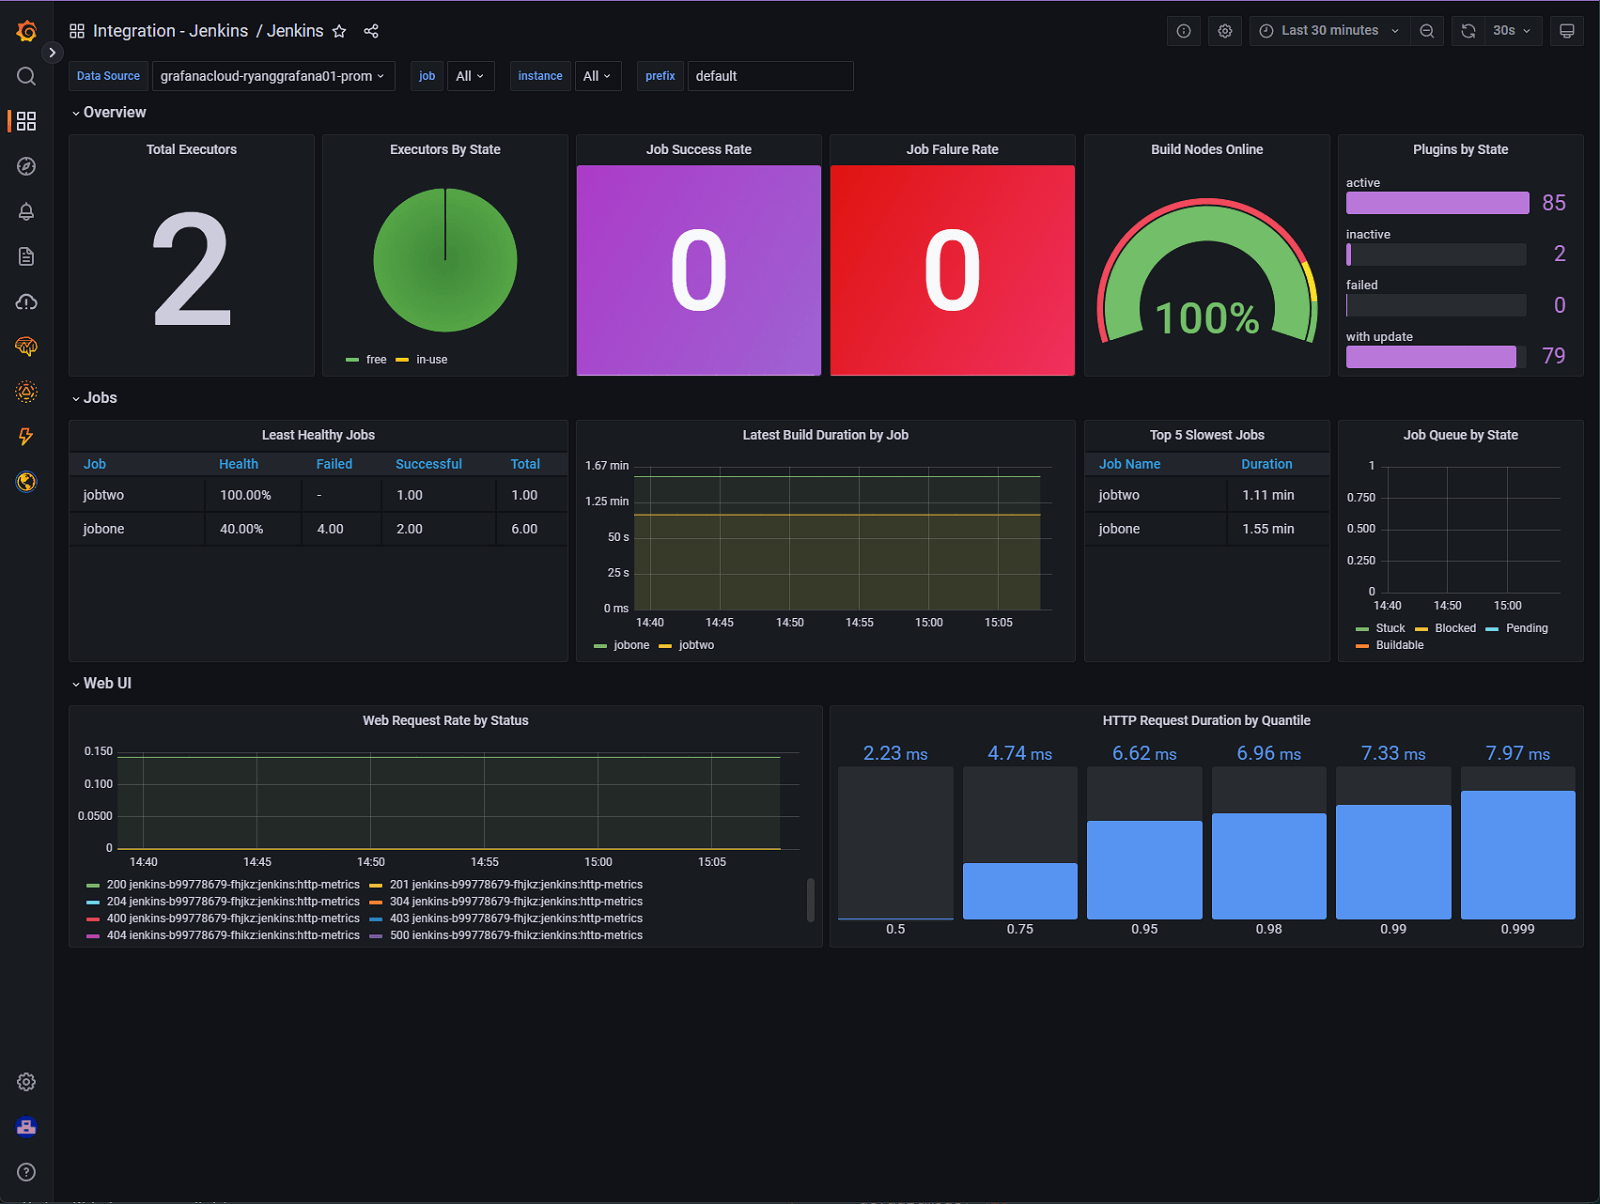
Jenkins Dashboard
The Jenkins Dashboard provides a comprehensive view of your CI/CD pipelines, job statuses, and build metrics, ensuring efficient project management.
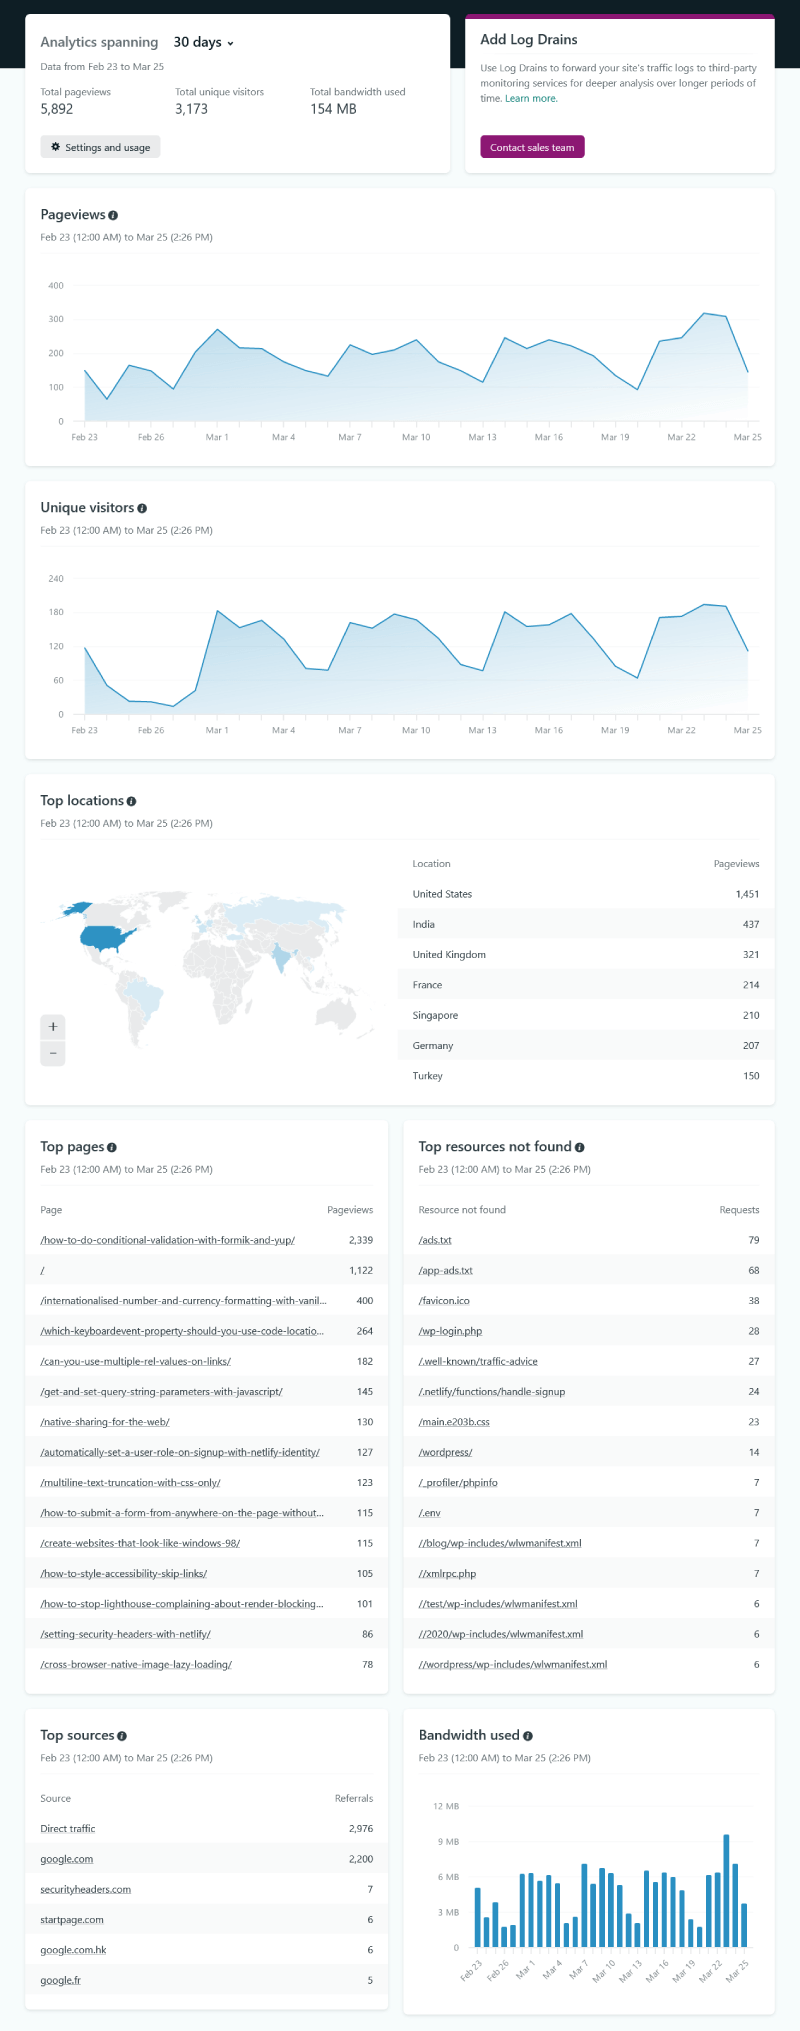
Netlify Analytics
Gain insights into your website's performance with Netlify Analytics, offering real-time data on traffic, sources, and user behavior in one place.
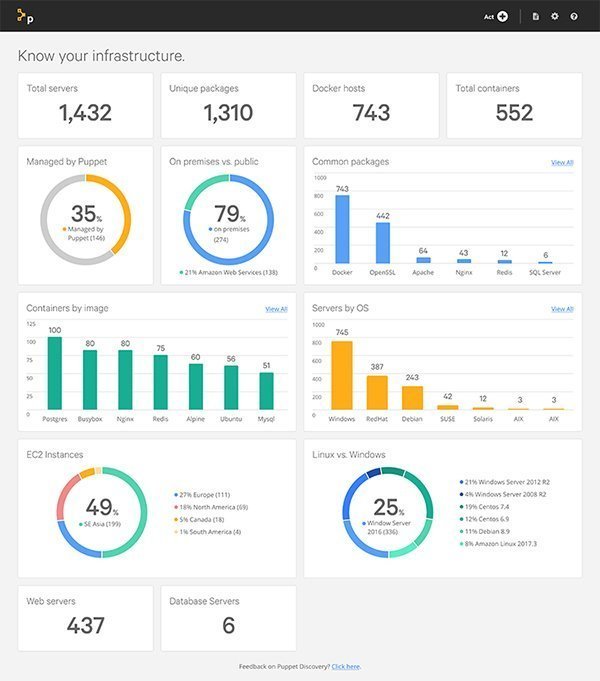
Puppet Enterprise
Monitor and manage your IT infrastructure efficiently with Puppet Enterprise's comprehensive dashboard, offering real-time insights and automation.
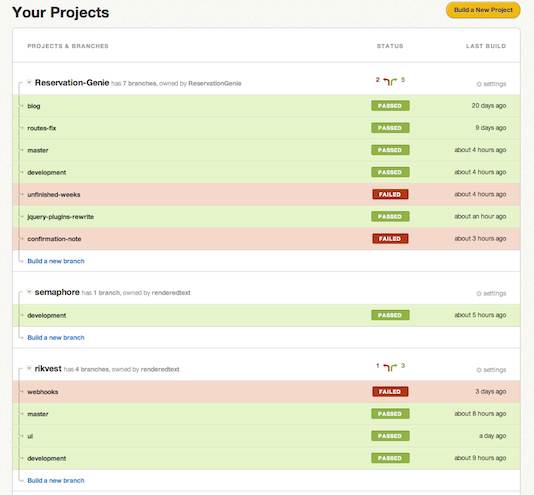
Semaphore Dashboard
The Semaphore Dashboard provides real-time insights into your CI/CD pipelines, helping you optimize performance and streamline development processes.

Splunk Infrastructure Monitoring
Monitor and optimize your infrastructure with real-time analytics and insights using the Splunk Infrastructure Monitoring dashboard.

Amplitude for E-commerce
Gain insights into customer behavior, optimize sales funnels, and enhance user engagement with the Amplitude for E-commerce dashboard.
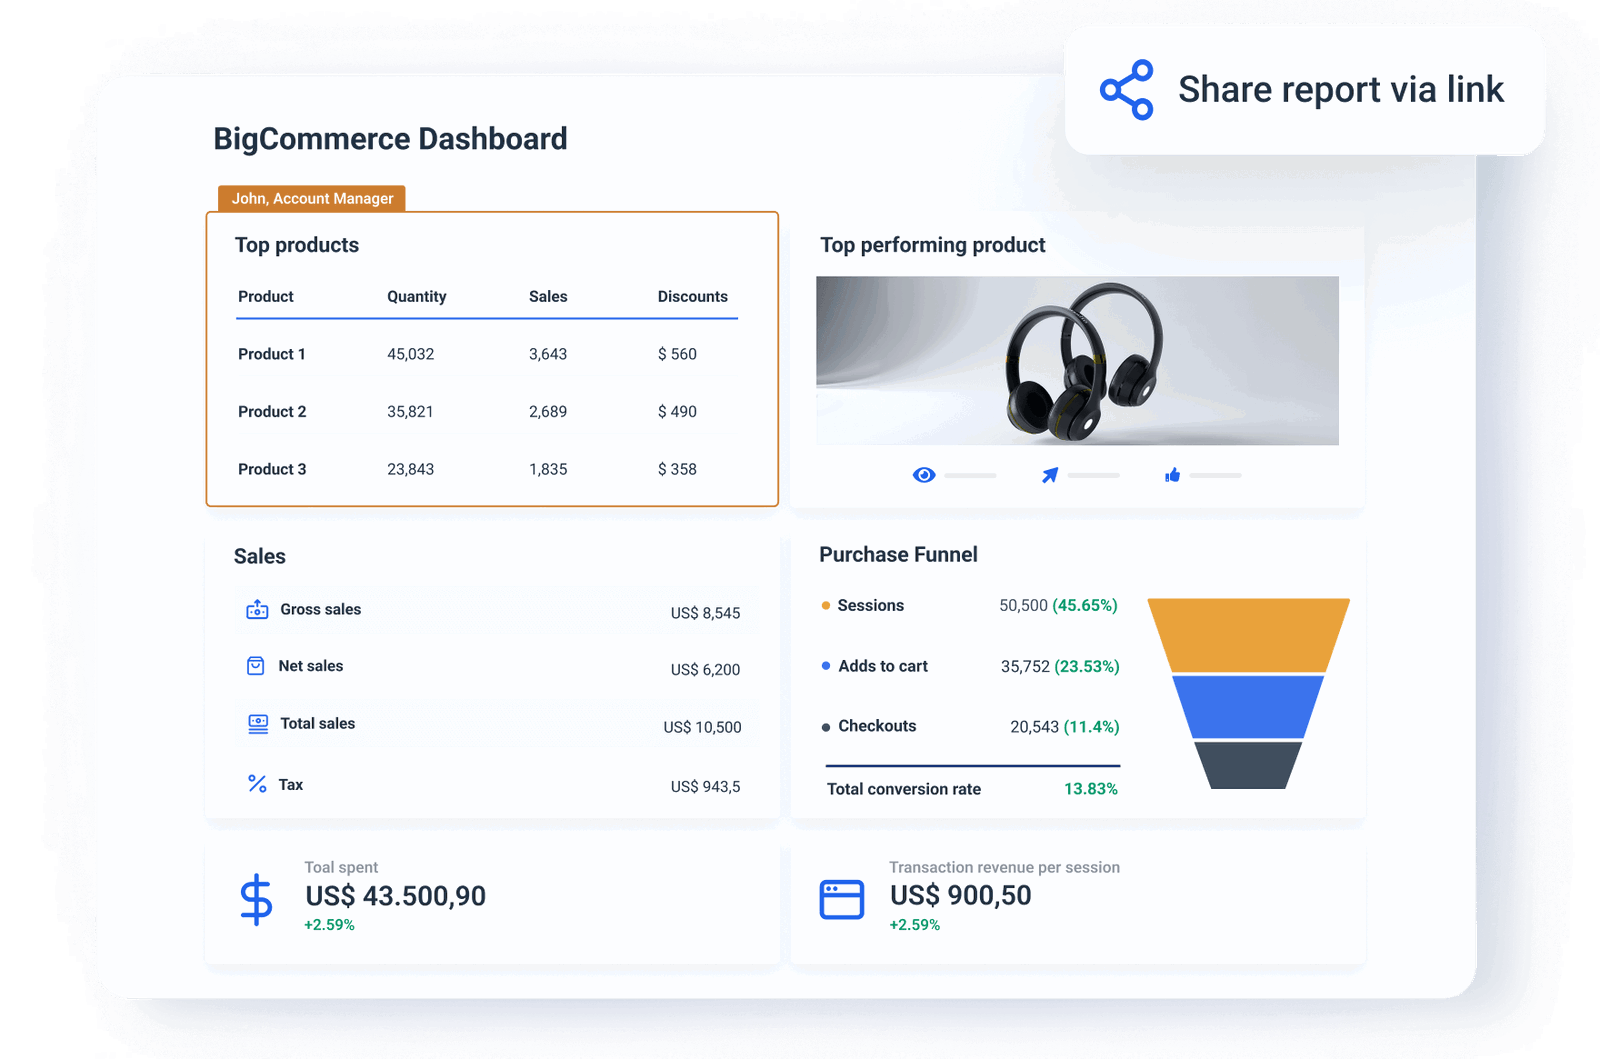
BigCommerce Insights
Unlock data-driven growth with BigCommerce Insights, offering real-time analytics, customer trends, and sales performance metrics for your store.

Google Analytics E-commerce
Track and analyze your online store's performance with Google Analytics E-commerce, offering insights into sales, conversion rates, and customer behavior.

Klaviyo
Gain insights into your email marketing performance with Klaviyo's intuitive dashboard, offering real-time analytics and customer engagement metrics.
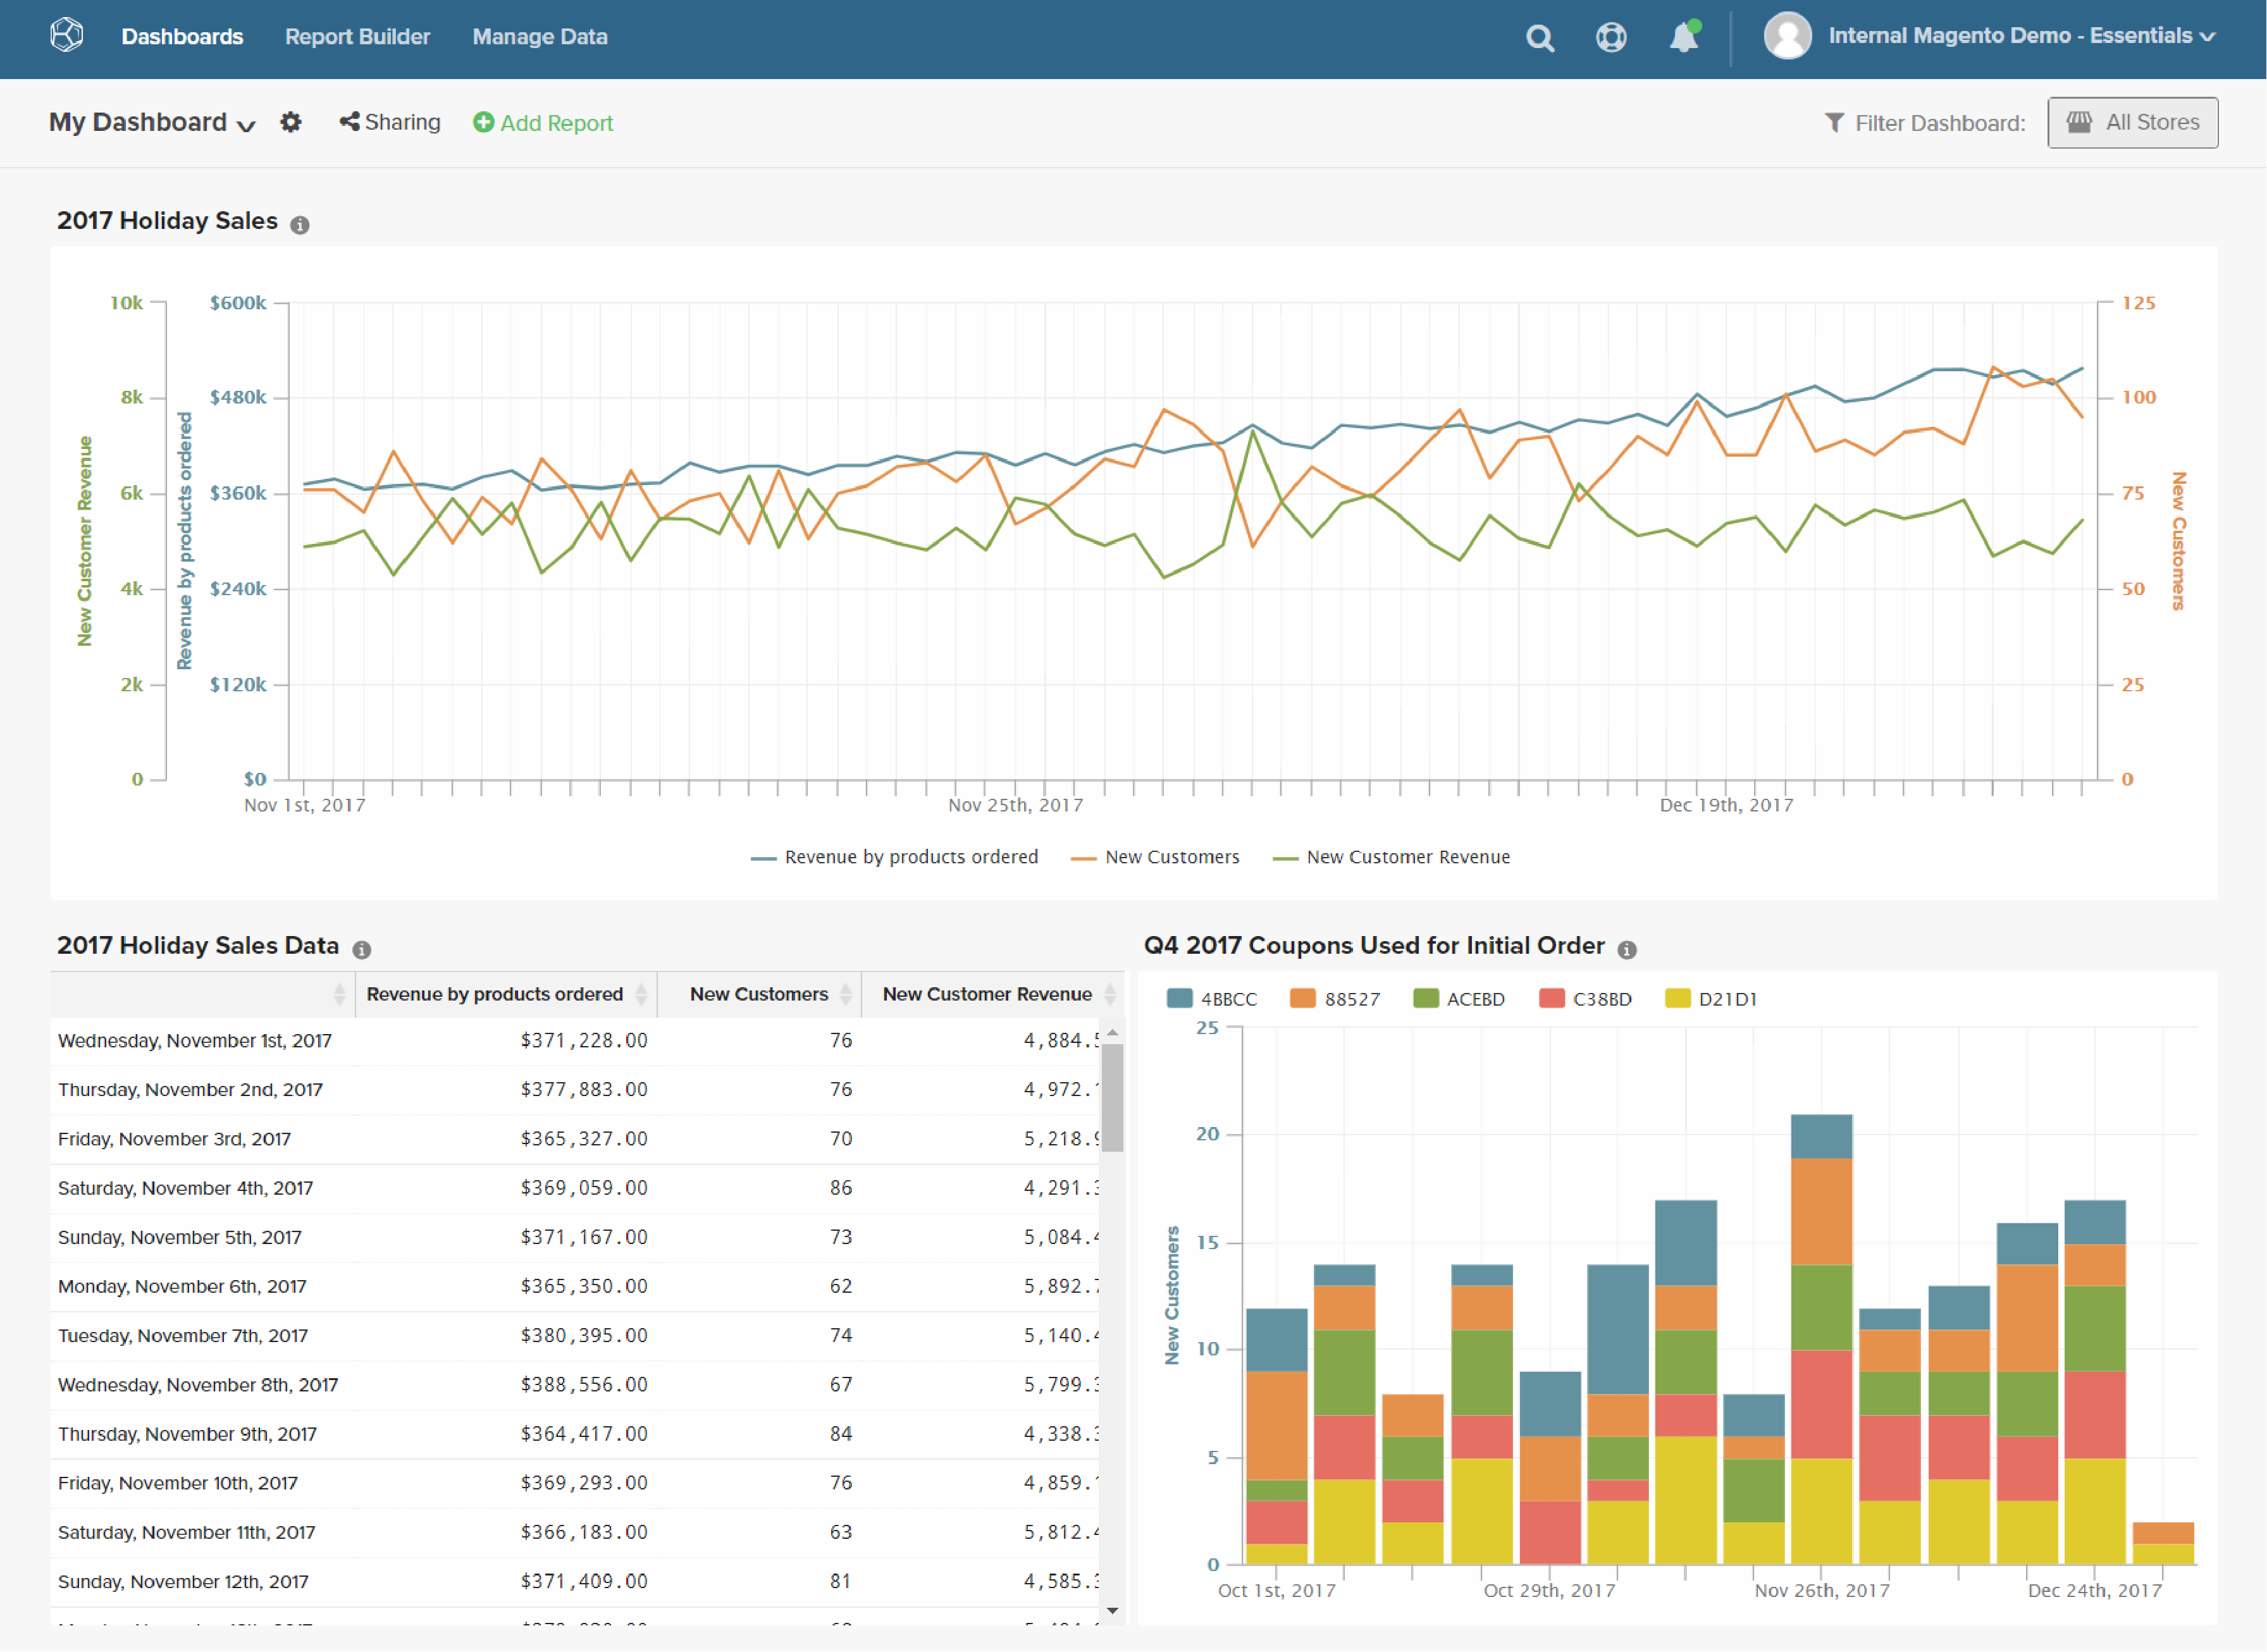
Magento Business Intelligence
Gain actionable insights into your eCommerce performance with the Magento Business Intelligence dashboard, designed for data-driven decision-making.
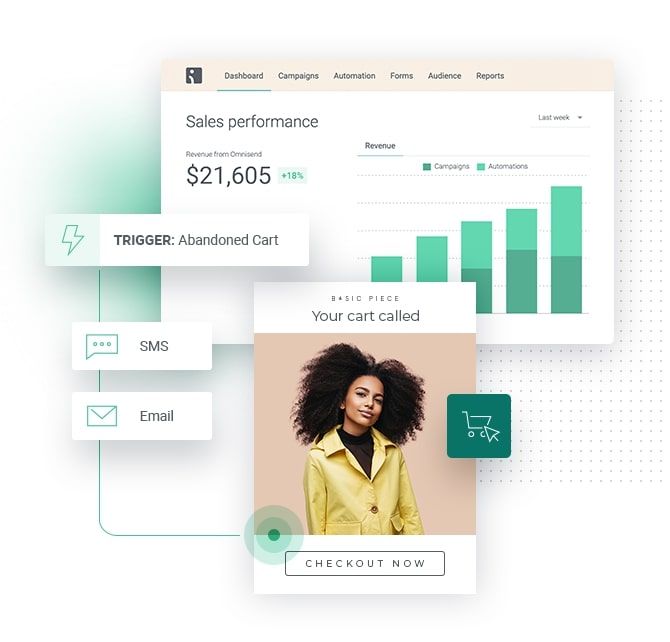
Omnisend
Monitor and optimize your email marketing campaigns with Omnisend's intuitive dashboard, offering real-time analytics and actionable insights.

Power BI for E-commerce
Gain insights into sales, customer behavior, and inventory with the Power BI for E-commerce dashboard, optimizing your online store's performance.

Privy
Privy dashboard offers comprehensive insights into user engagement, marketing performance, and conversion rates to optimize your business strategies.

Shopify Analytics
Gain insights into your store's performance with Shopify Analytics, offering real-time data, sales trends, and customer behavior analysis.

WooCommerce Analytics
Gain insights into your WooCommerce store's performance with detailed analytics on sales, customers, and products, all in one intuitive dashboard.

Yotpo Insights
Gain actionable insights into customer feedback and trends with Yotpo Insights, enhancing your brand's decision-making and growth strategies.

Blackboard Analytics
Gain insights into student performance, course engagement, and institutional effectiveness with the comprehensive Blackboard Analytics dashboard.

Brightspace Insights
Brightspace Insights dashboard provides real-time analytics on student engagement, course progress, and performance metrics for educators.

Canvas Analytics
Gain insights into student engagement and performance with Canvas Analytics, offering real-time data visualization and reporting tools.
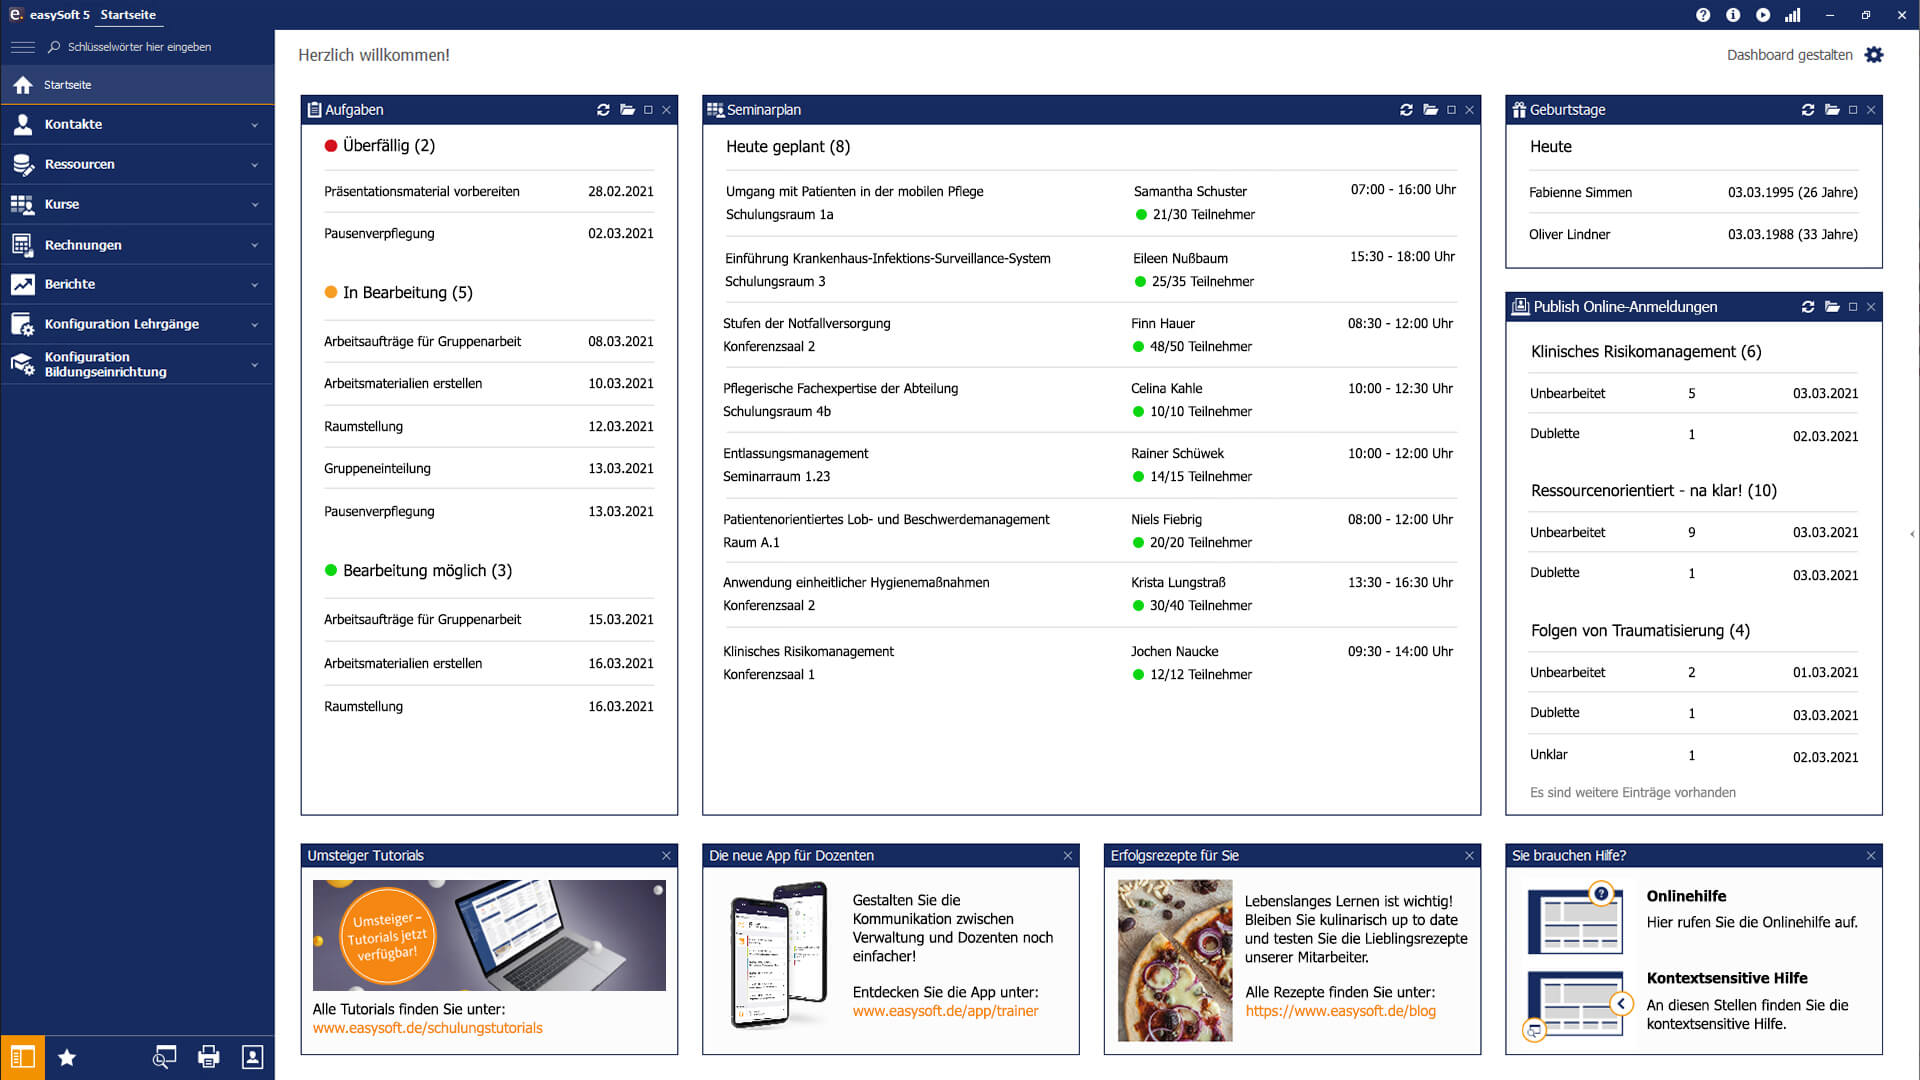
EesySoft
Monitor and enhance user engagement with EesySoft's intuitive dashboard, offering real-time insights and analytics for optimized educational experiences.

Kaltura Video Analytics
Gain insights into video performance and audience engagement with Kaltura Video Analytics, enhancing content strategy and viewer experience.

Moodle Analytics
Gain insights into student performance, course engagement, and learning outcomes with the comprehensive Moodle Analytics dashboard.

Power BI for Education
Transform educational data into actionable insights with Power BI for Education, optimizing student performance and institutional efficiency.
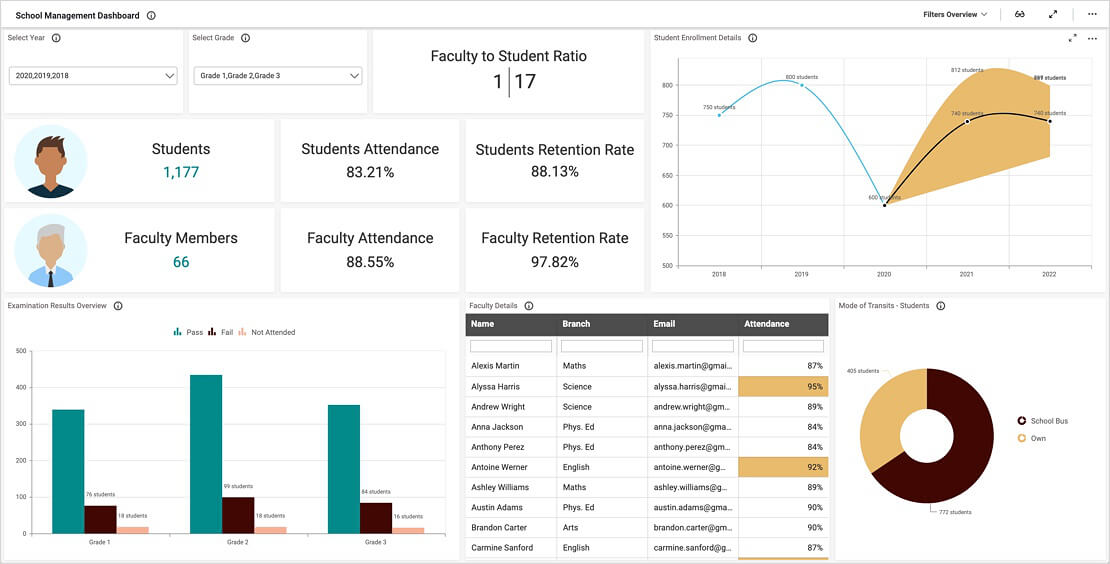
Tableau for Education
Visualize and analyze educational data effortlessly with the Tableau for Education dashboard, designed for educators and administrators.
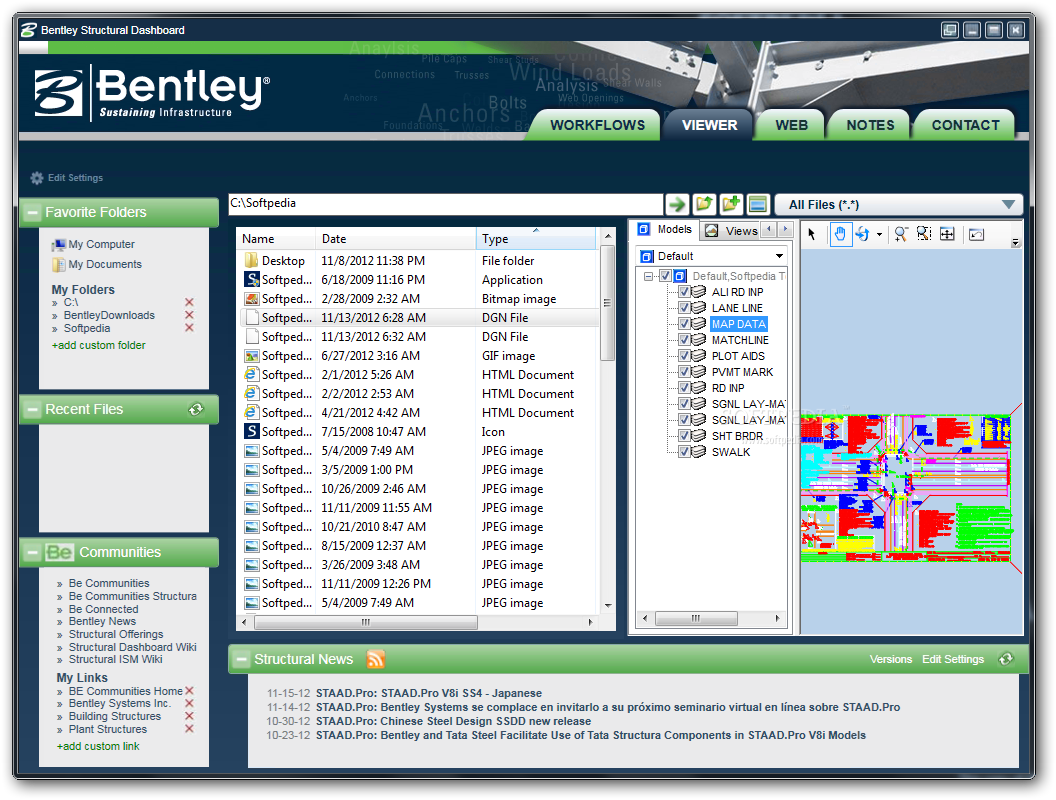
Bentley Systems
Explore Bentley Systems' dashboard for real-time infrastructure insights, project management, and data analytics to enhance engineering workflows.
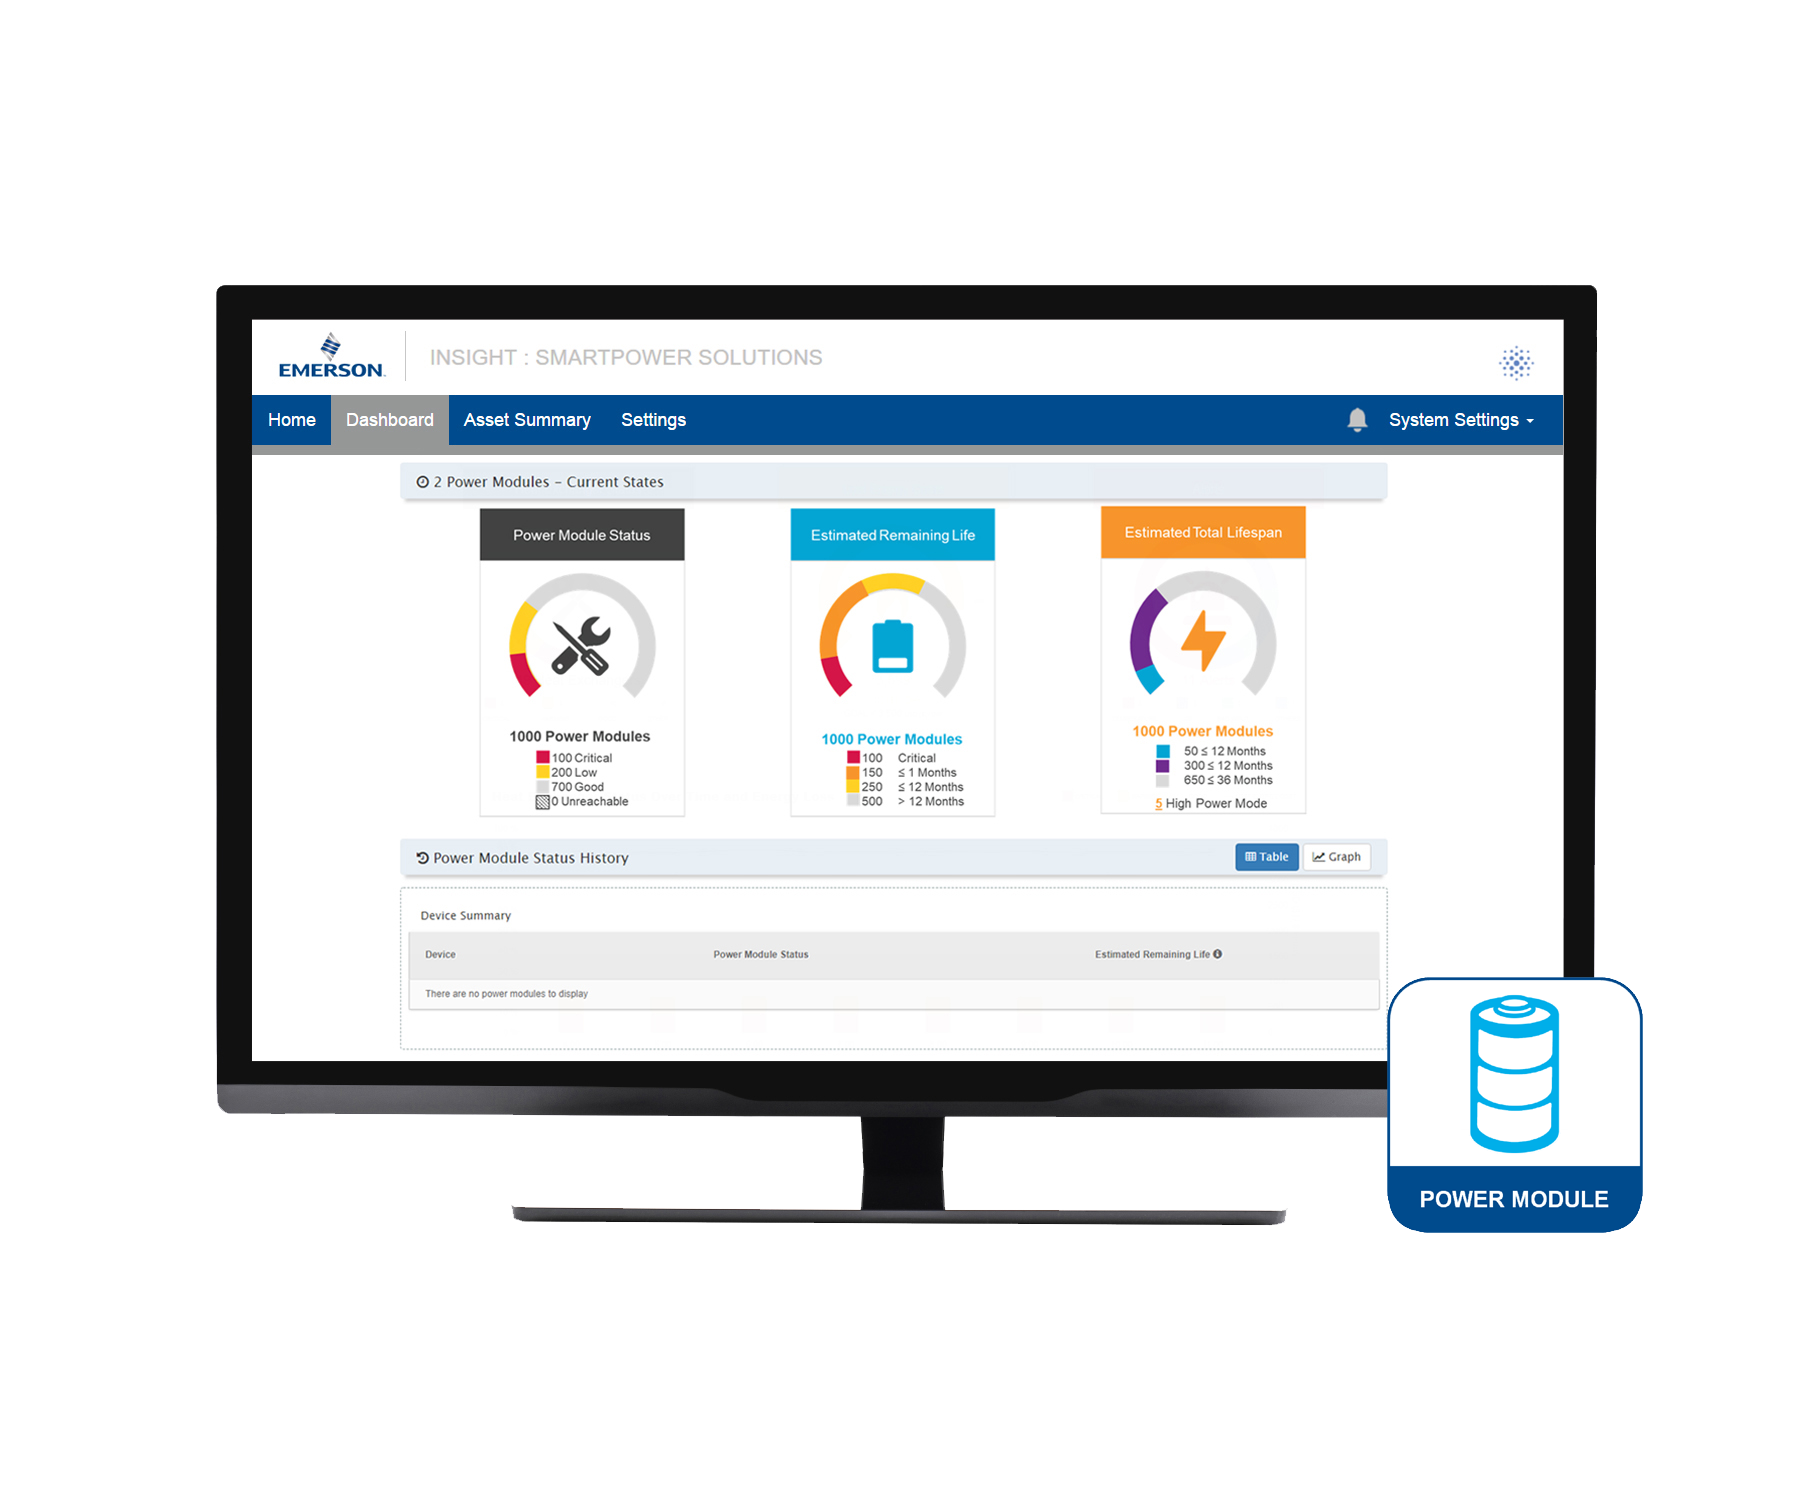
Emerson PlantWeb Optics
Monitor and optimize plant performance with Emerson PlantWeb Optics, providing real-time insights and predictive analytics for enhanced decision-making.

GE Digital (Predix)
Monitor and optimize industrial operations with real-time analytics and insights using the GE Digital (Predix) dashboard for enhanced decision-making.

IBM Maximo
The IBM Maximo dashboard offers a comprehensive view of asset management, streamlining operations and enhancing decision-making with real-time insights.
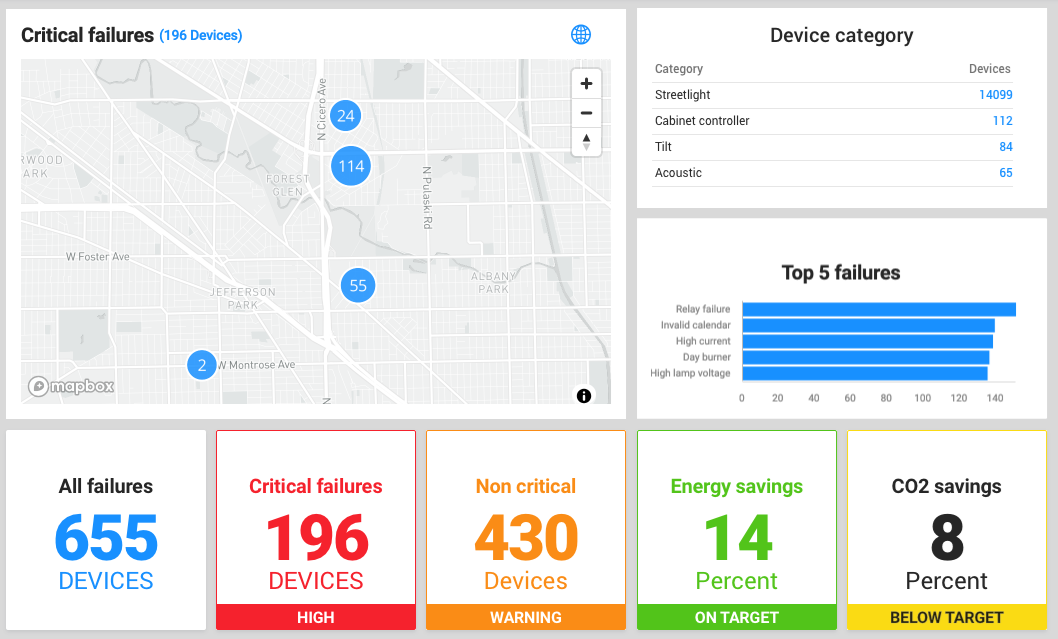
Itron Analytics
Gain actionable insights into energy consumption, optimize utility operations, and enhance customer engagement with the Itron Analytics dashboard.

Oracle Utilities Analytics
Gain insights into utility operations with Oracle Utilities Analytics, enhancing decision-making through comprehensive data visualization.

OSIsoft PI System
Monitor and analyze real-time operational data efficiently with the OSIsoft PI System dashboard, enhancing decision-making and performance insights.
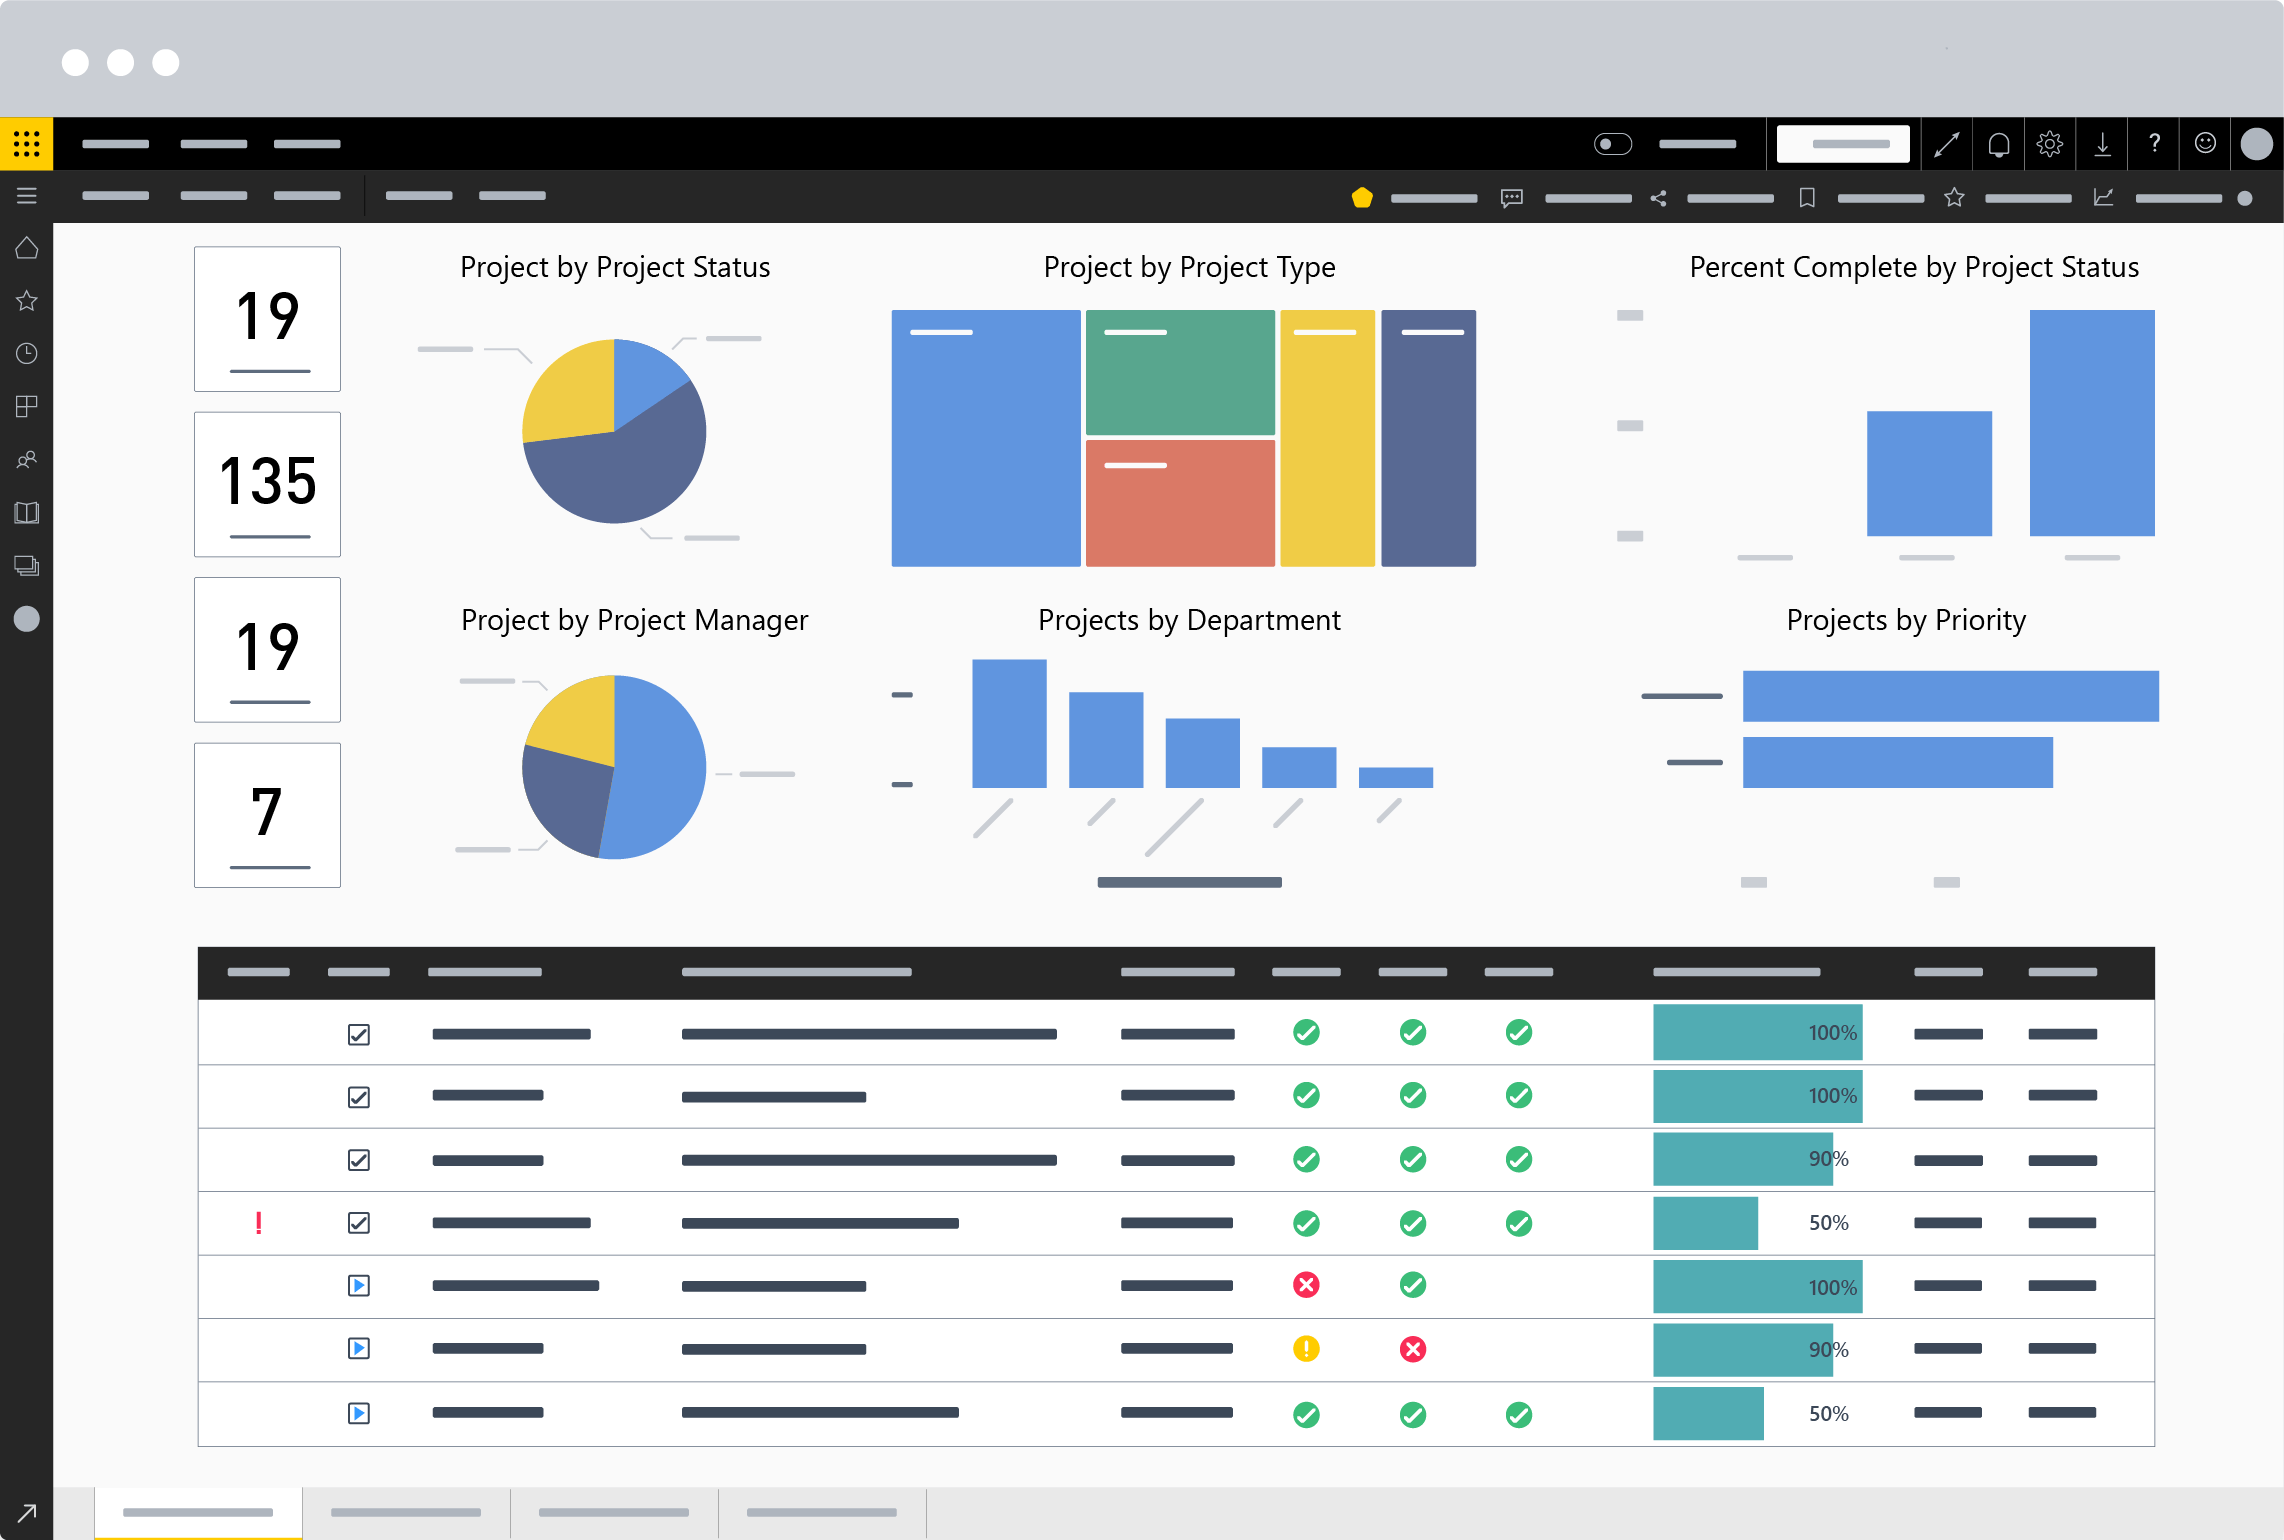
Power BI for Utilities
Gain insights into utility operations with Power BI, enabling data-driven decisions through real-time analytics and performance metrics.
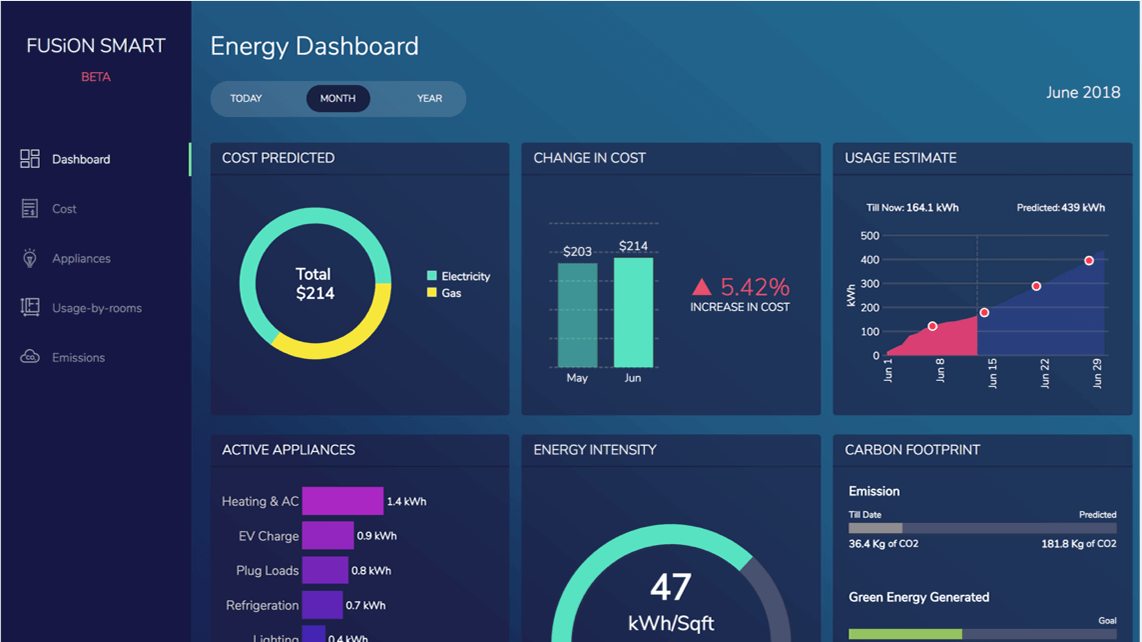
SAP Energy and Natural Resources
The SAP Energy and Natural Resources dashboard provides real-time insights and analytics to optimize operations and enhance decision-making efficiency.
Schneider Electric EcoStruxure
The Schneider Electric EcoStruxure dashboard provides real-time insights and analytics for efficient energy management and operational optimization.
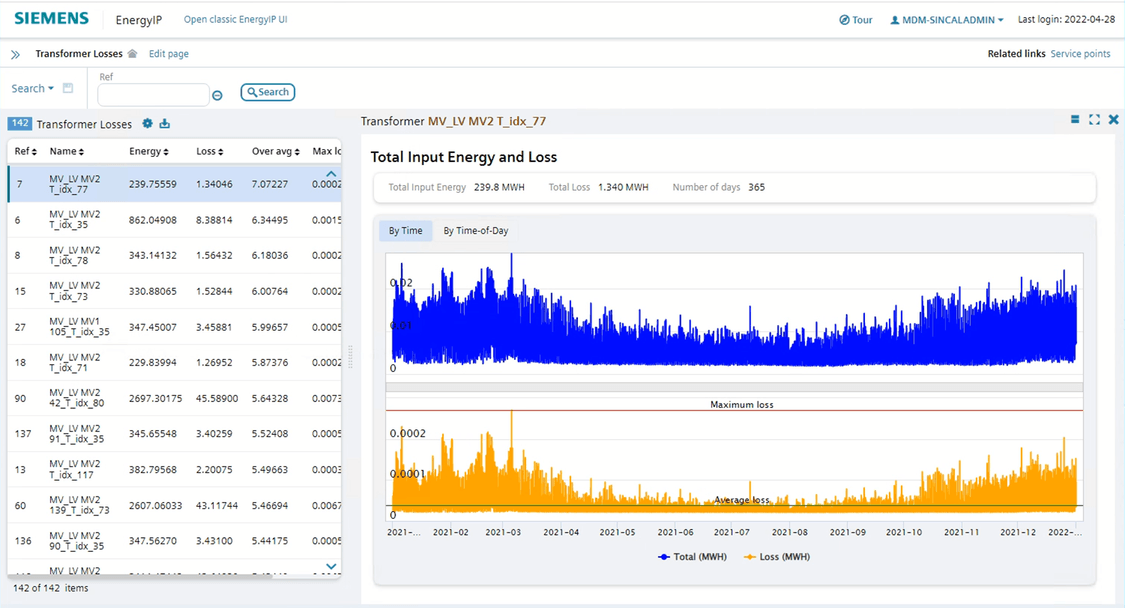
Siemens EnergyIP
The Siemens EnergyIP dashboard provides real-time analytics and insights for energy management, optimizing performance and enhancing operational efficiency.

Uplight
The Uplight dashboard provides comprehensive insights into energy usage, helping users optimize consumption and reduce costs effortlessly.
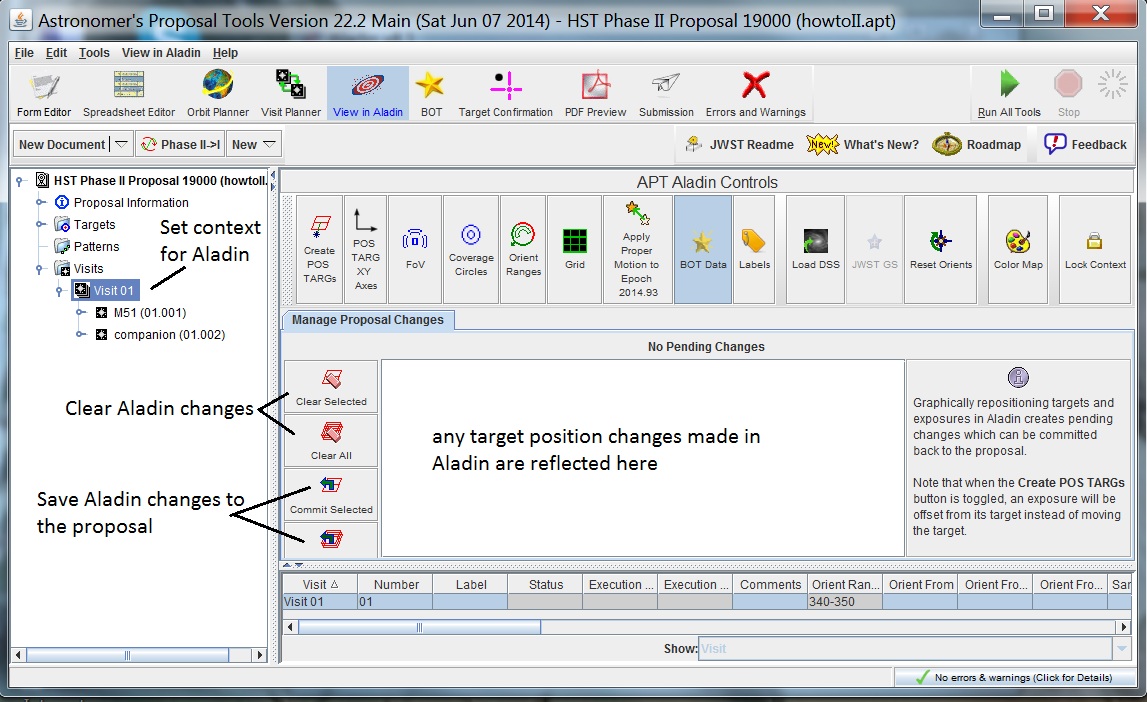
Aladdin by BlackRock
Aladdin by BlackRock dashboard offers comprehensive risk management, portfolio management, and trading tools for investment professionals.
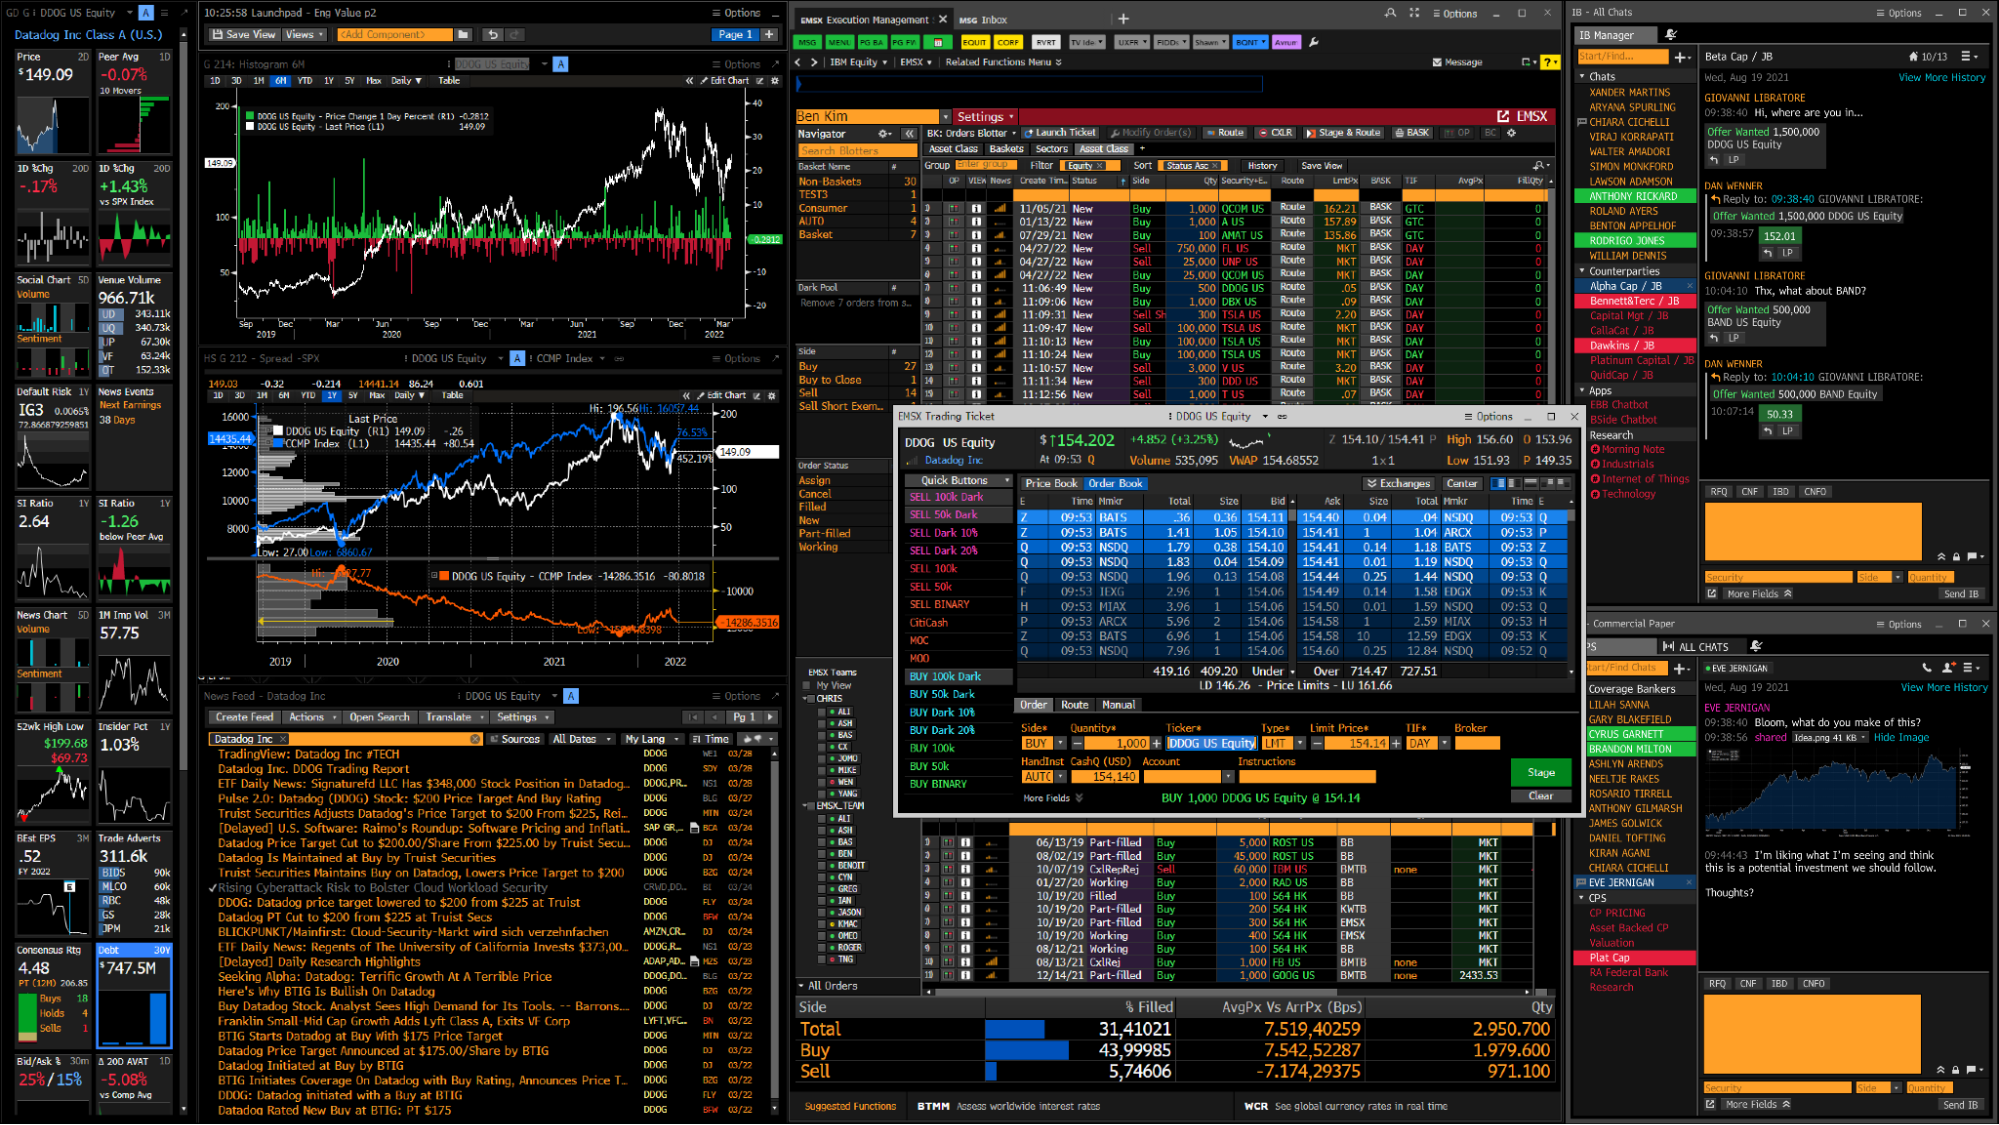
Bloomberg Terminal
Access real-time financial data, analytics, and trading tools with the Bloomberg Terminal dashboard, designed for informed investment decisions.
Envestnet Analytics
Gain insights into your financial data with Envestnet Analytics, offering comprehensive analysis and visualization tools for informed decision-making.
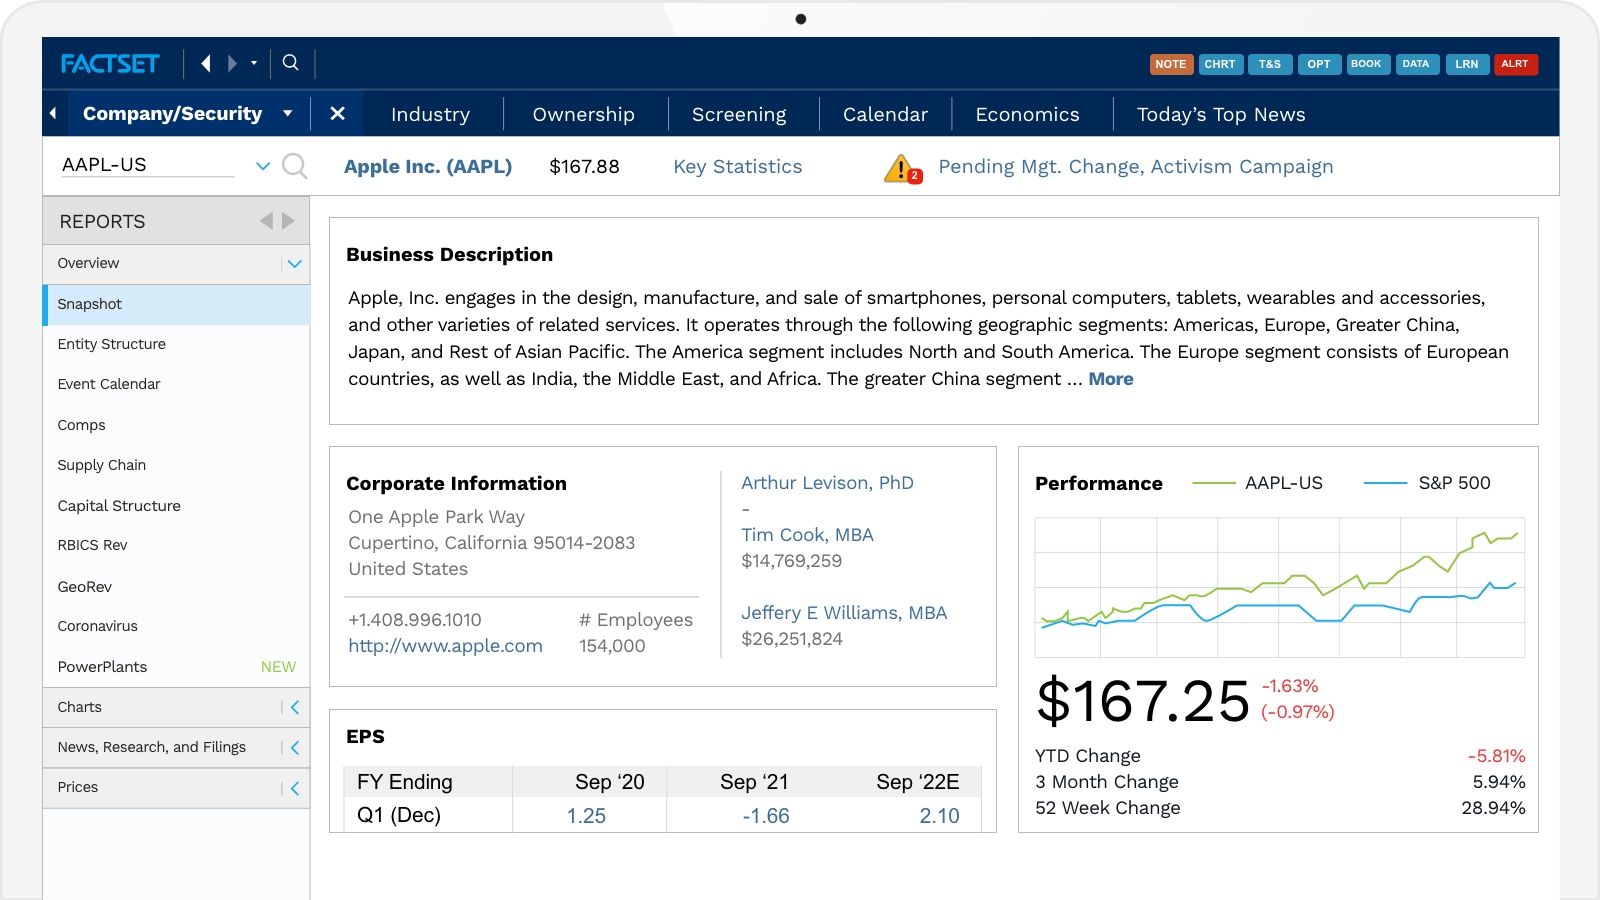
FactSet
Explore comprehensive financial data, analytics, and insights with FactSet's intuitive dashboard for informed decision-making and strategic planning.
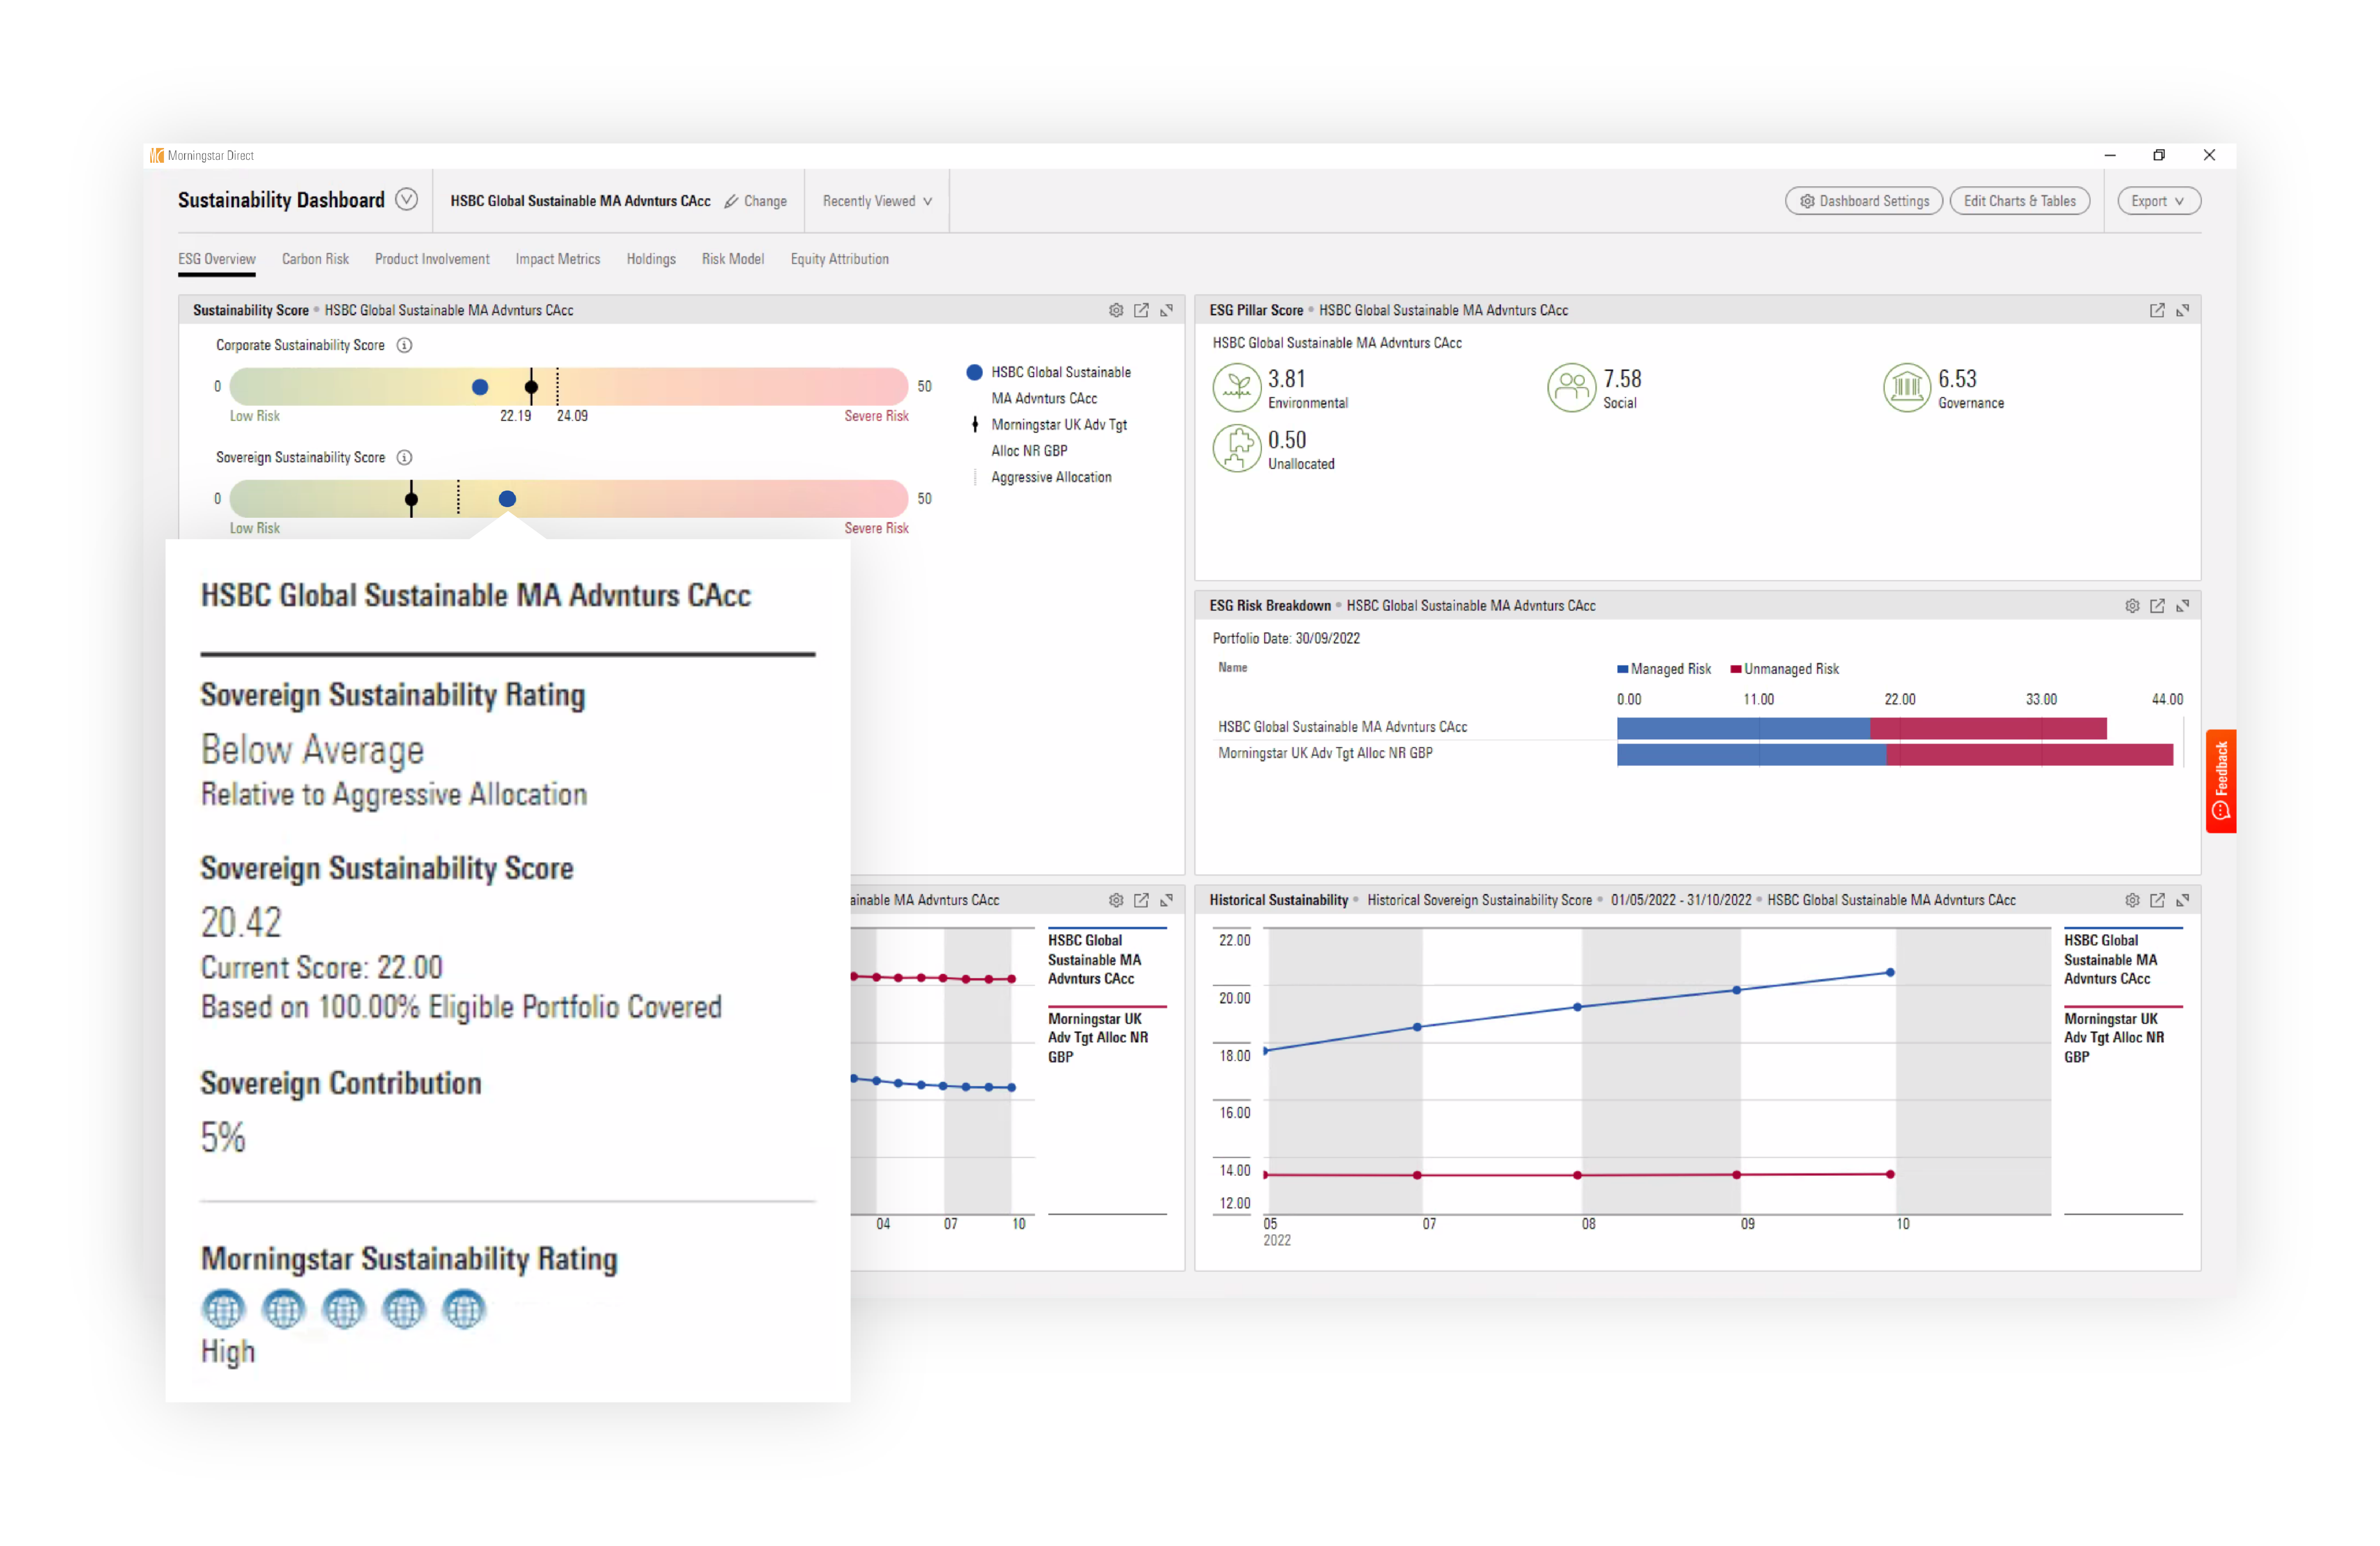
Morningstar Direct
Explore Morningstar Direct's comprehensive dashboard for detailed investment analysis, portfolio management, and market insights in one unified platform.
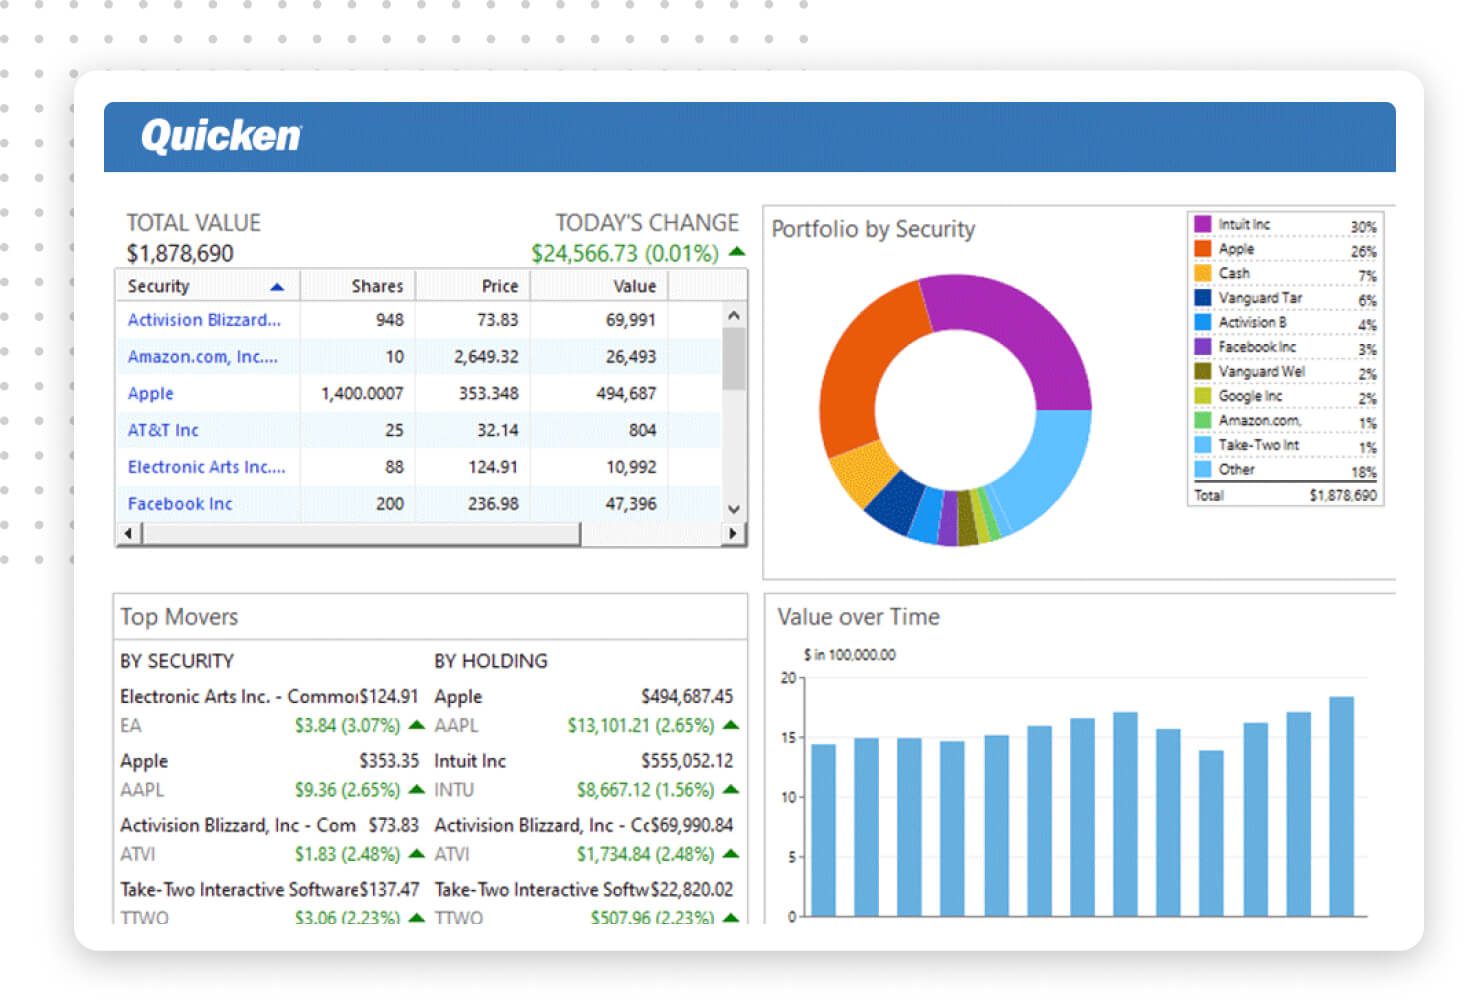
Quicken Analytics
Gain insights into your financial data with Quicken Analytics, offering real-time tracking, budget management, and personalized financial reports.

Refinitiv Eikon
Refinitiv Eikon dashboard provides real-time market data, news, analytics, and trading tools for financial professionals in a single platform.
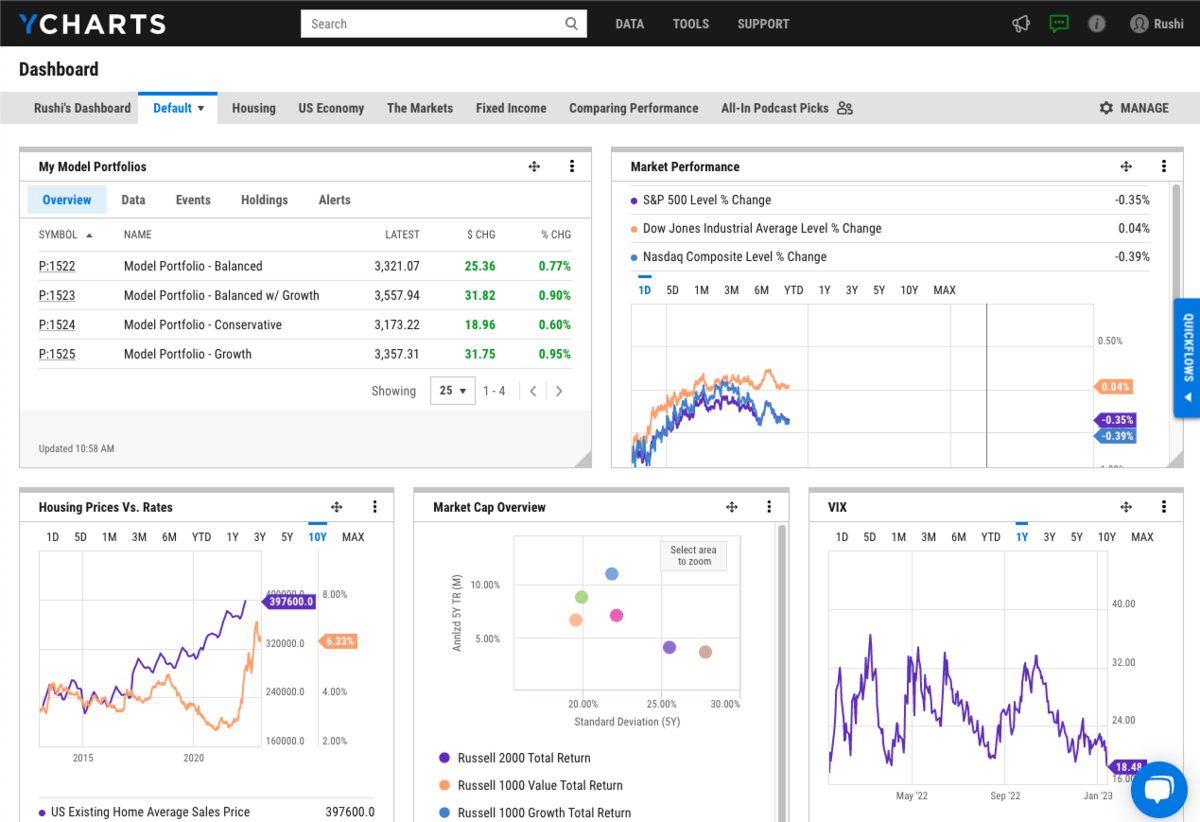
YCharts
The YCharts dashboard offers comprehensive financial data analysis, customizable charts, and real-time market insights for informed investment decisions.

Allscripts
The Allscripts dashboard provides comprehensive healthcare analytics, streamlining patient data management and enhancing clinical decision-making.

Arcadia Analytics
Arcadia Analytics dashboard offers real-time insights into business performance, enhancing decision-making with customizable data visualization tools.

Cerner HealtheIntent
Cerner HealtheIntent dashboard provides real-time analytics and insights to enhance population health management and care coordination.
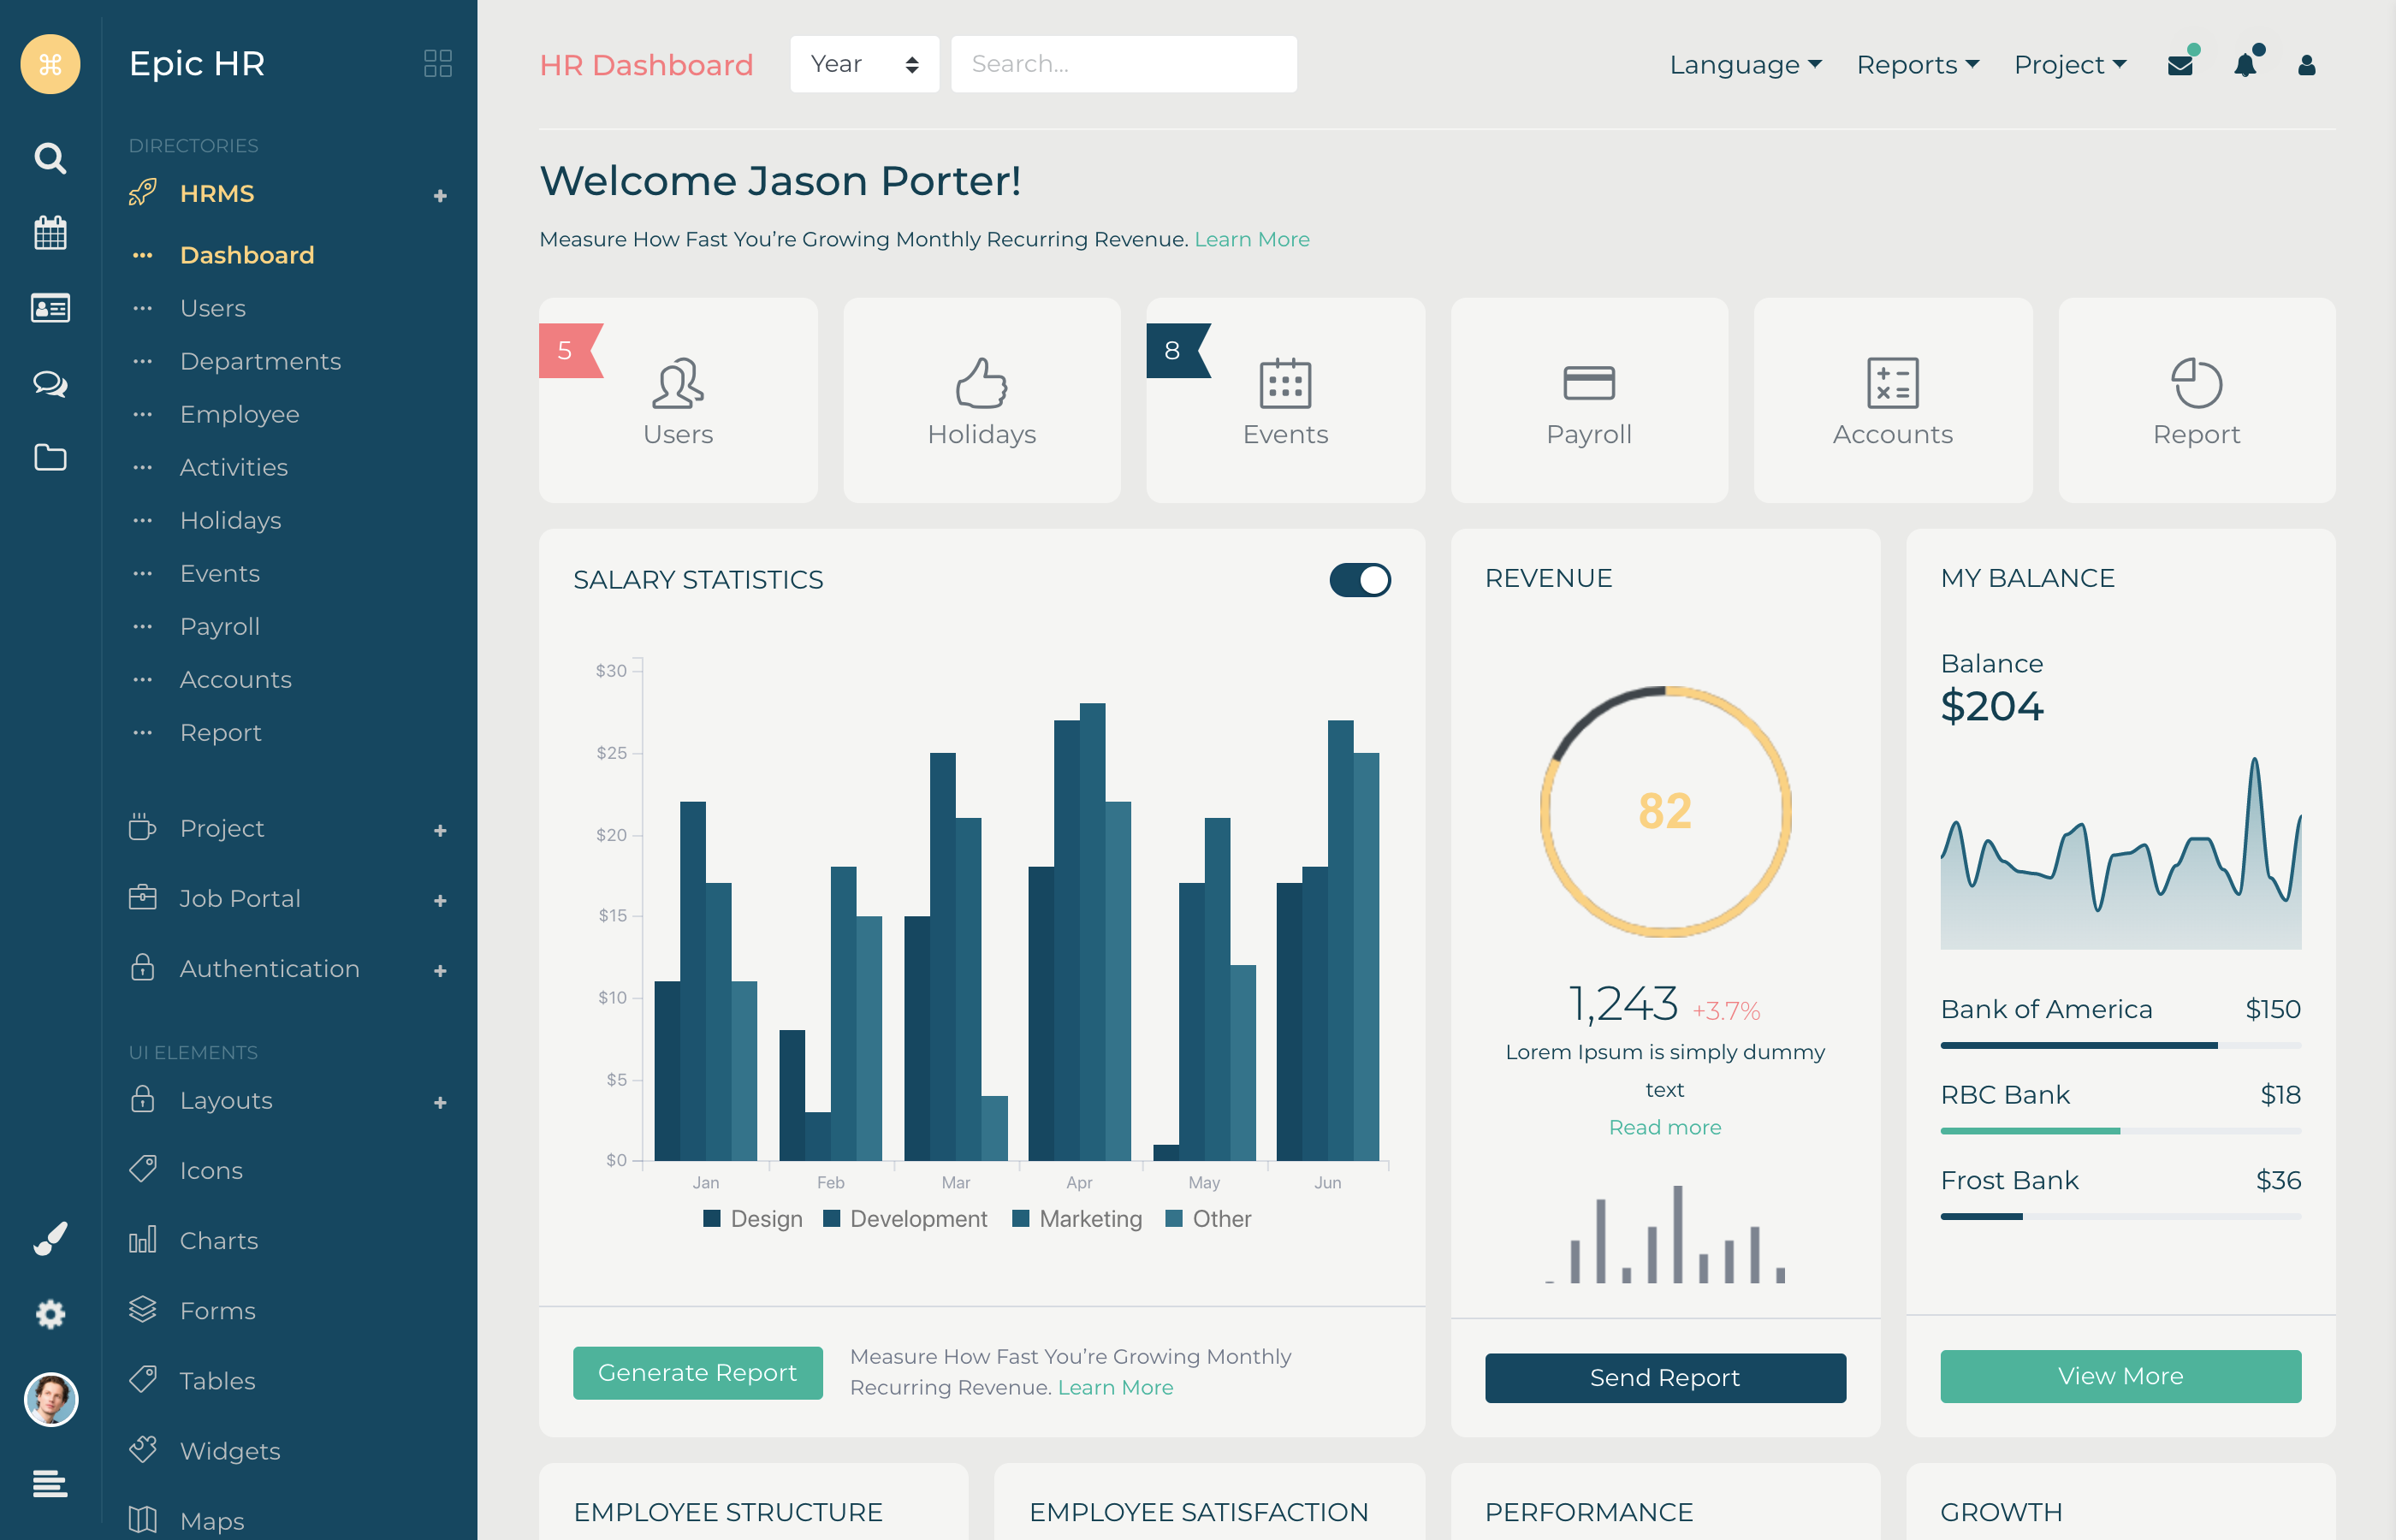
Epic Systems
Epic Systems' dashboard provides real-time healthcare data insights, enhancing patient care and operational efficiency for medical professionals.

Health Catalyst
The Health Catalyst dashboard provides comprehensive insights into healthcare data, enhancing decision-making and improving patient outcomes.

IBM Watson Health
Experience comprehensive healthcare insights and analytics with the IBM Watson Health dashboard, designed to enhance decision-making and patient outcomes.
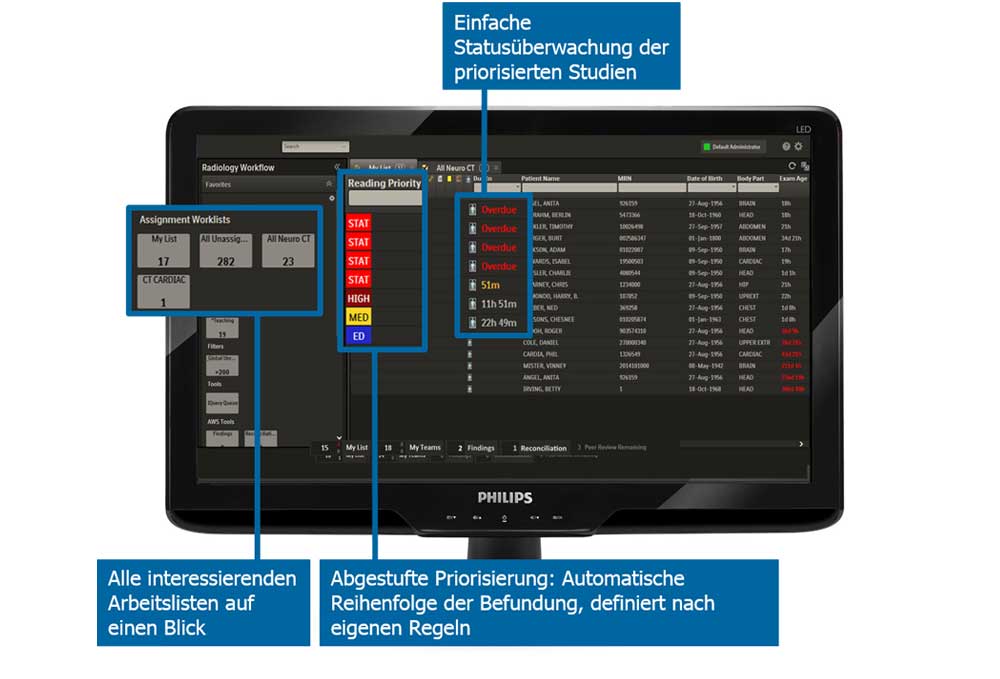
Philips IntelliSpace
Philips IntelliSpace dashboard offers seamless integration and real-time insights for healthcare professionals to enhance patient care and operational efficiency.

Qlik Healthcare Analytics
Gain real-time insights into patient care, operational efficiency, and financial performance with the Qlik Healthcare Analytics dashboard.

Tableau Healthcare
Gain insights into patient care, operational efficiency, and financial performance with the Tableau Healthcare dashboard for informed decision-making.

ALICE
The ALICE dashboard provides real-time analytics and insights into user engagement, helping businesses optimize their digital strategies effectively.
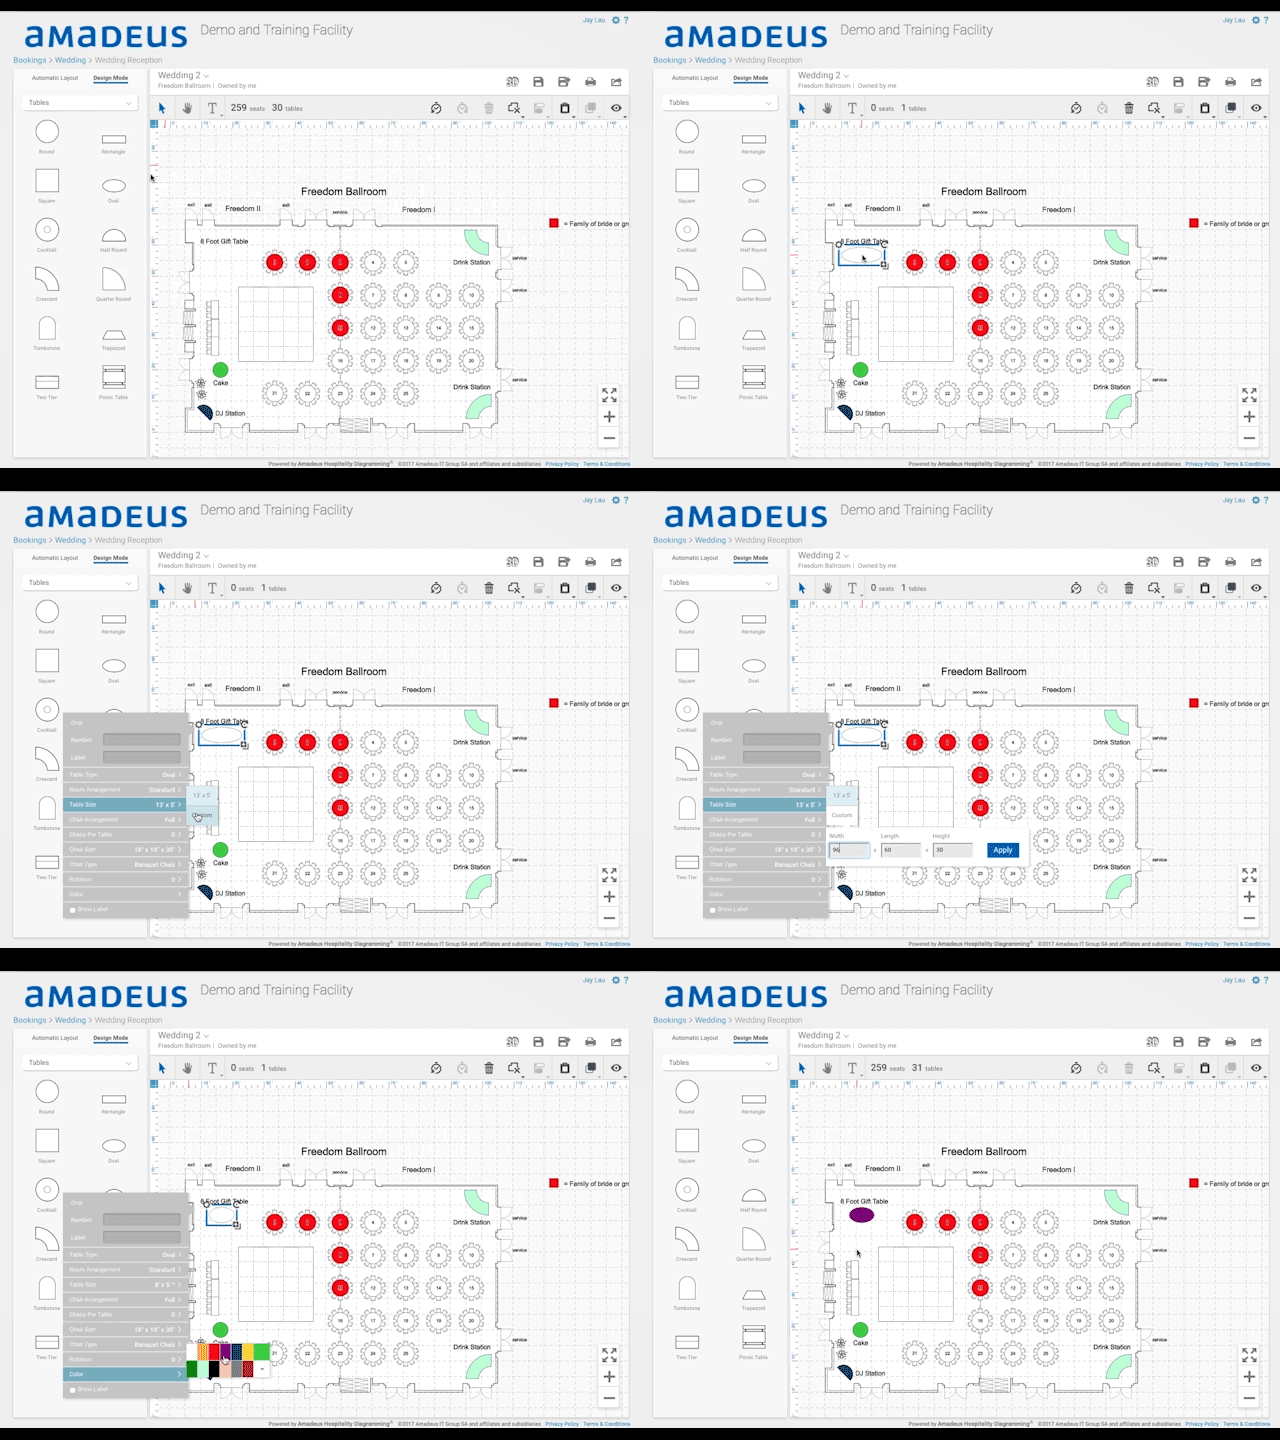
Amadeus Hospitality
Amadeus Hospitality dashboard offers real-time insights and analytics to optimize hotel operations, enhance guest experience, and drive revenue growth.
Duetto
Duetto's dashboard offers real-time insights into revenue management, optimizing pricing strategies for hotels to maximize profitability and efficiency.
HotStats
Analyze real-time performance metrics and financial data with HotStats, delivering insights to optimize operational efficiency and profitability.

Mews Analytics
Mews Analytics dashboard provides real-time insights into hospitality operations, enhancing decision-making with comprehensive data visualization tools.
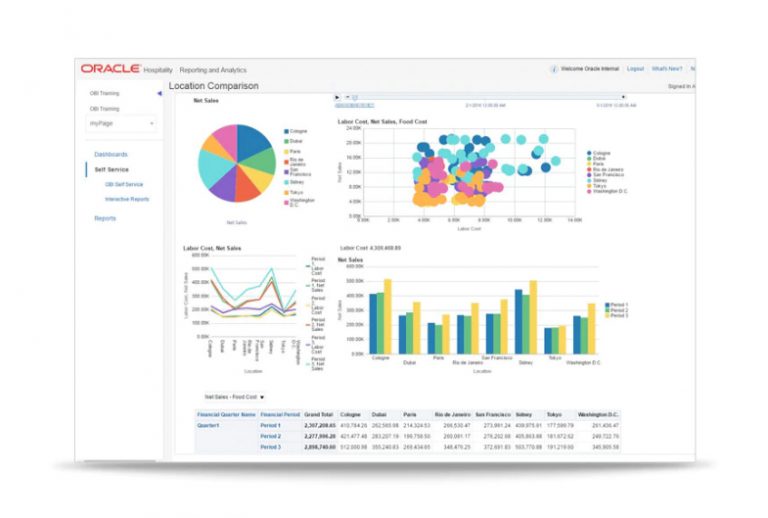
Oracle Hospitality
Streamline operations and enhance guest experiences with the Oracle Hospitality dashboard, offering real-time insights and analytics for the hospitality industry.
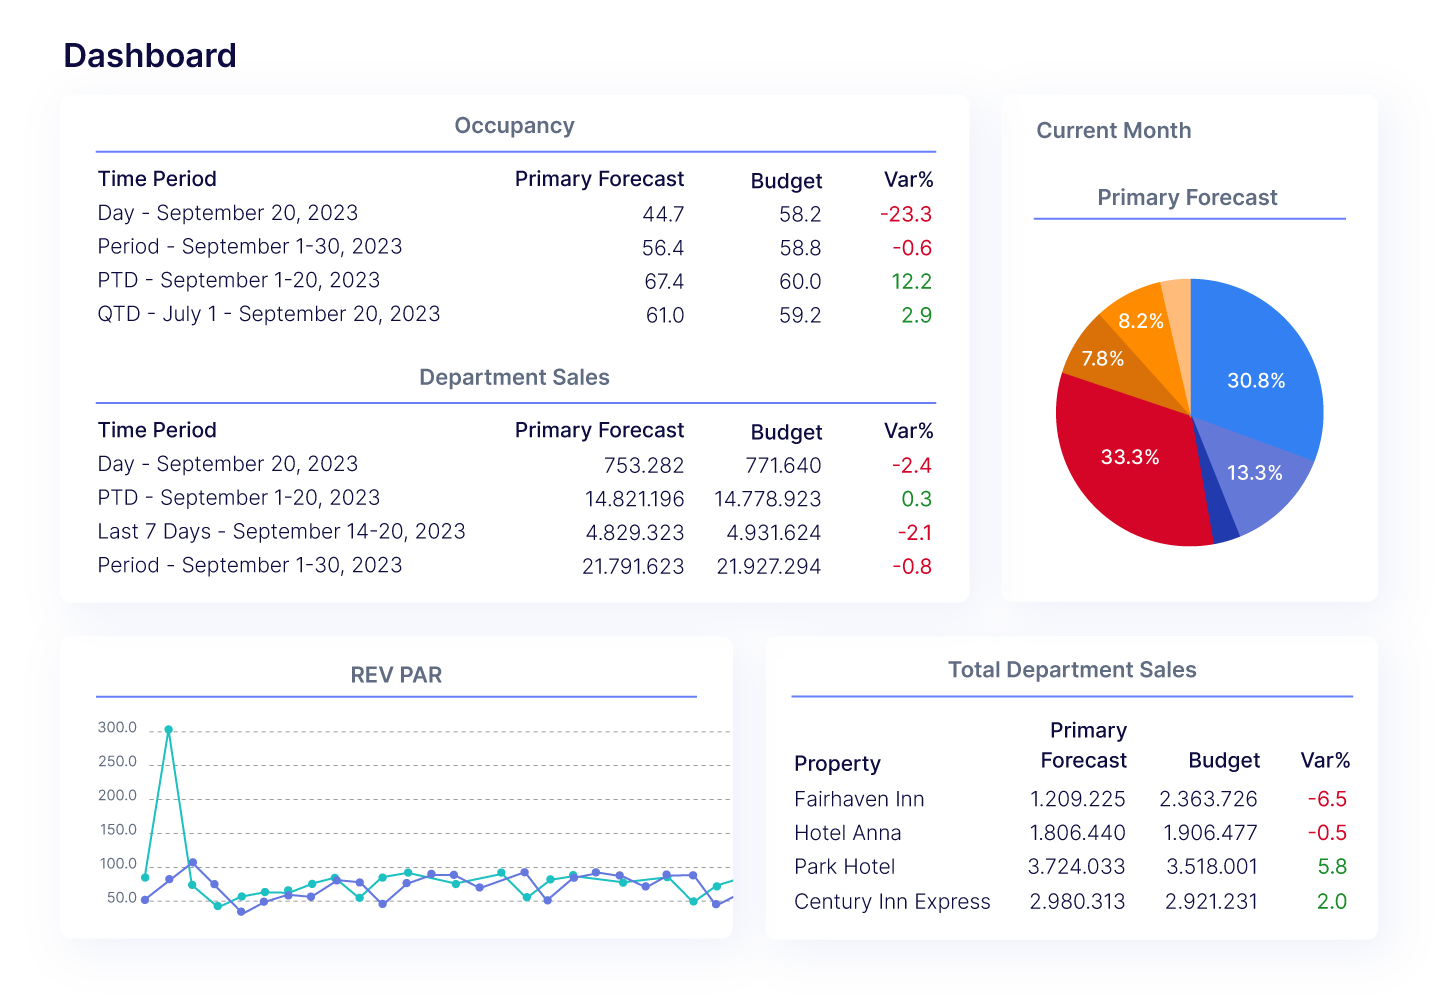
ProfitSword
Gain insights into financial performance with ProfitSword's dashboard, offering real-time data analytics and intuitive visualization tools.
Revinate
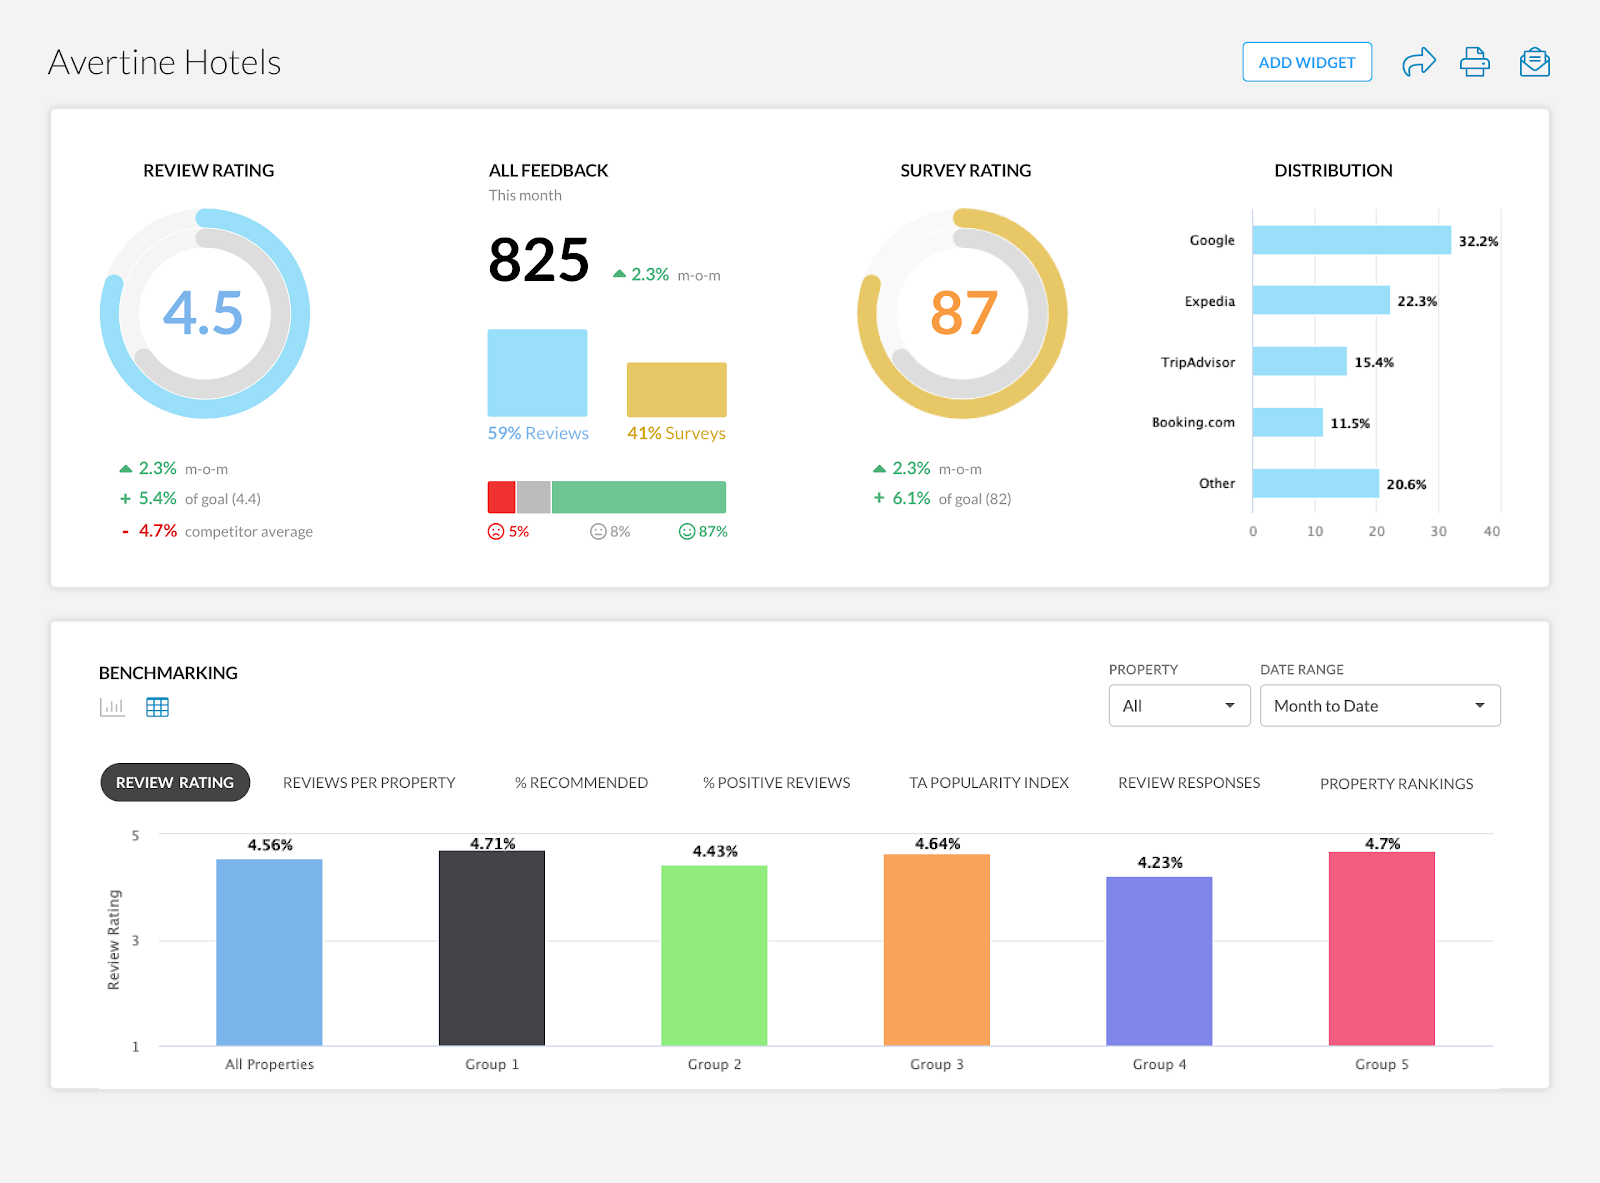
Revinate's dashboard offers real-time insights and analytics to enhance guest experiences and streamline hotel operations efficiently.
RoomKeyPMS Analytics
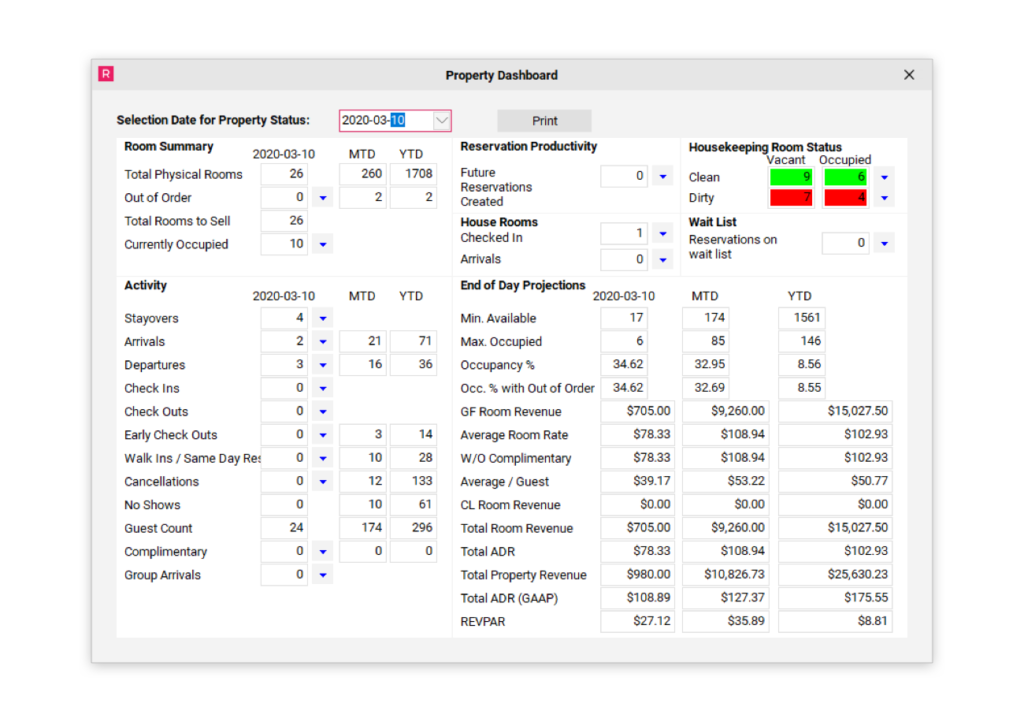
Gain insights into your hotel's performance with RoomKeyPMS Analytics, featuring real-time data, occupancy trends, and revenue metrics in one place.

STR Global
Explore global hotel performance metrics with STR Global's dashboard, offering insights into occupancy, ADR, and RevPAR for strategic decision-making.
ADP Workforce Now
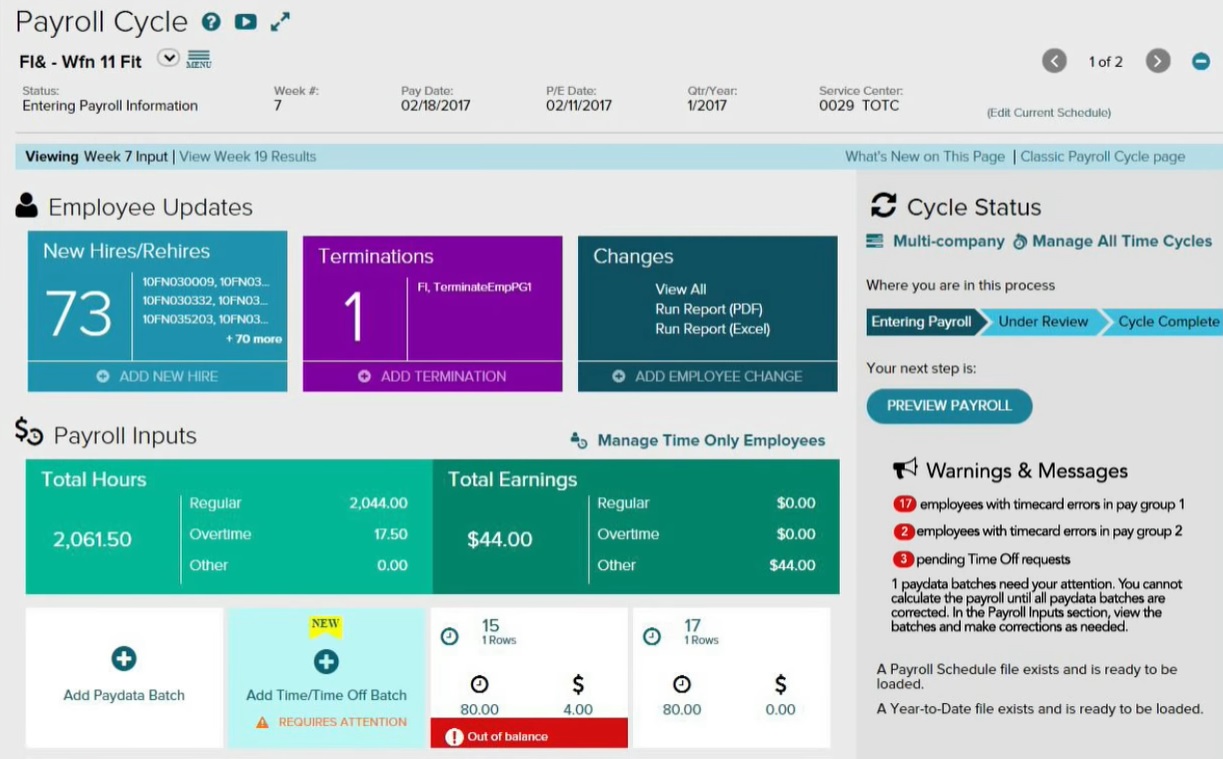
The ADP Workforce Now dashboard provides comprehensive HR management tools, offering real-time insights into employee data and payroll processing.
BambooHR
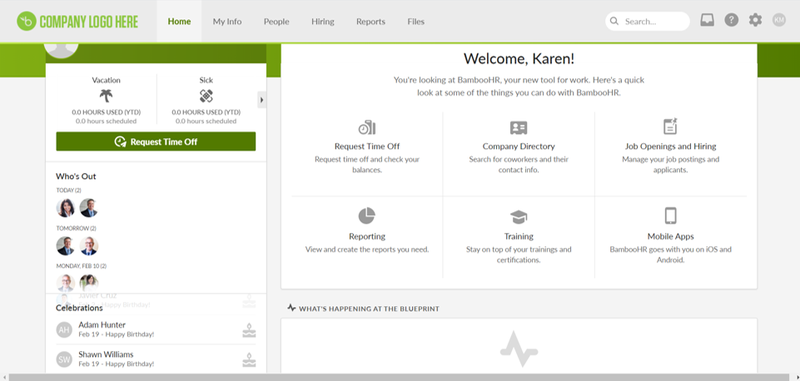
The BambooHR dashboard offers a comprehensive view of employee data, streamlining HR tasks with intuitive analytics and real-time insights.

Gusto
Gusto's dashboard offers a comprehensive view of payroll, benefits, and HR management, streamlining business operations in an intuitive interface.
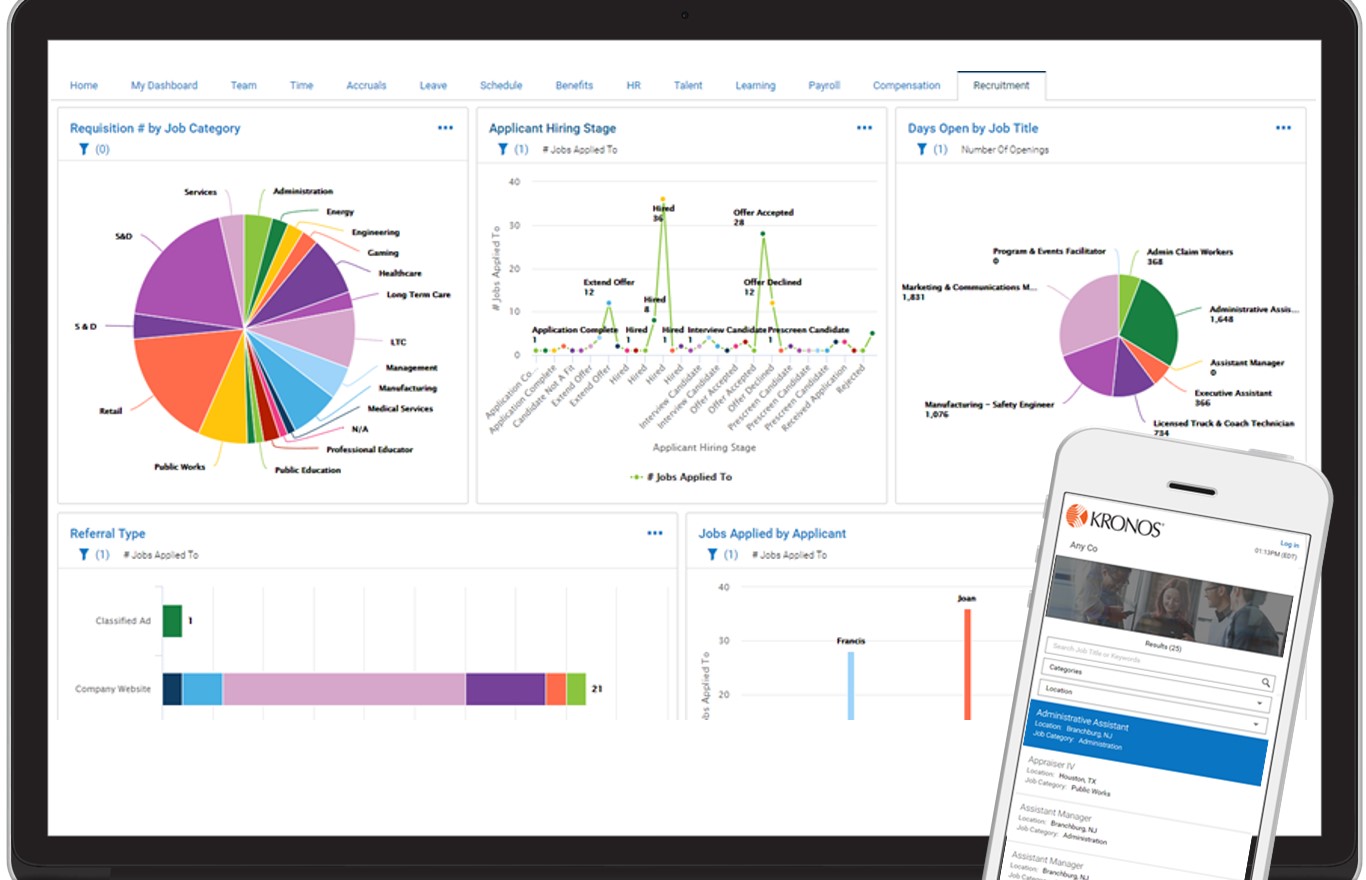
Kronos Workforce Ready
Effortlessly manage your workforce with Kronos Workforce Ready's intuitive dashboard, offering real-time insights and streamlined HR processes.

Lattice
Lattice dashboard offers a comprehensive view of employee performance, engagement, and growth, enabling data-driven decisions for better team management.
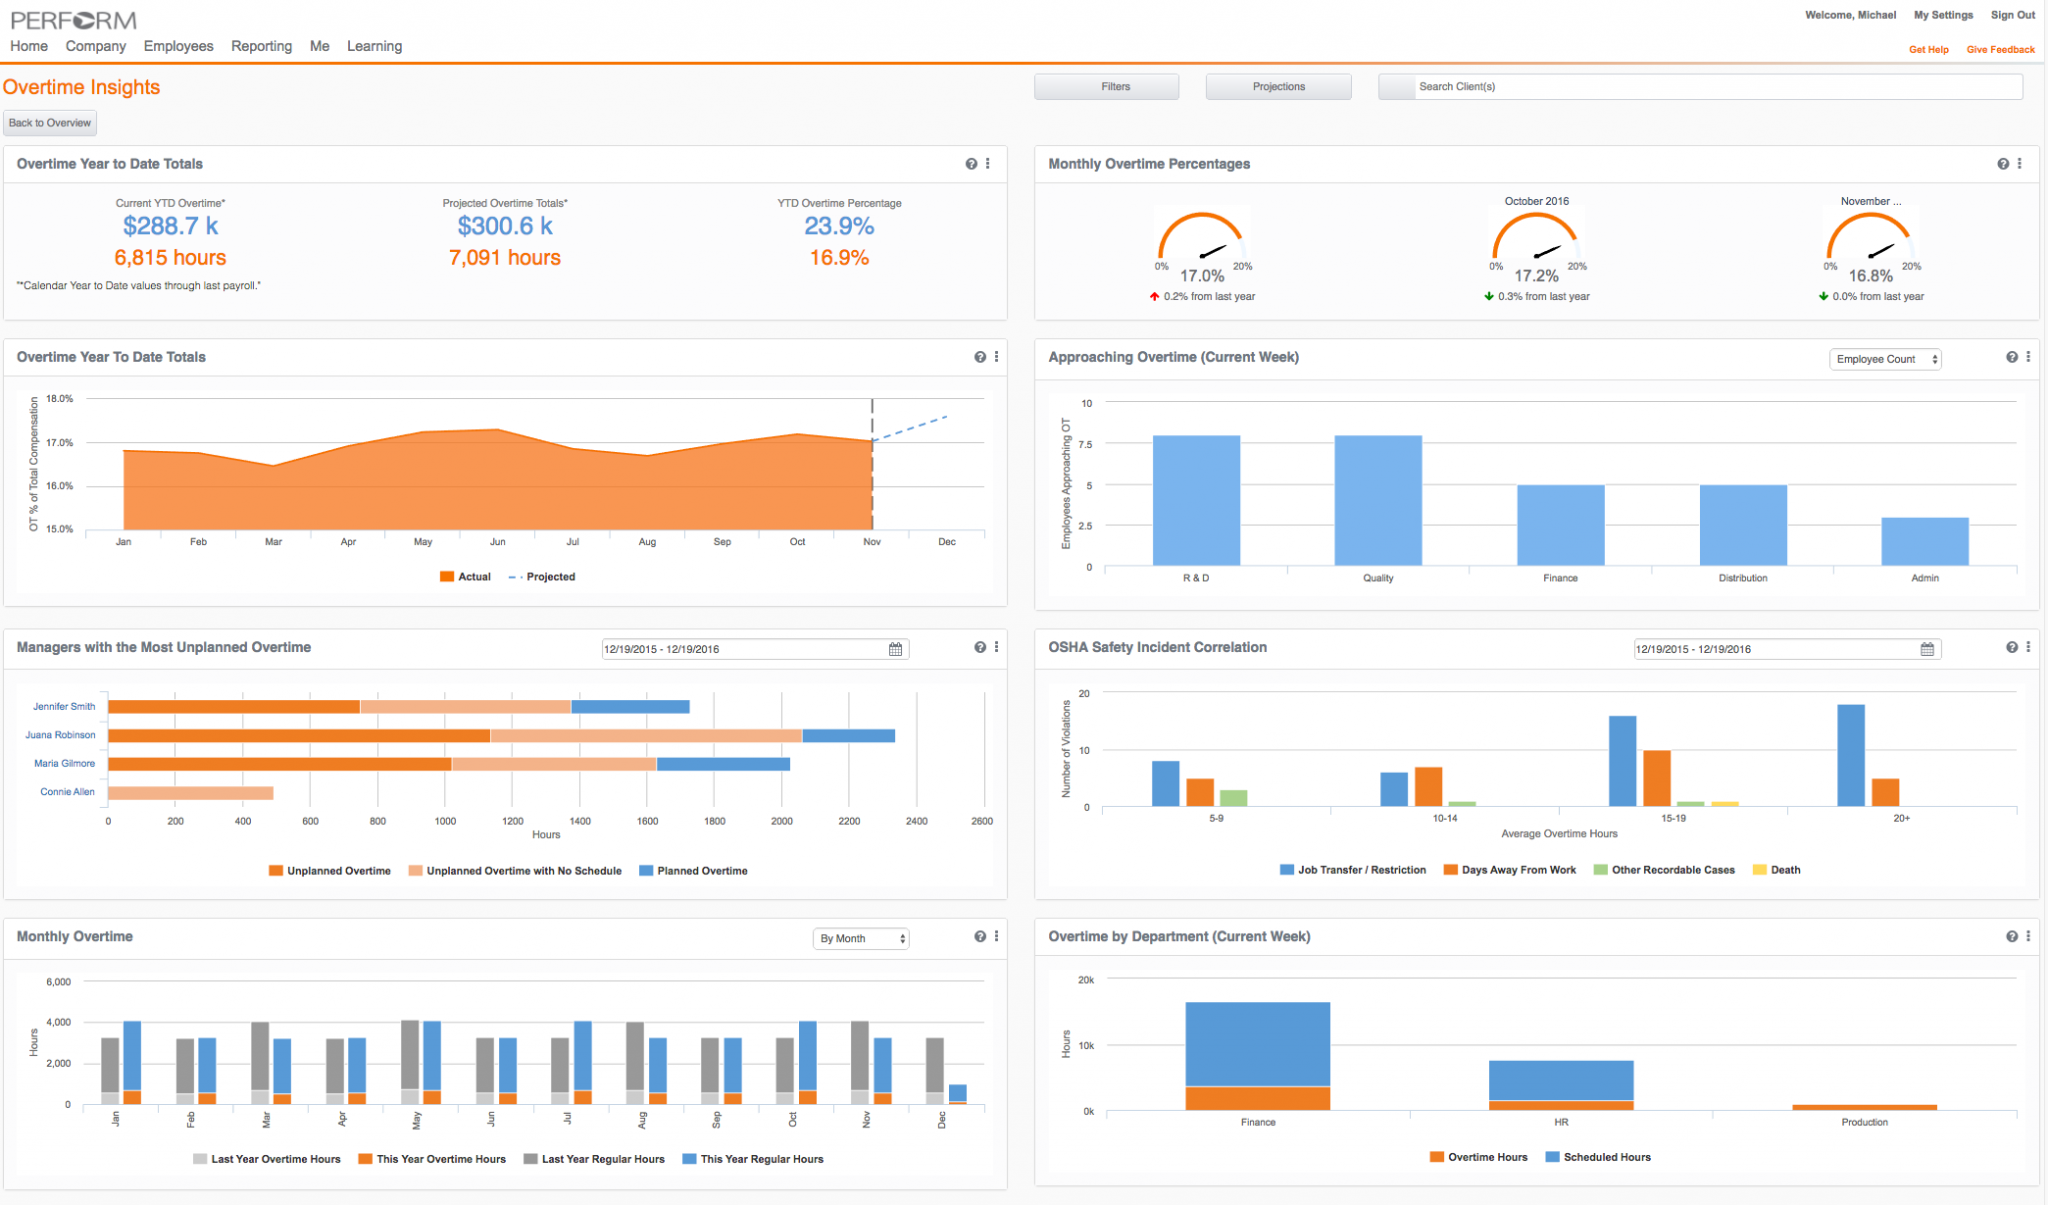
Paycor
Streamline HR and payroll processes with Paycor's intuitive dashboard, offering real-time insights and seamless management for enhanced productivity.
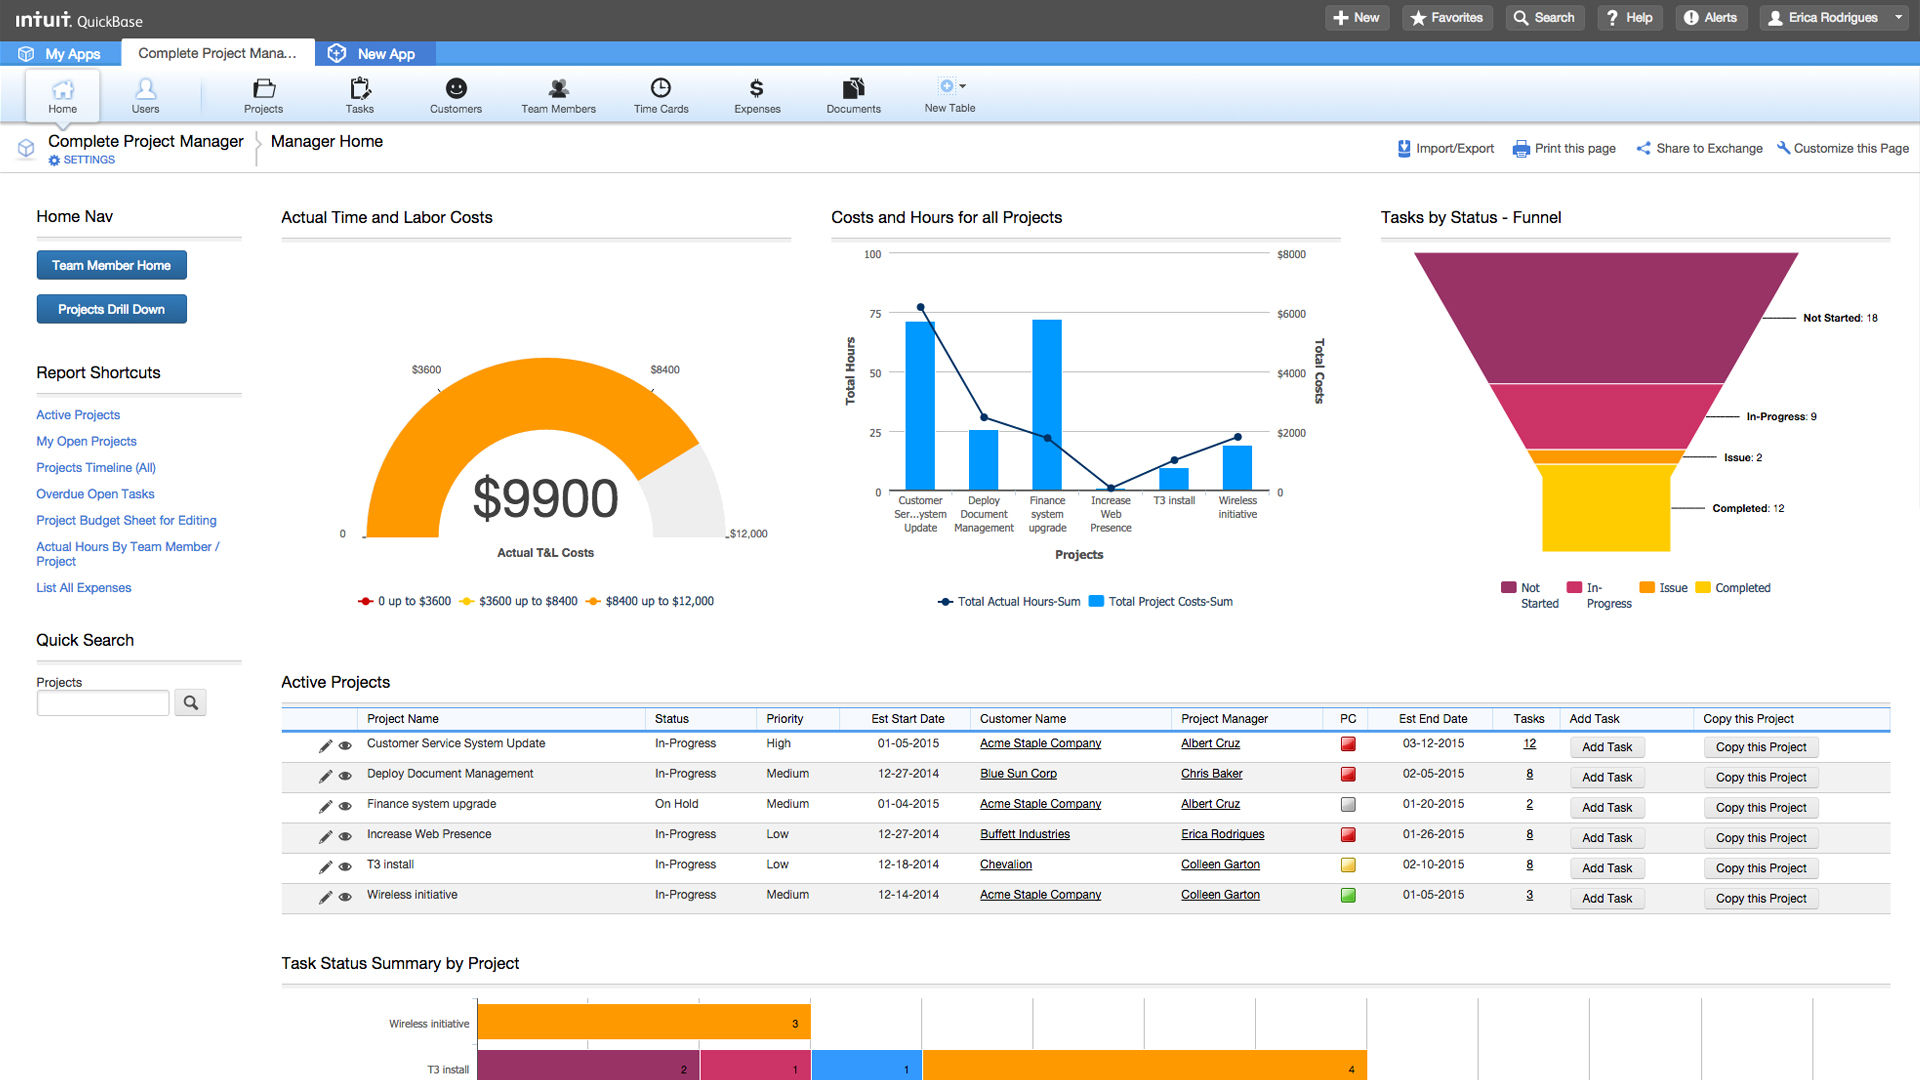
Quick Base
Monitor, analyze, and optimize your workflows with the Quick Base dashboard, offering real-time insights and customizable reports for enhanced productivity.
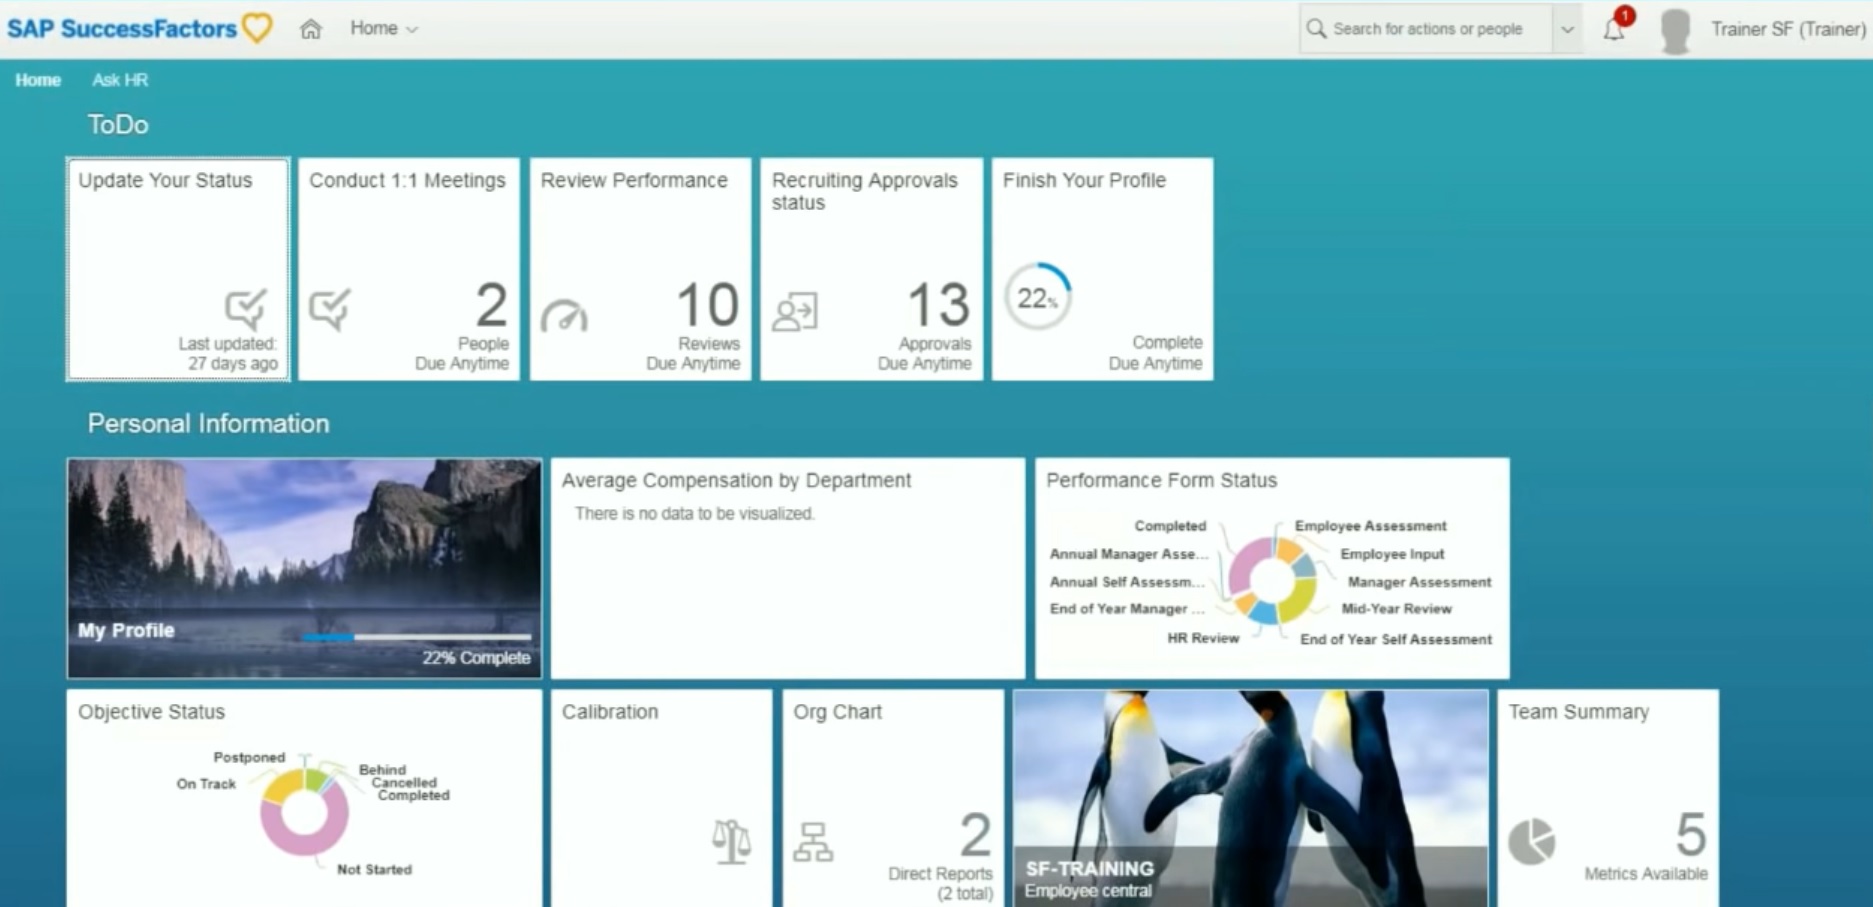
SAP SuccessFactors
Gain insights into employee performance, recruitment, and HR analytics with the SAP SuccessFactors dashboard for streamlined workforce management.
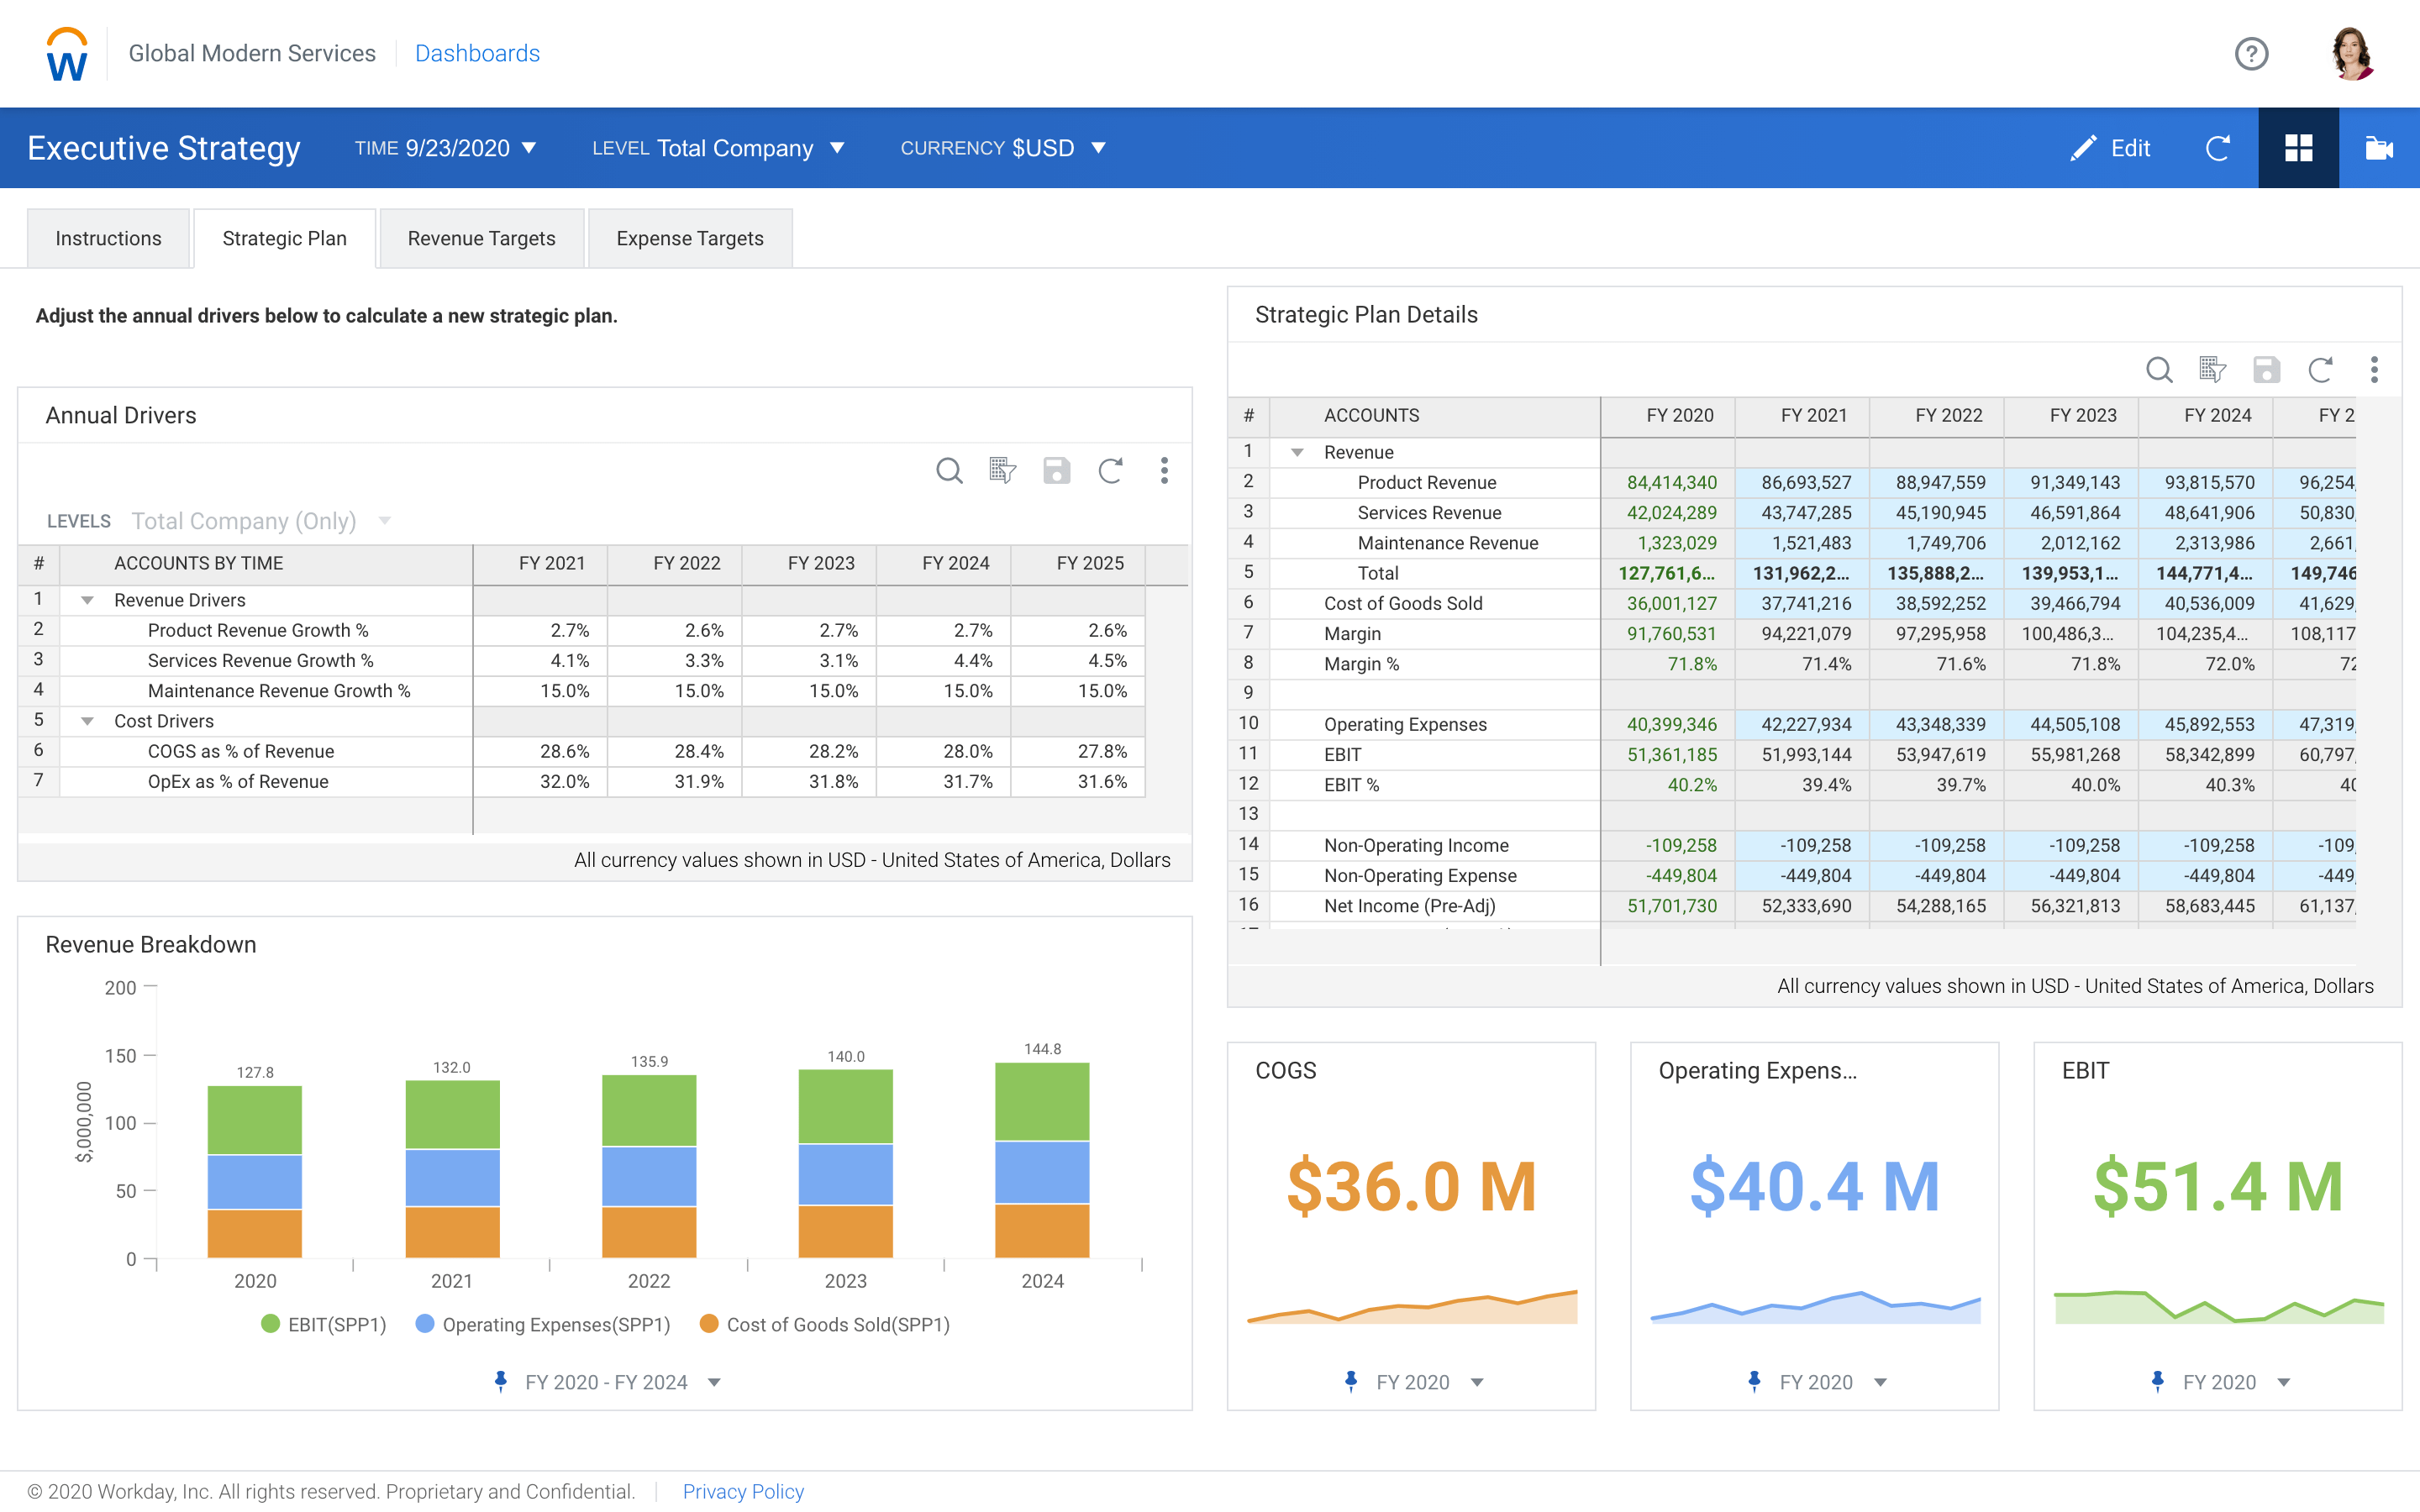
Workday Adaptive Planning
Gain real-time insights and streamline financial planning with the Workday Adaptive Planning dashboard, designed for dynamic business environments.
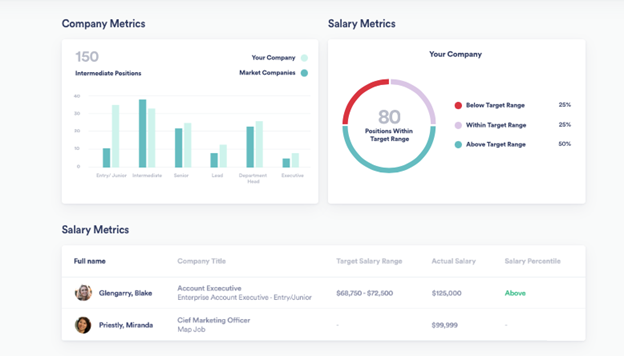
Zenefits
The Zenefits dashboard streamlines HR tasks by integrating payroll, benefits, and compliance into a single, user-friendly interface.

Apache Superset
Explore data insights with Apache Superset's interactive visualizations, offering customizable dashboards for efficient data-driven decision-making.
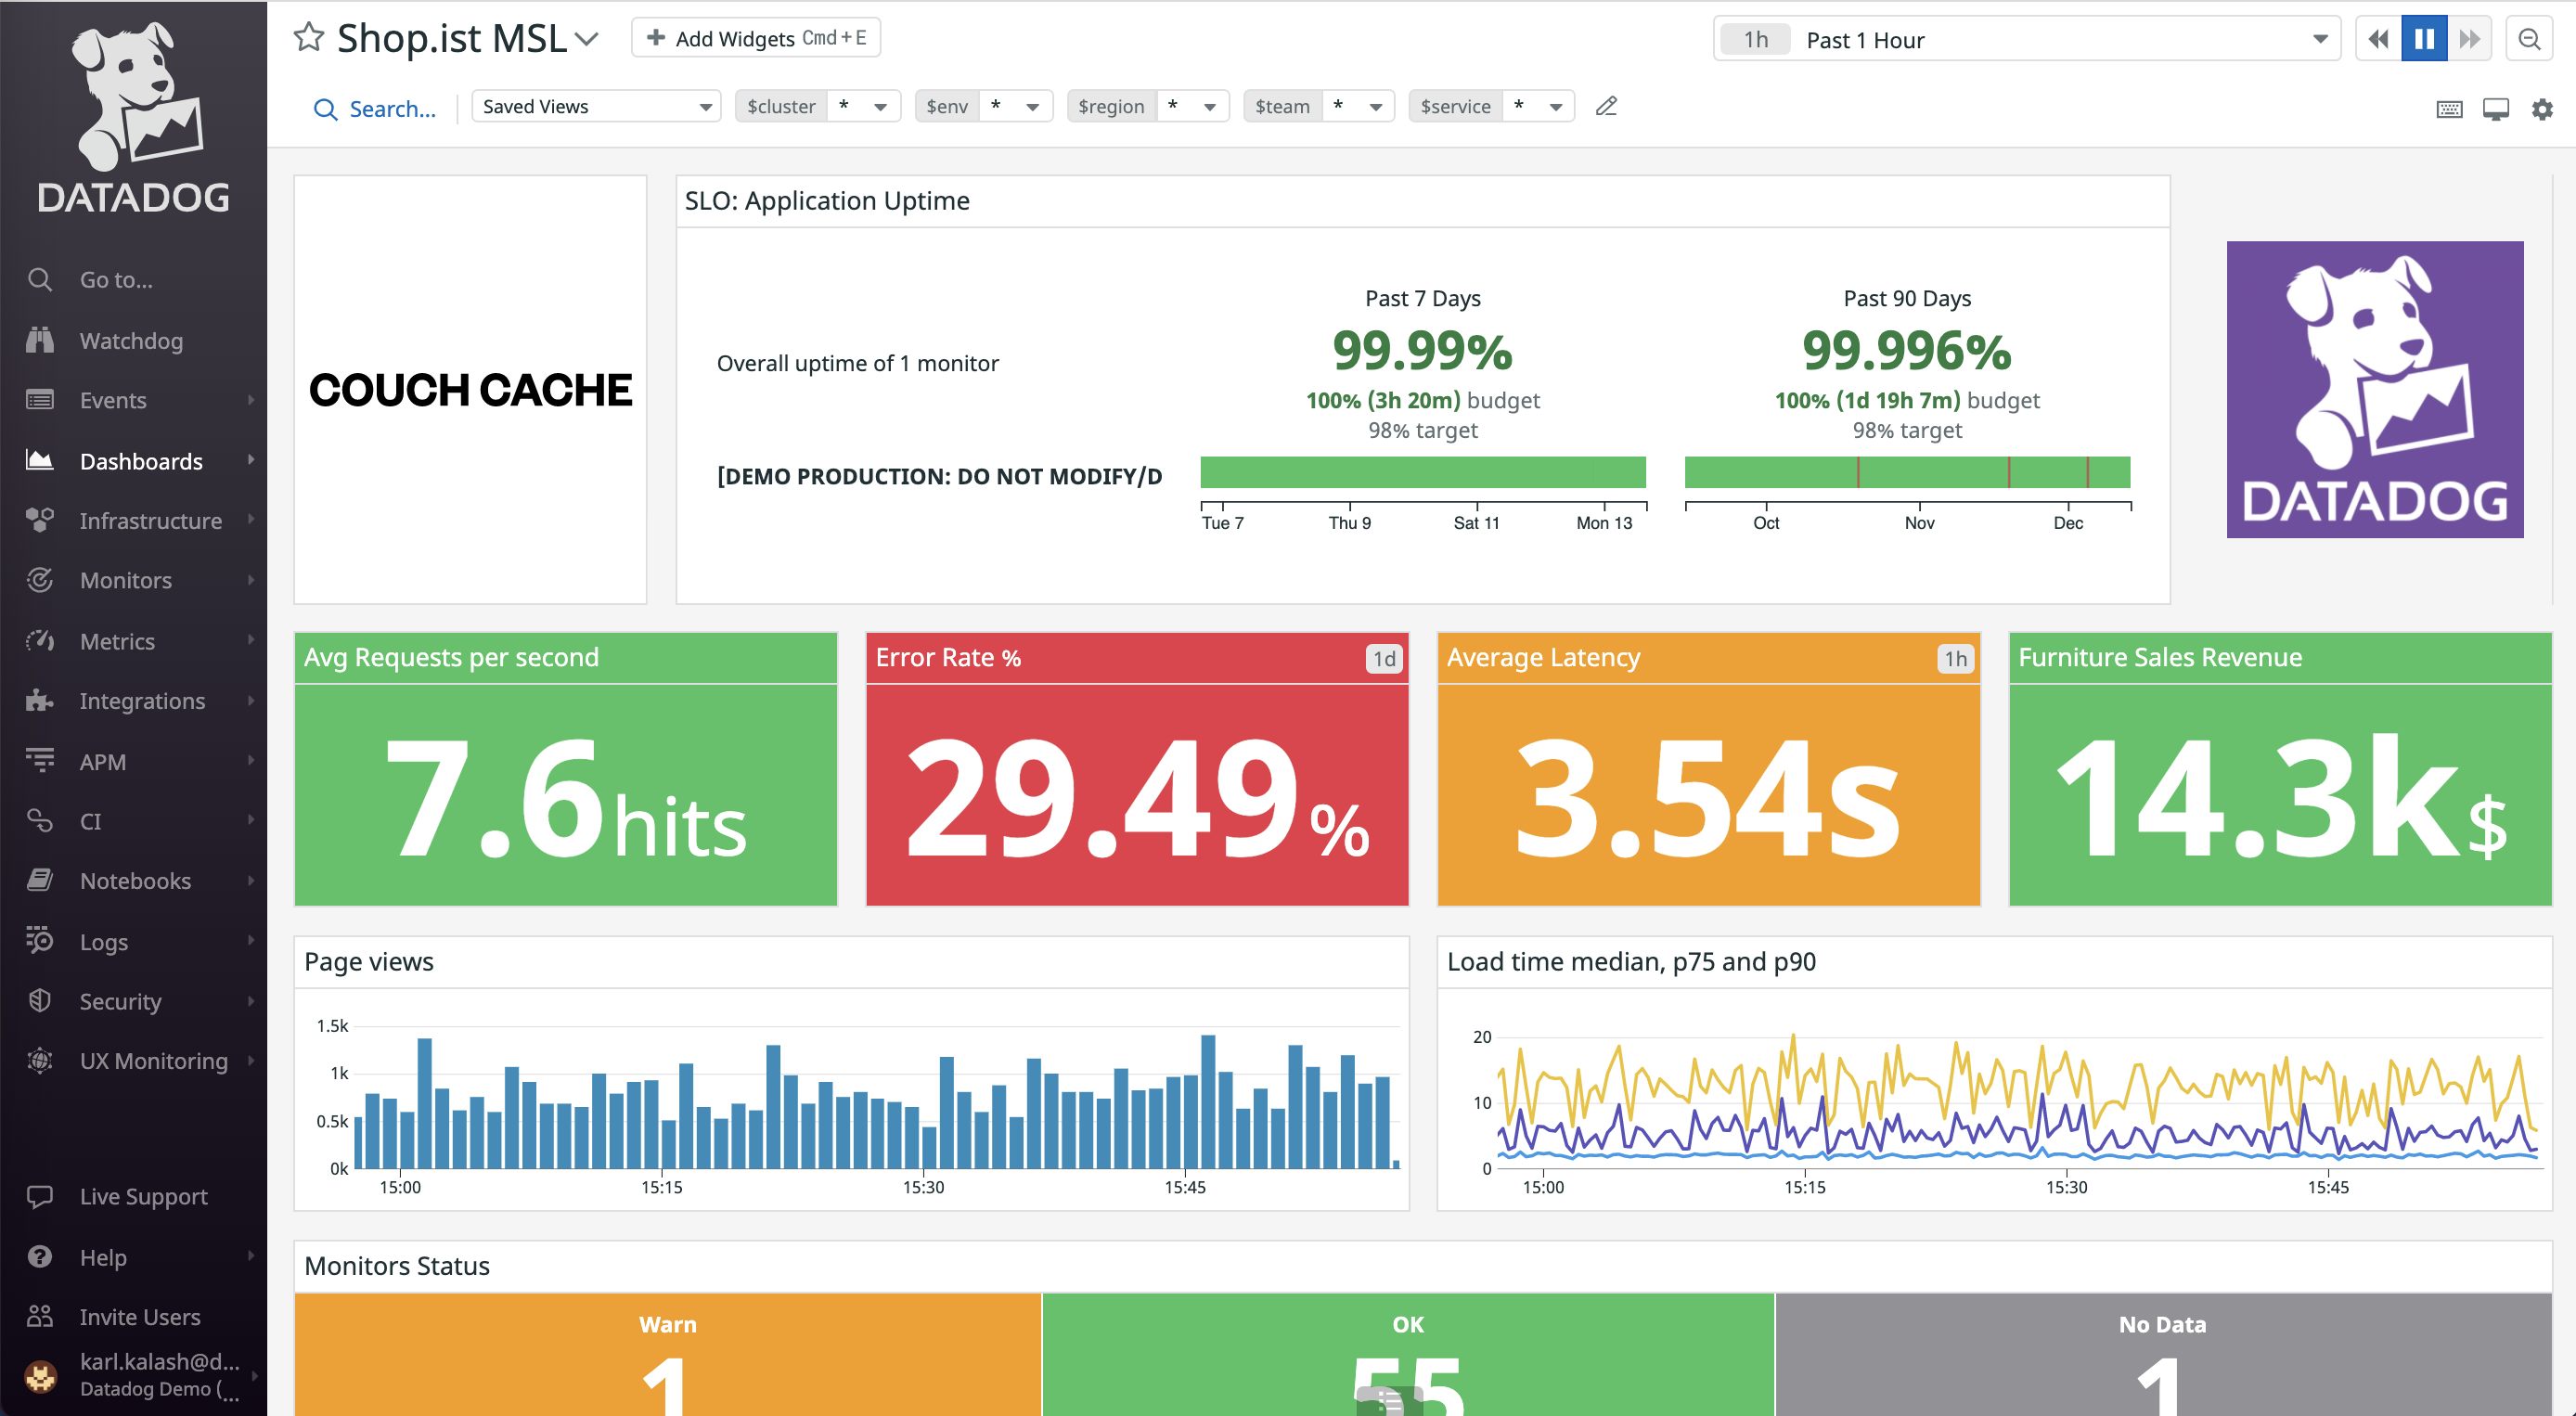
Datadog
Monitor and analyze your infrastructure, applications, and logs in real-time with Datadog's comprehensive and customizable dashboard.
Dynatrace
Monitor and optimize your application's performance with real-time insights and analytics using the Dynatrace dashboard.
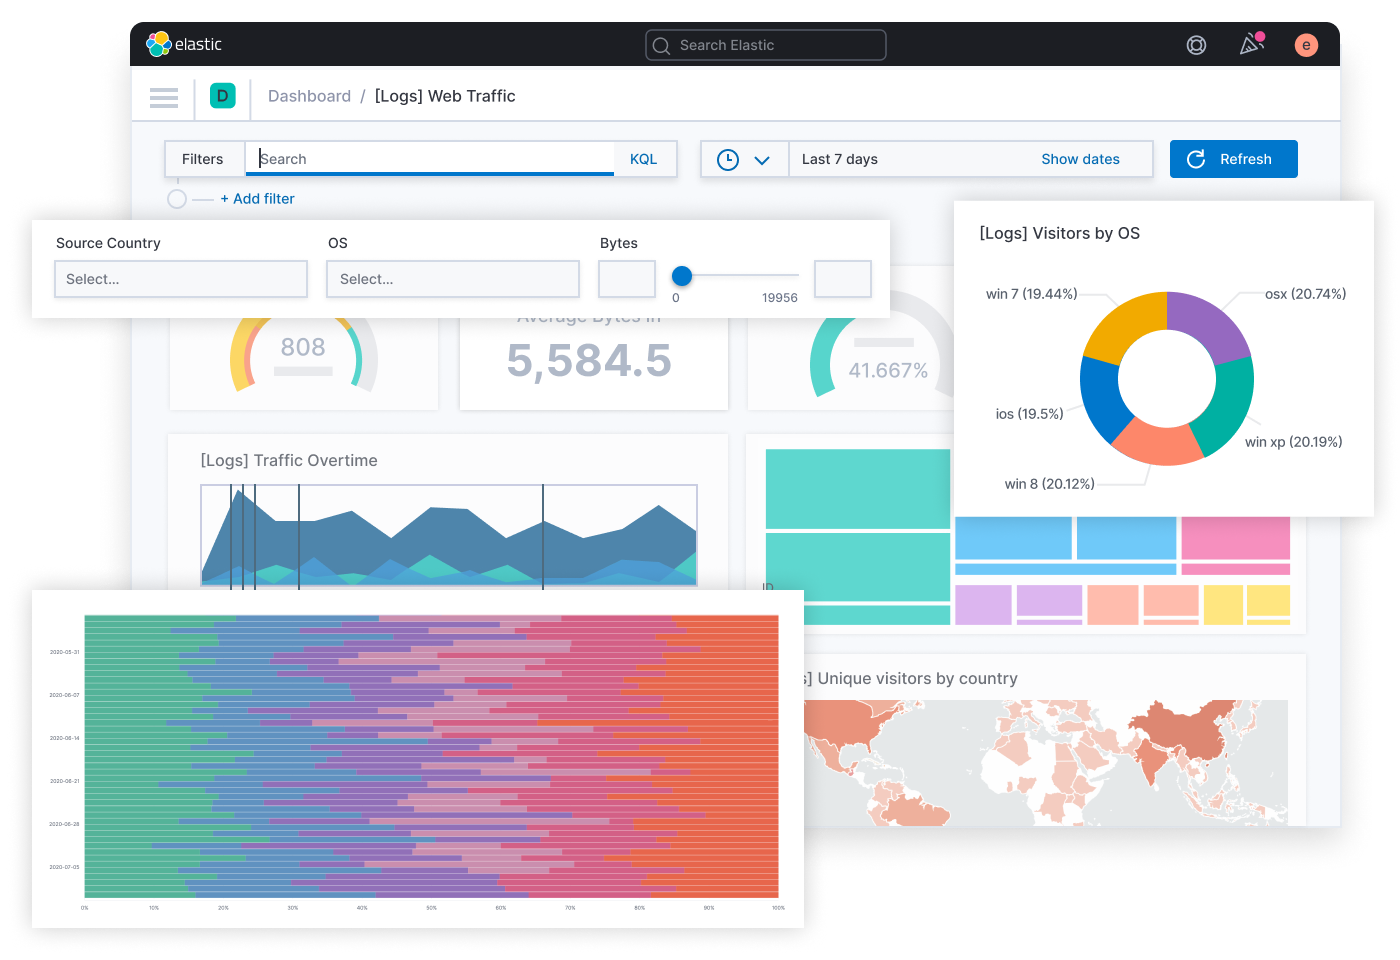
Elasticsearch Kibana
Visualize, analyze, and monitor your Elasticsearch data in real-time with interactive charts and graphs using the Elasticsearch Kibana dashboard.
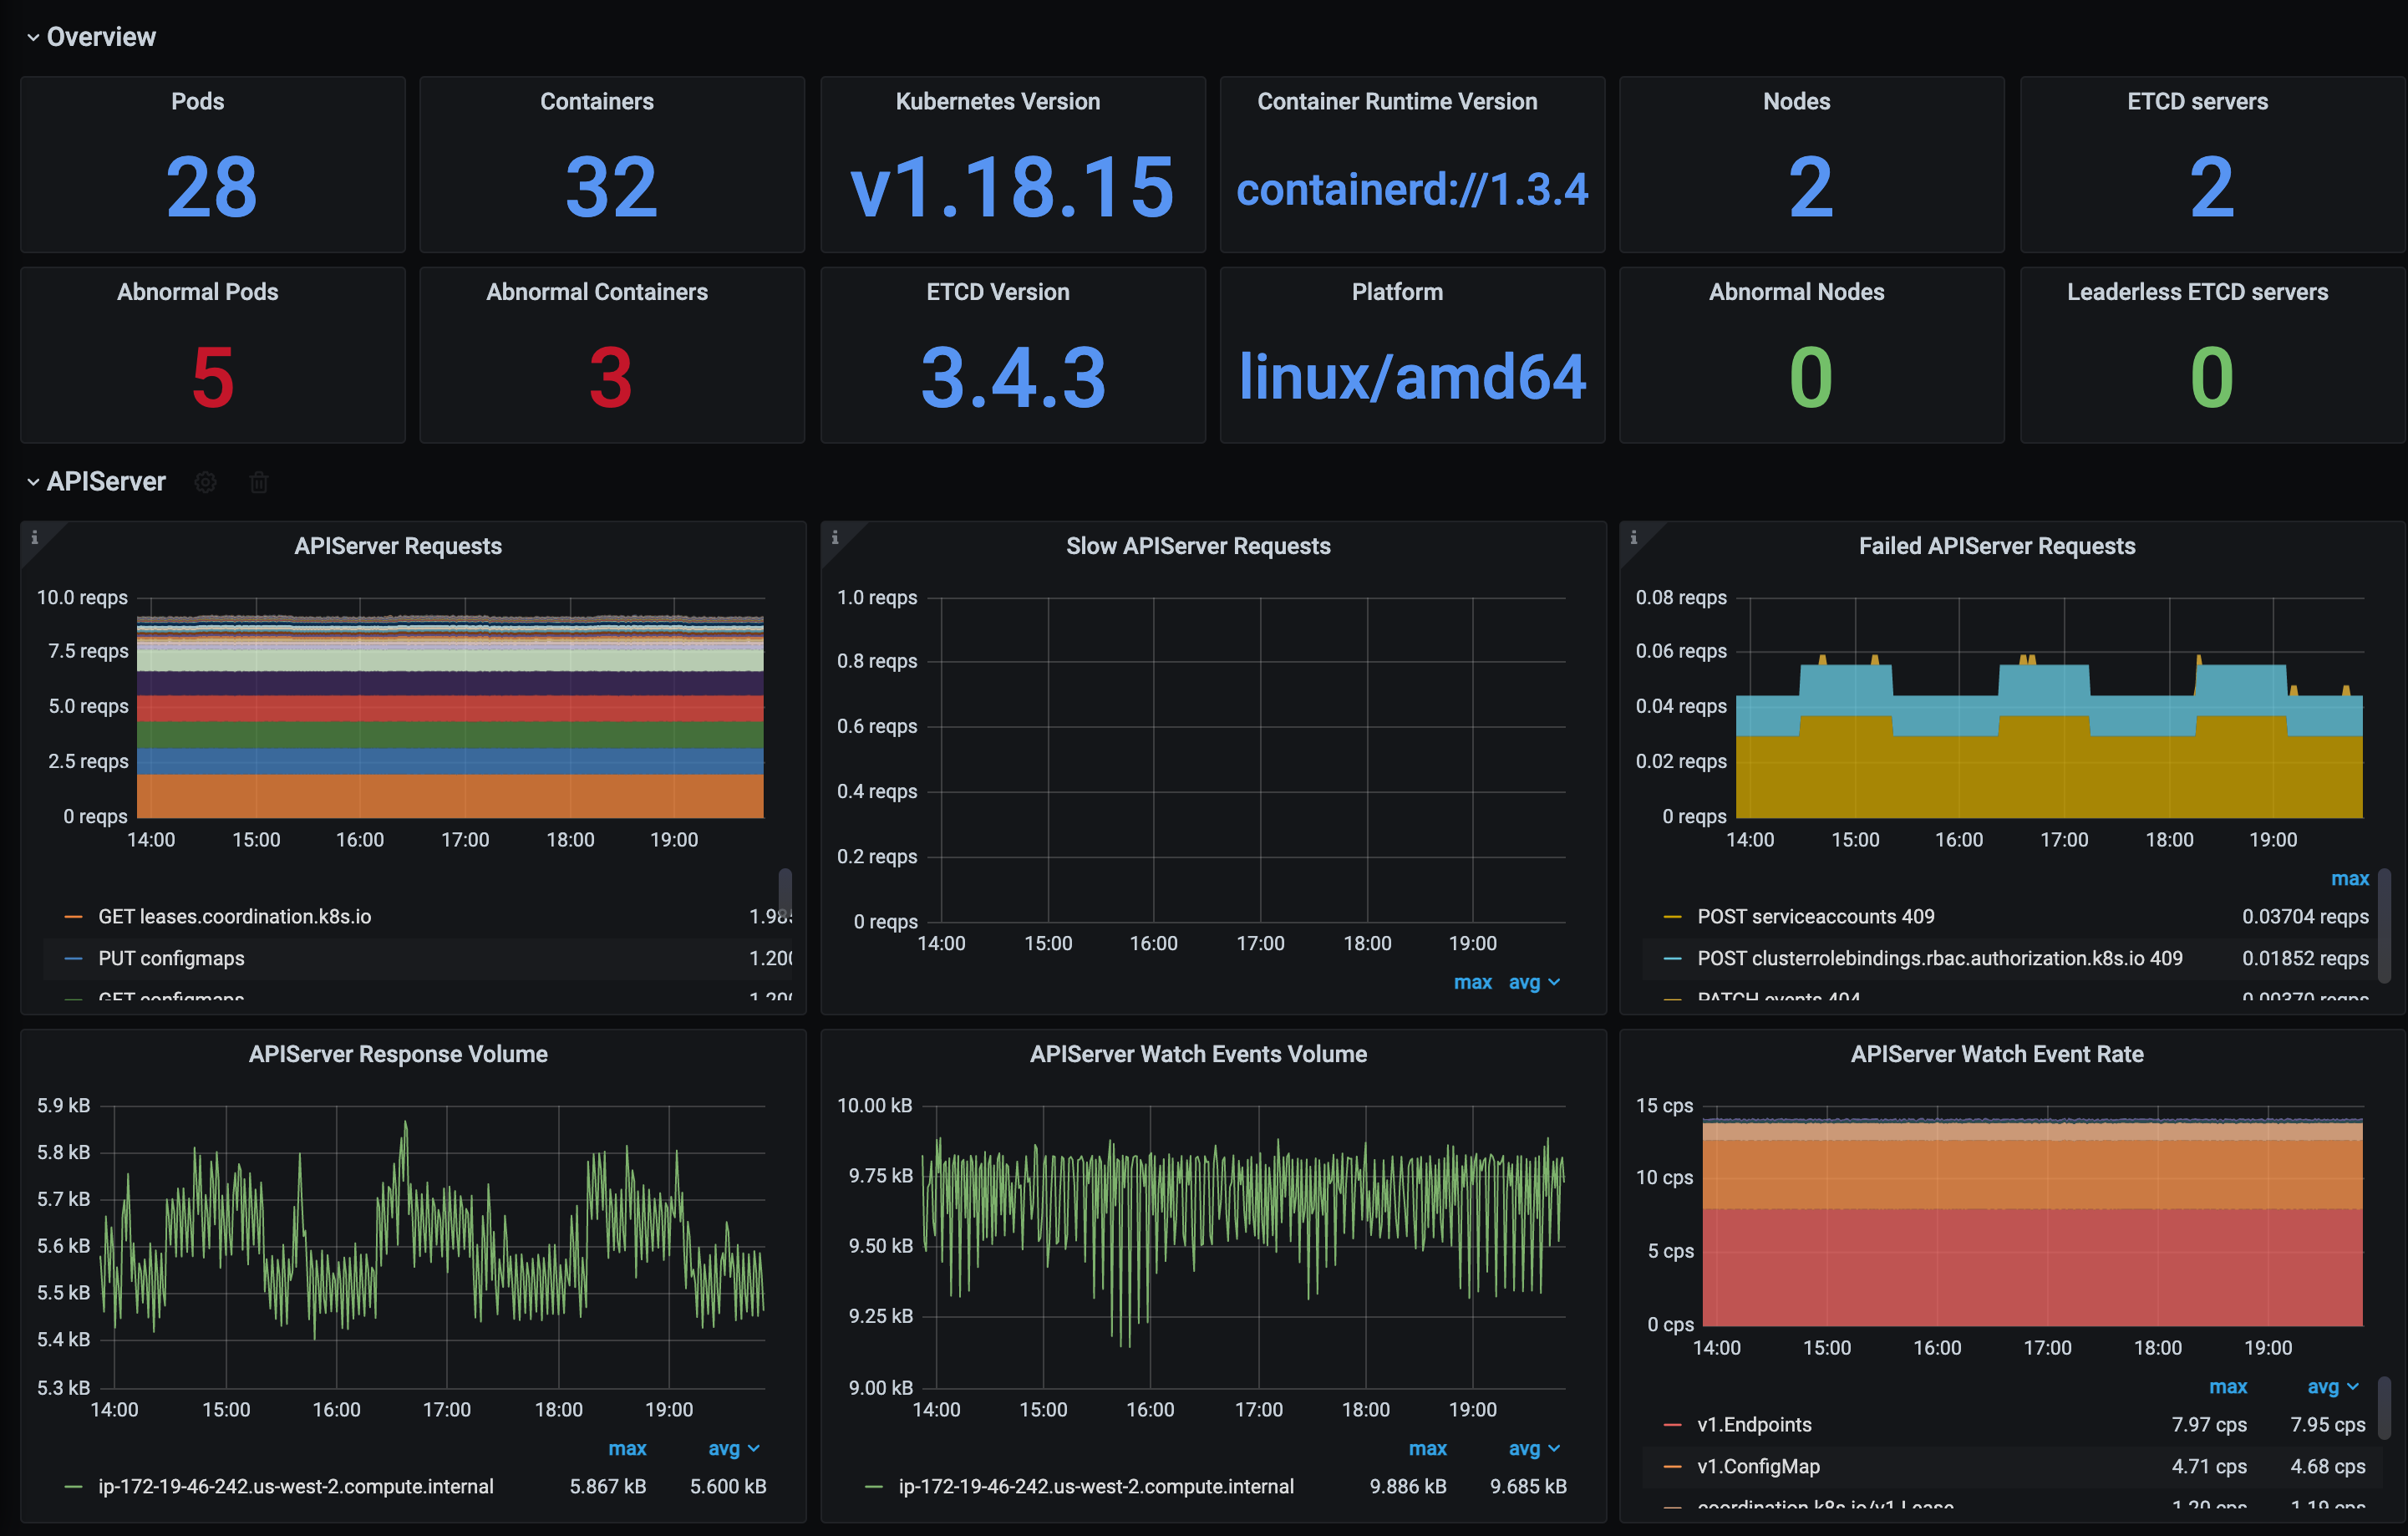
Grafana
Monitor and analyze real-time data with Grafana's interactive dashboard, offering customizable visualizations and seamless integration with various data sources.
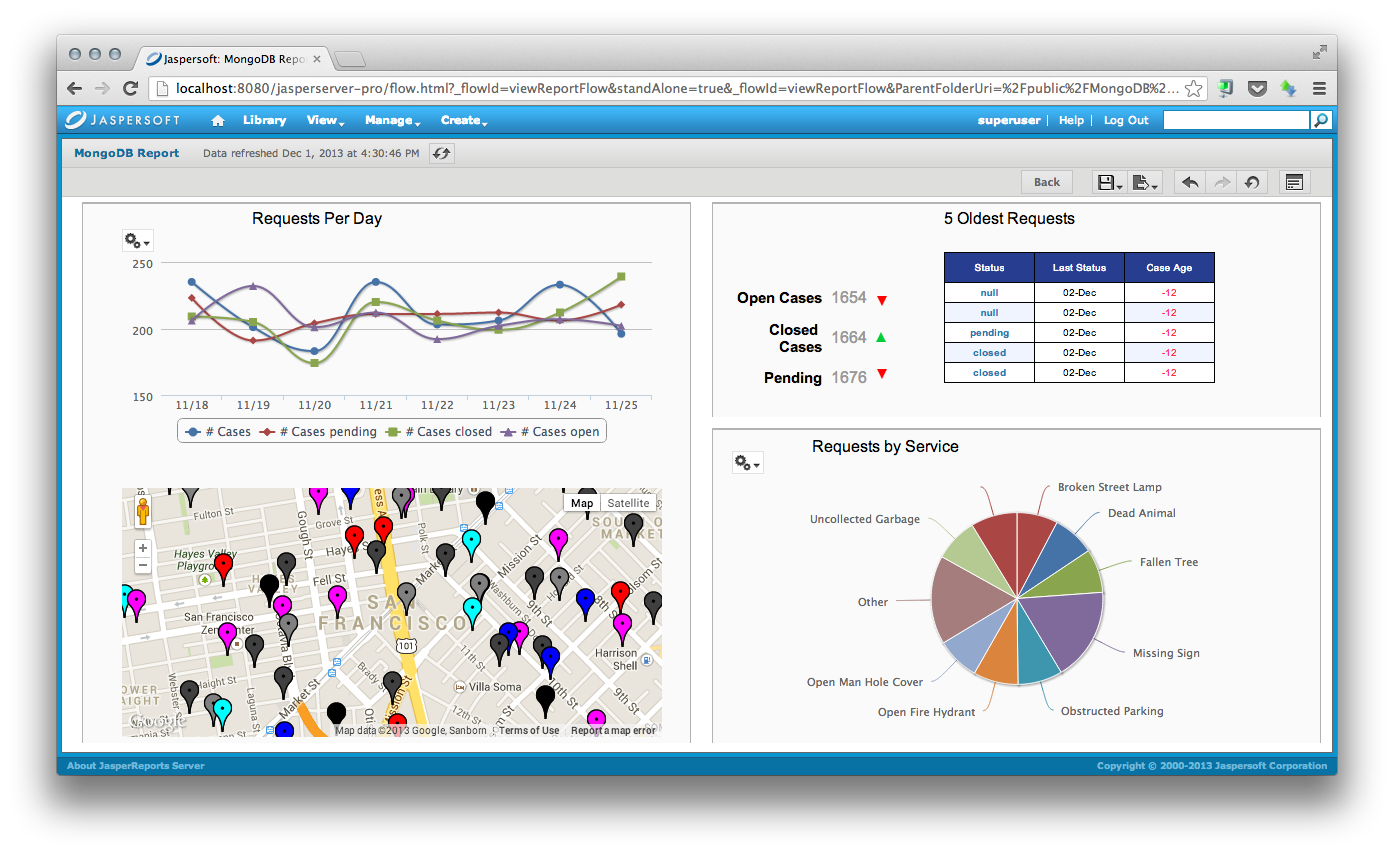
Jaspersoft
The Jaspersoft dashboard offers dynamic data visualization and reporting tools, empowering users to make informed decisions with real-time insights.

Kubernetes Dashboard
The Kubernetes Dashboard provides a web-based UI to manage, deploy, and troubleshoot Kubernetes clusters efficiently and effectively.

Loggly
Gain insights into your log data with Loggly's intuitive dashboard, offering real-time analytics, visualization, and monitoring for enhanced troubleshooting.

Nagios
Monitor and manage your IT infrastructure with the Nagios dashboard, providing real-time insights and alerts for optimal system performance.

New Relic
Monitor and optimize your application's performance with real-time insights and analytics using the New Relic dashboard.
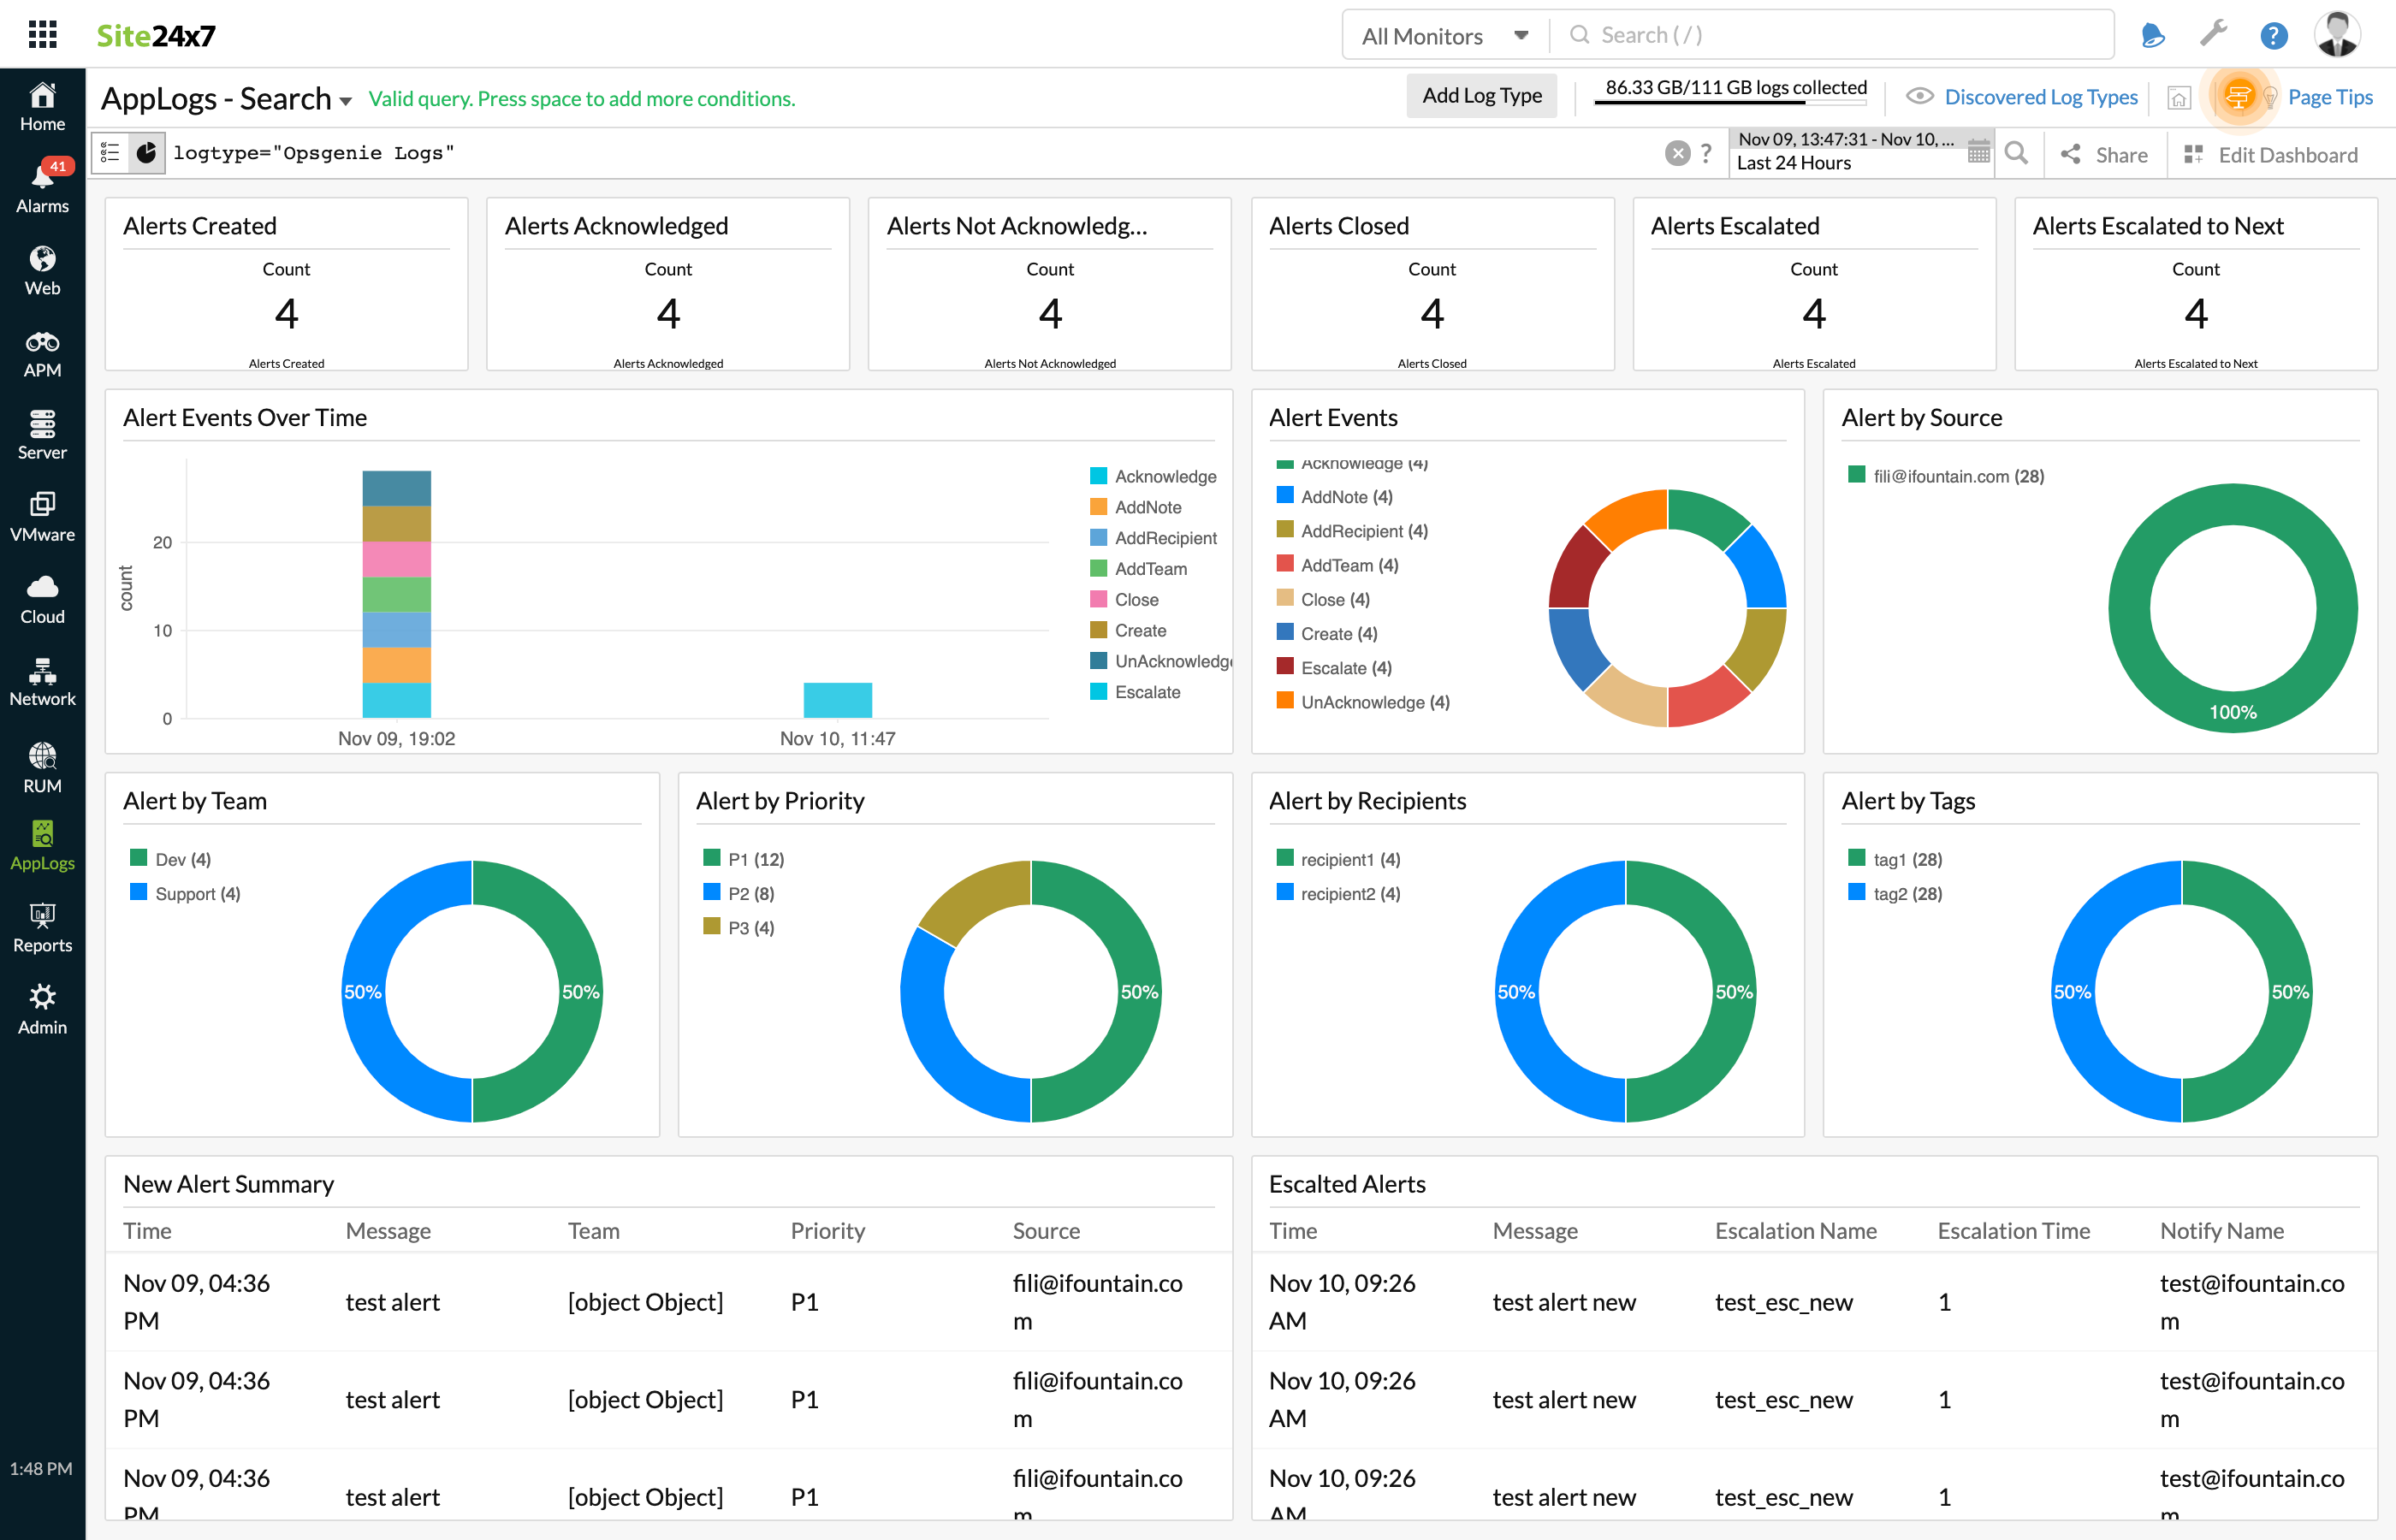
Opsgenie
Monitor and manage incidents efficiently with Opsgenie's intuitive dashboard, offering real-time alerts, analytics, and seamless team collaboration.

PagerDuty
Monitor and manage incidents effectively with the PagerDuty dashboard, offering real-time alerts, analytics, and seamless integration for optimal response.

Pentaho
Leverage Pentaho's dashboard for comprehensive data integration, analytics, and visualization to drive informed business decisions efficiently.
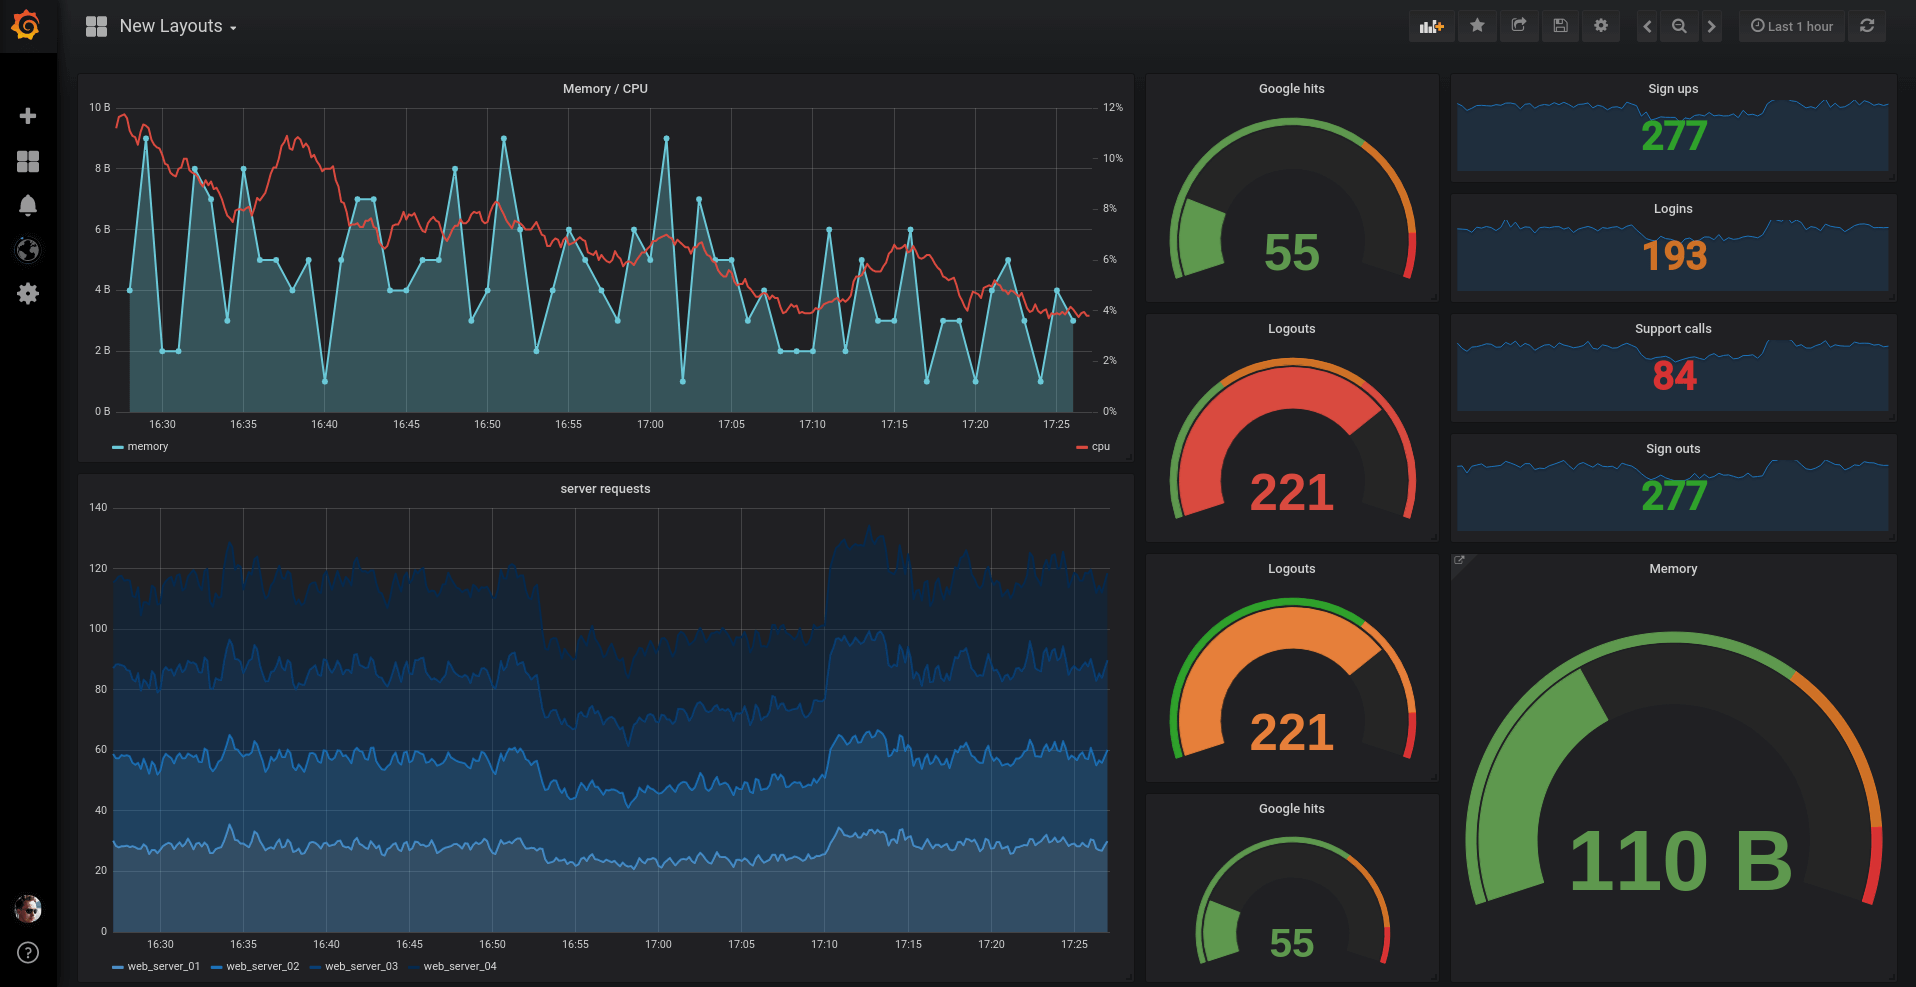
Prometheus
Monitor and visualize metrics efficiently with the Prometheus dashboard, offering real-time insights and alerting for system performance and reliability.
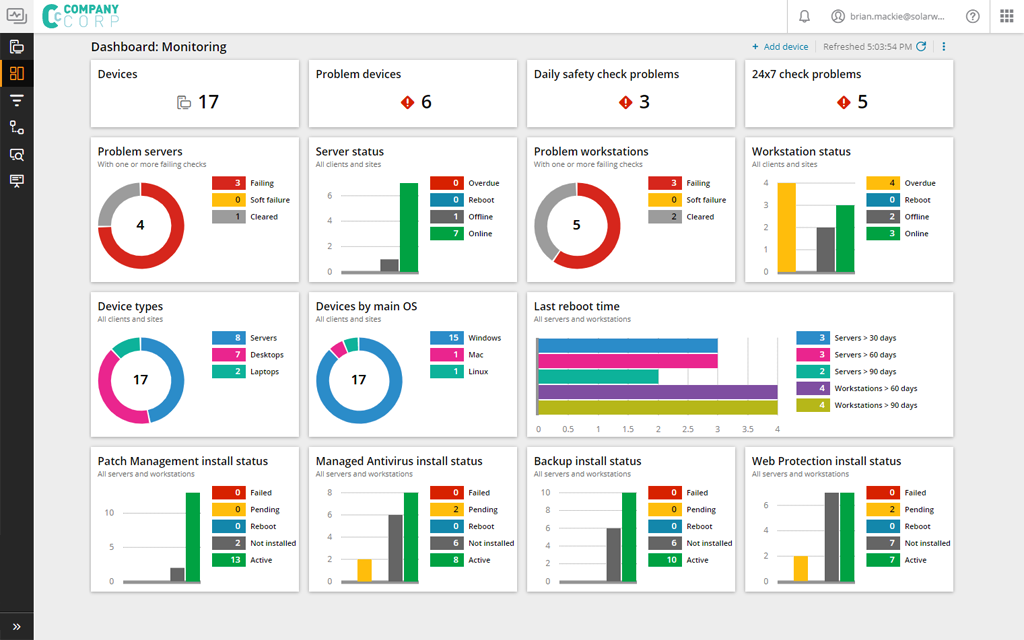
SolarWinds
Monitor and manage your IT infrastructure efficiently with the SolarWinds dashboard, offering real-time insights and comprehensive performance metrics.

Sumo Logic
Gain real-time insights into your IT infrastructure with the Sumo Logic dashboard, offering comprehensive data analytics and security monitoring.
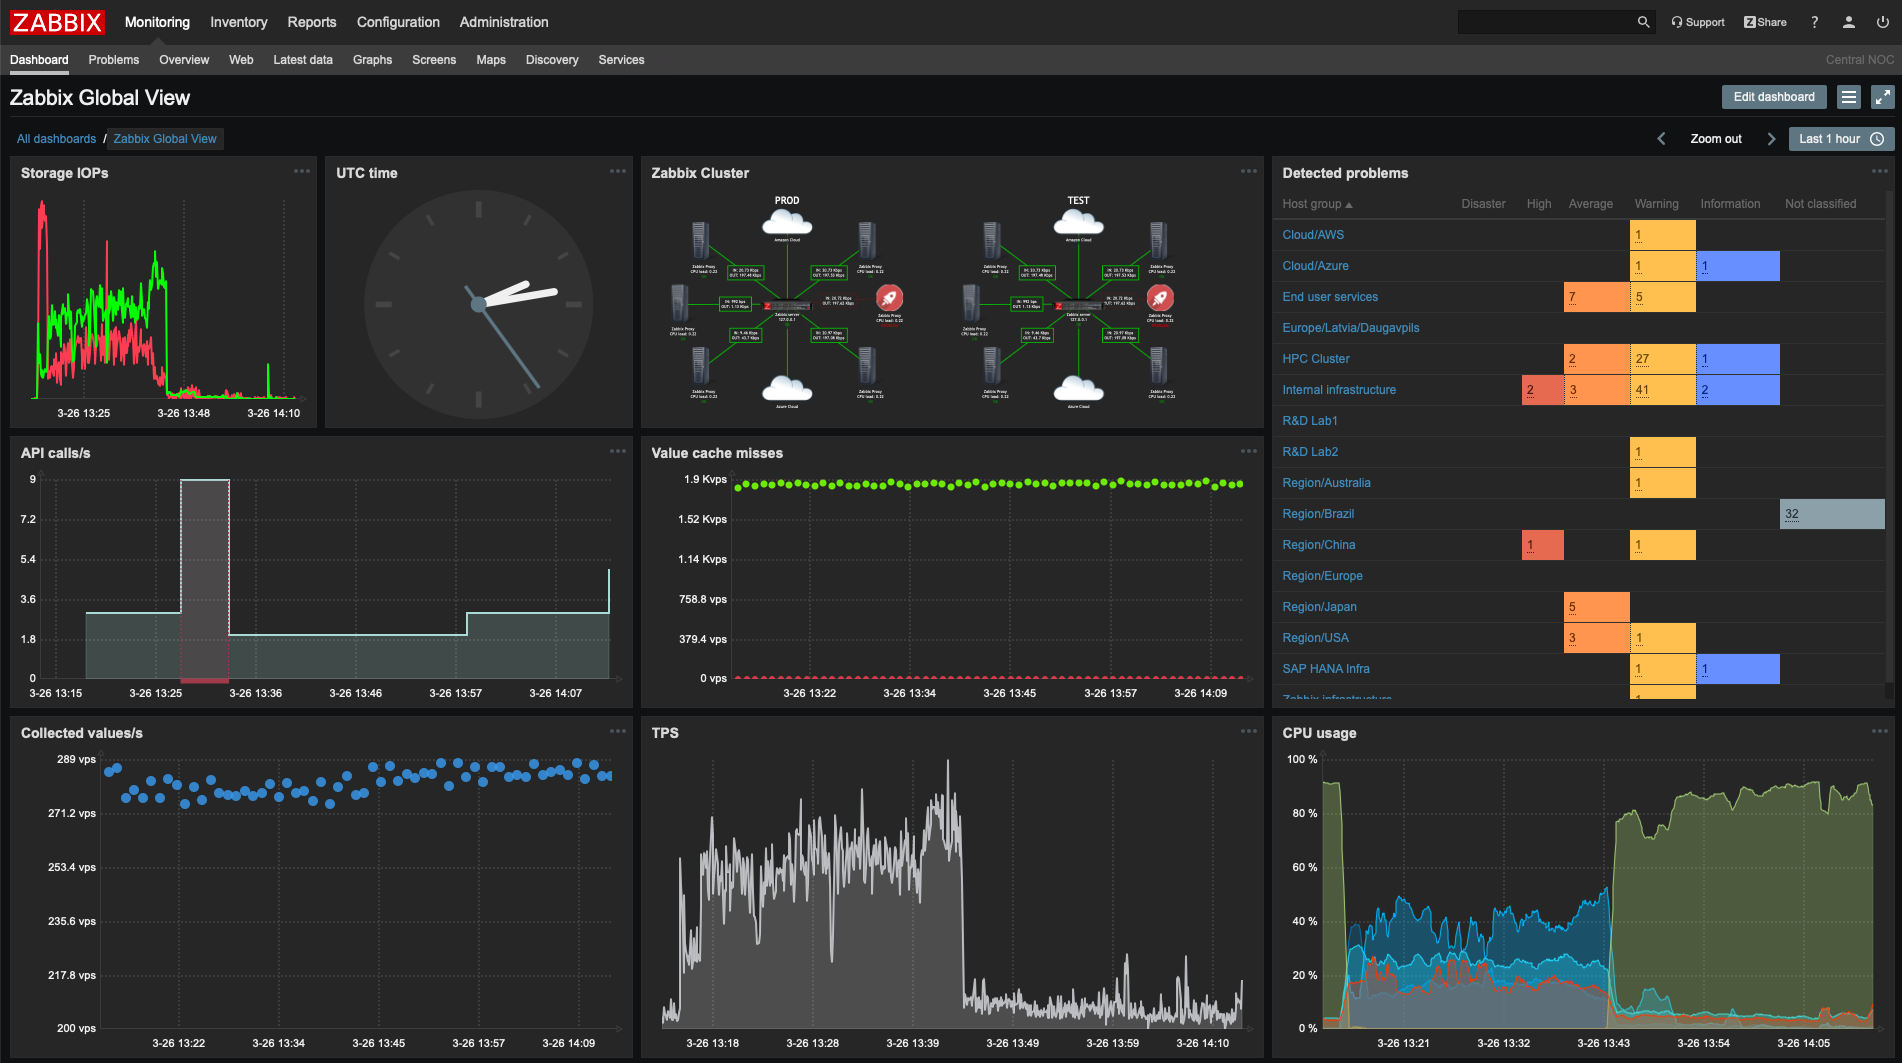
Zabbix
Monitor and analyze your IT infrastructure in real-time with the Zabbix dashboard, offering comprehensive insights and alerts for optimal performance.

DELMIAWorks
Optimize manufacturing efficiency with DELMIAWorks' real-time data insights, enhancing production, quality, and supply chain management.
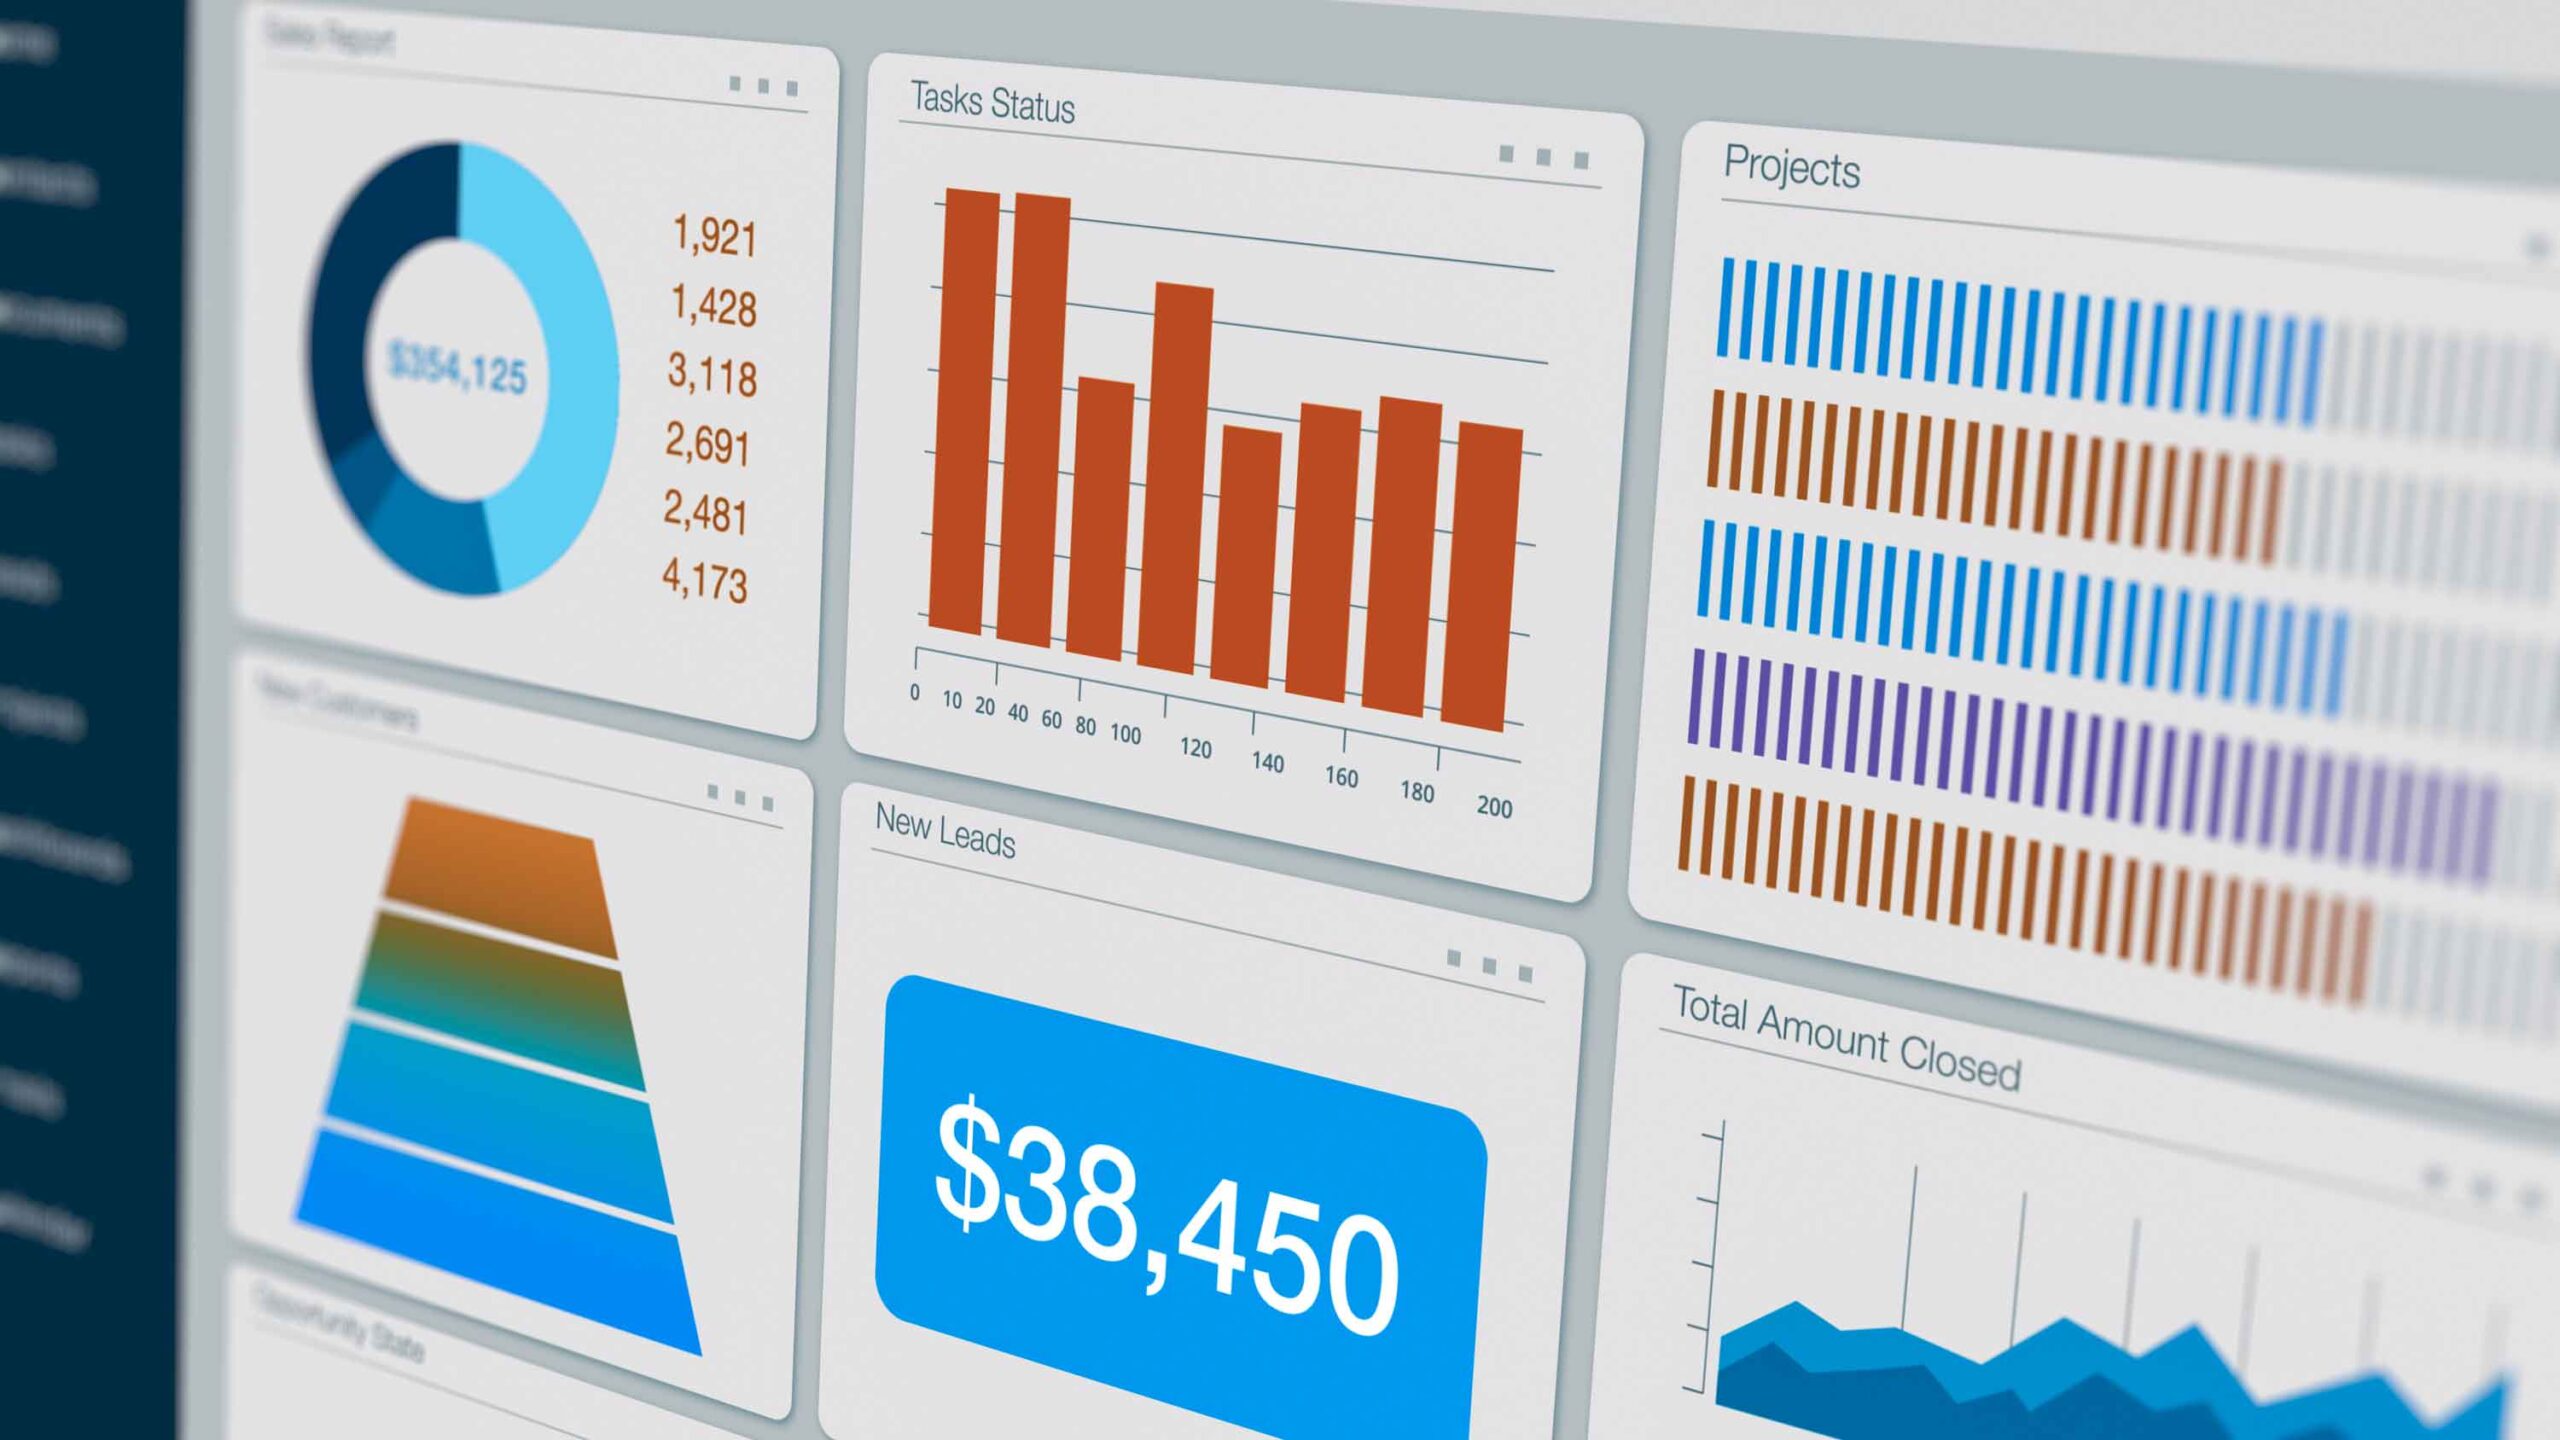
Epicor ERP
Streamline operations with Epicor ERP's intuitive dashboard, offering real-time insights and analytics for efficient decision-making and performance tracking.

GE Digital
Explore GE Digital's comprehensive dashboard for real-time data analytics, operational insights, and enhanced decision-making in industrial environments.
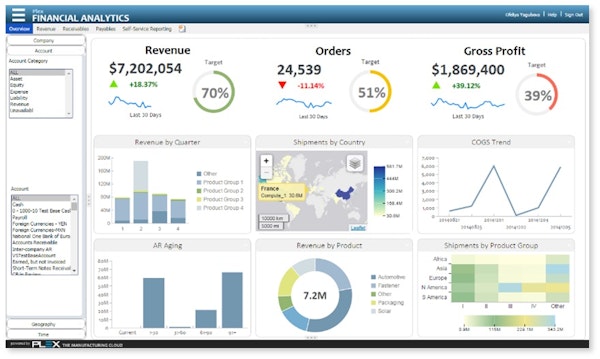
Plex Manufacturing Cloud
Monitor and optimize your manufacturing operations with real-time data and analytics using the Plex Manufacturing Cloud dashboard.

Rockwell FactoryTalk Analytics
Gain actionable insights with Rockwell FactoryTalk Analytics, optimizing industrial operations through real-time data visualization and analysis.

SAP Digital Manufacturing Cloud
Effortlessly monitor and optimize production processes with the SAP Digital Manufacturing Cloud dashboard, ensuring real-time insights and enhanced efficiency.

Siemens Mindsphere
Unlock the power of IoT with Siemens Mindsphere, providing real-time data analytics and insights to optimize industrial operations efficiently.
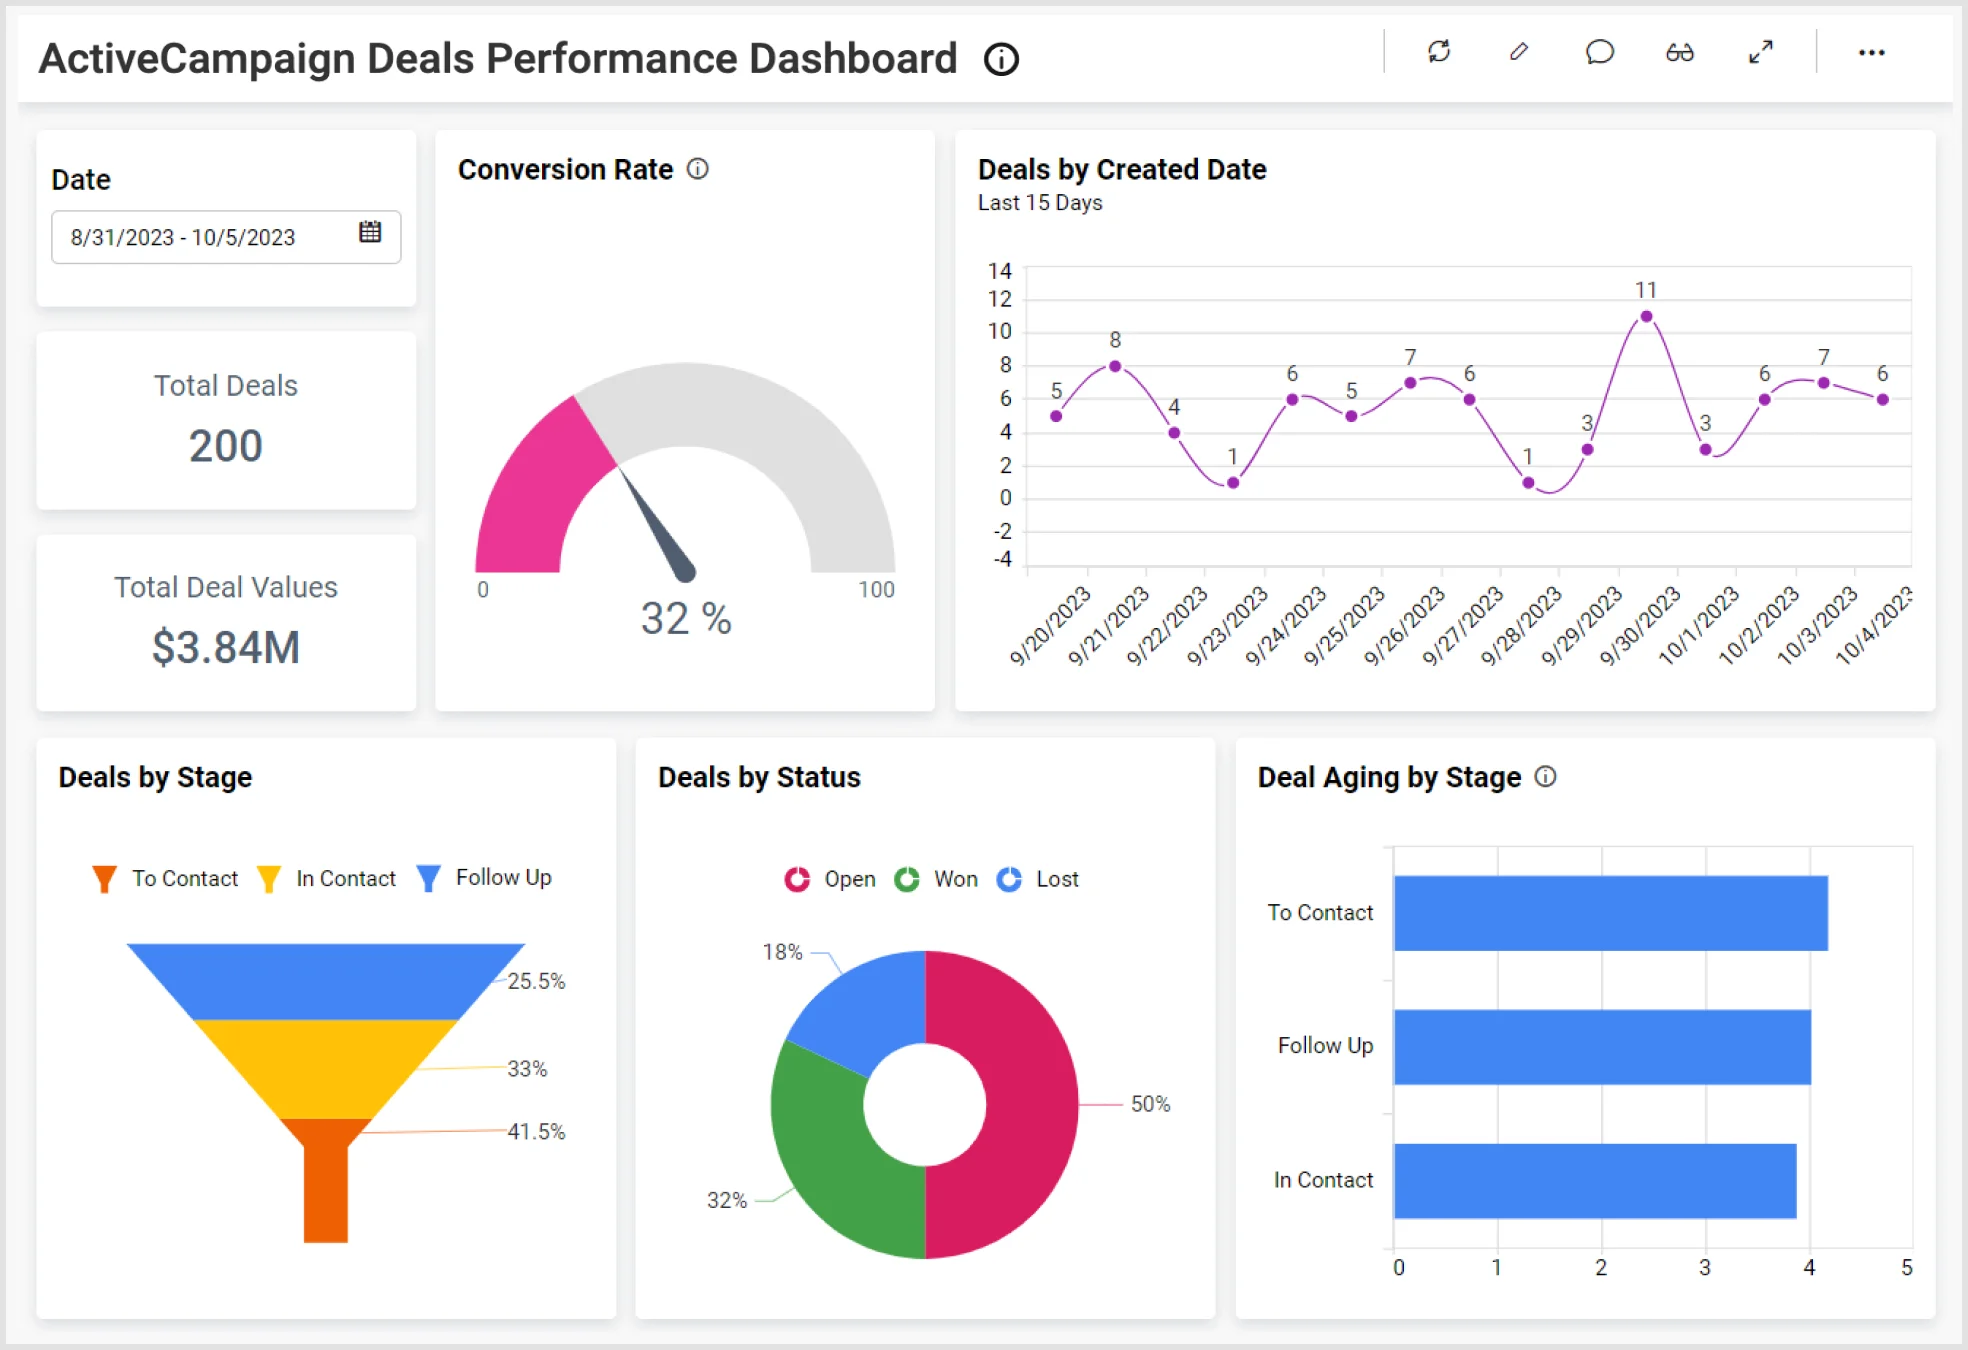
ActiveCampaign
Monitor and optimize your marketing campaigns with ActiveCampaign's intuitive dashboard, offering real-time insights and analytics for better decision-making.

Adobe Analytics
Gain insights into user behavior, track performance metrics, and optimize strategies with the comprehensive Adobe Analytics dashboard.

Adverity
Adverity's dashboard offers comprehensive data integration, visualization, and analytics to optimize marketing performance in real-time.
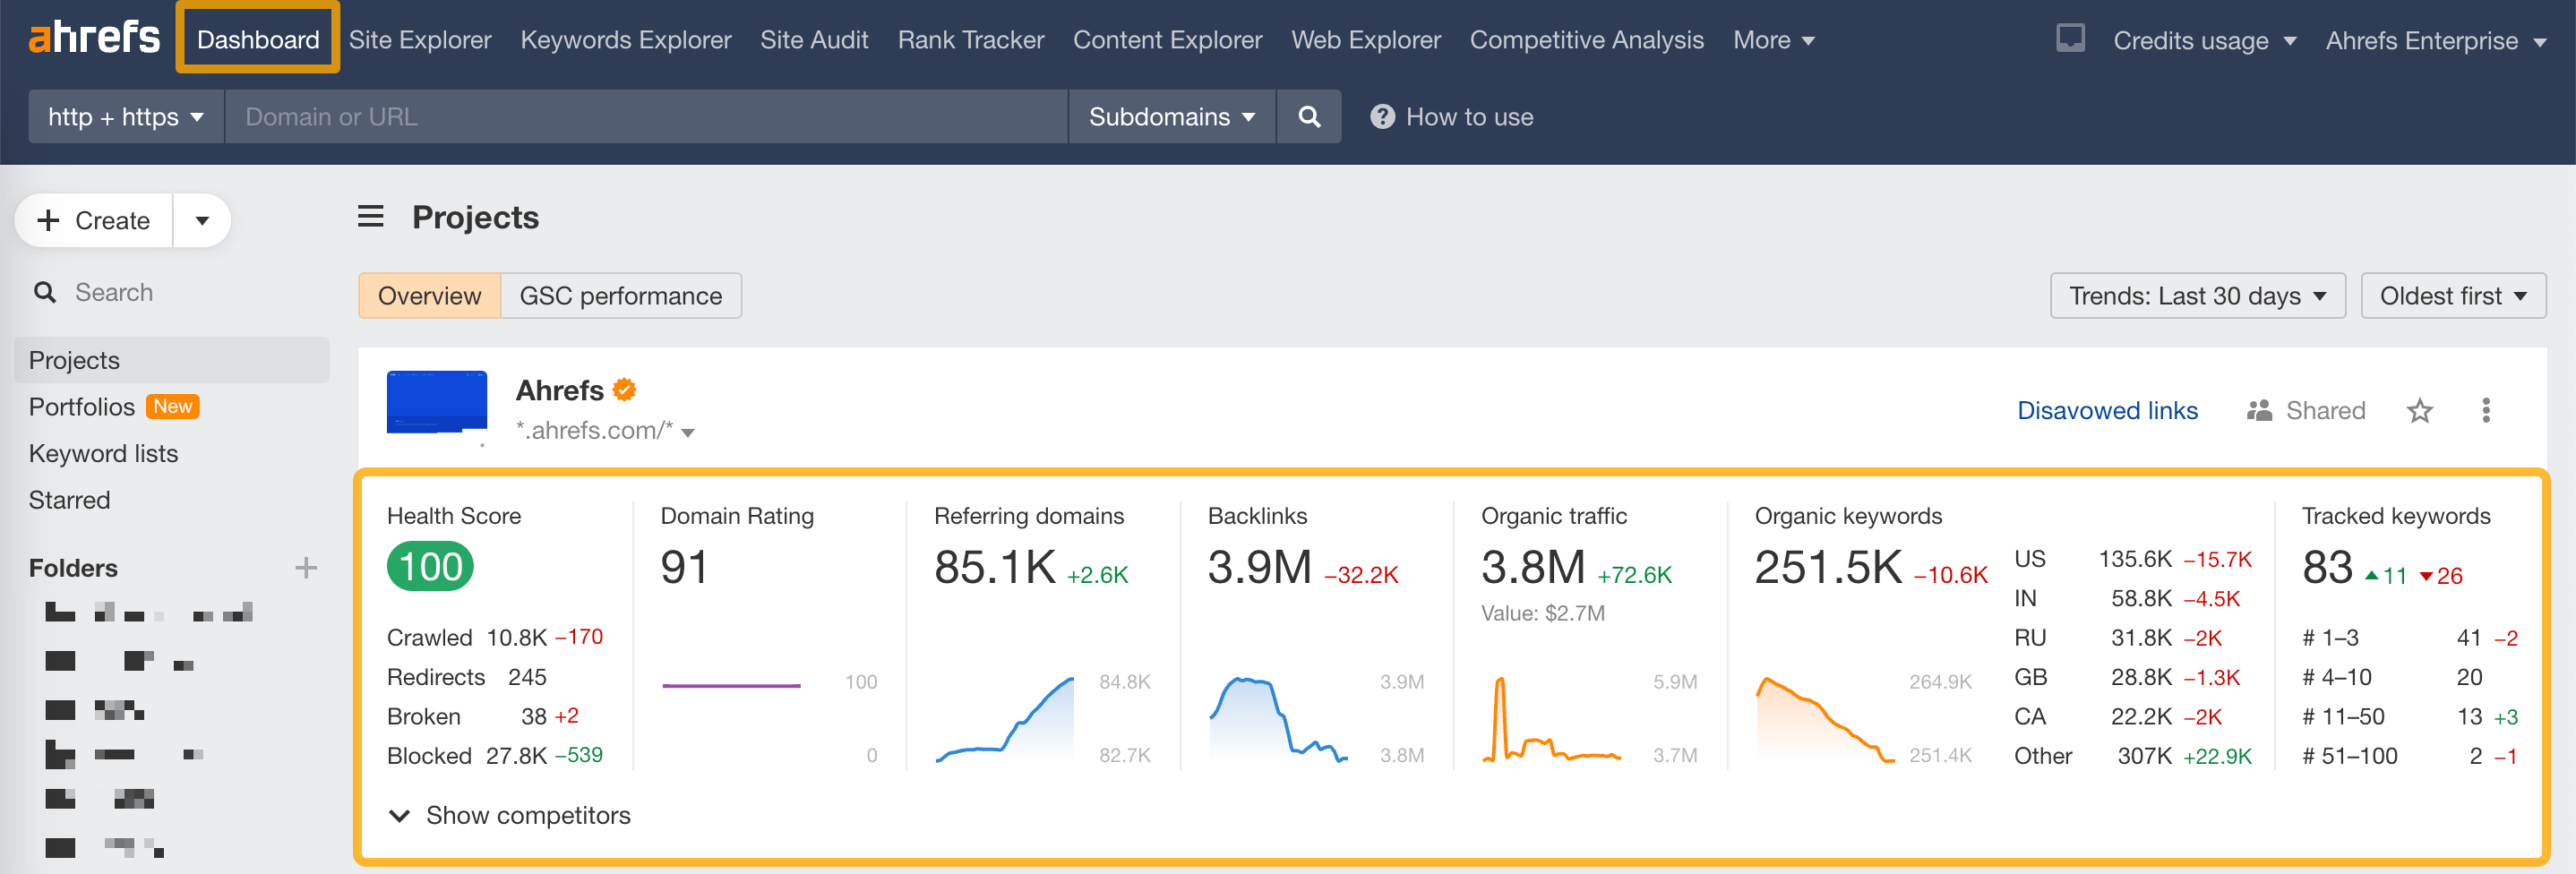
Ahrefs
Gain insights into your website's SEO performance, track backlinks, and analyze competitors with the comprehensive Ahrefs dashboard.
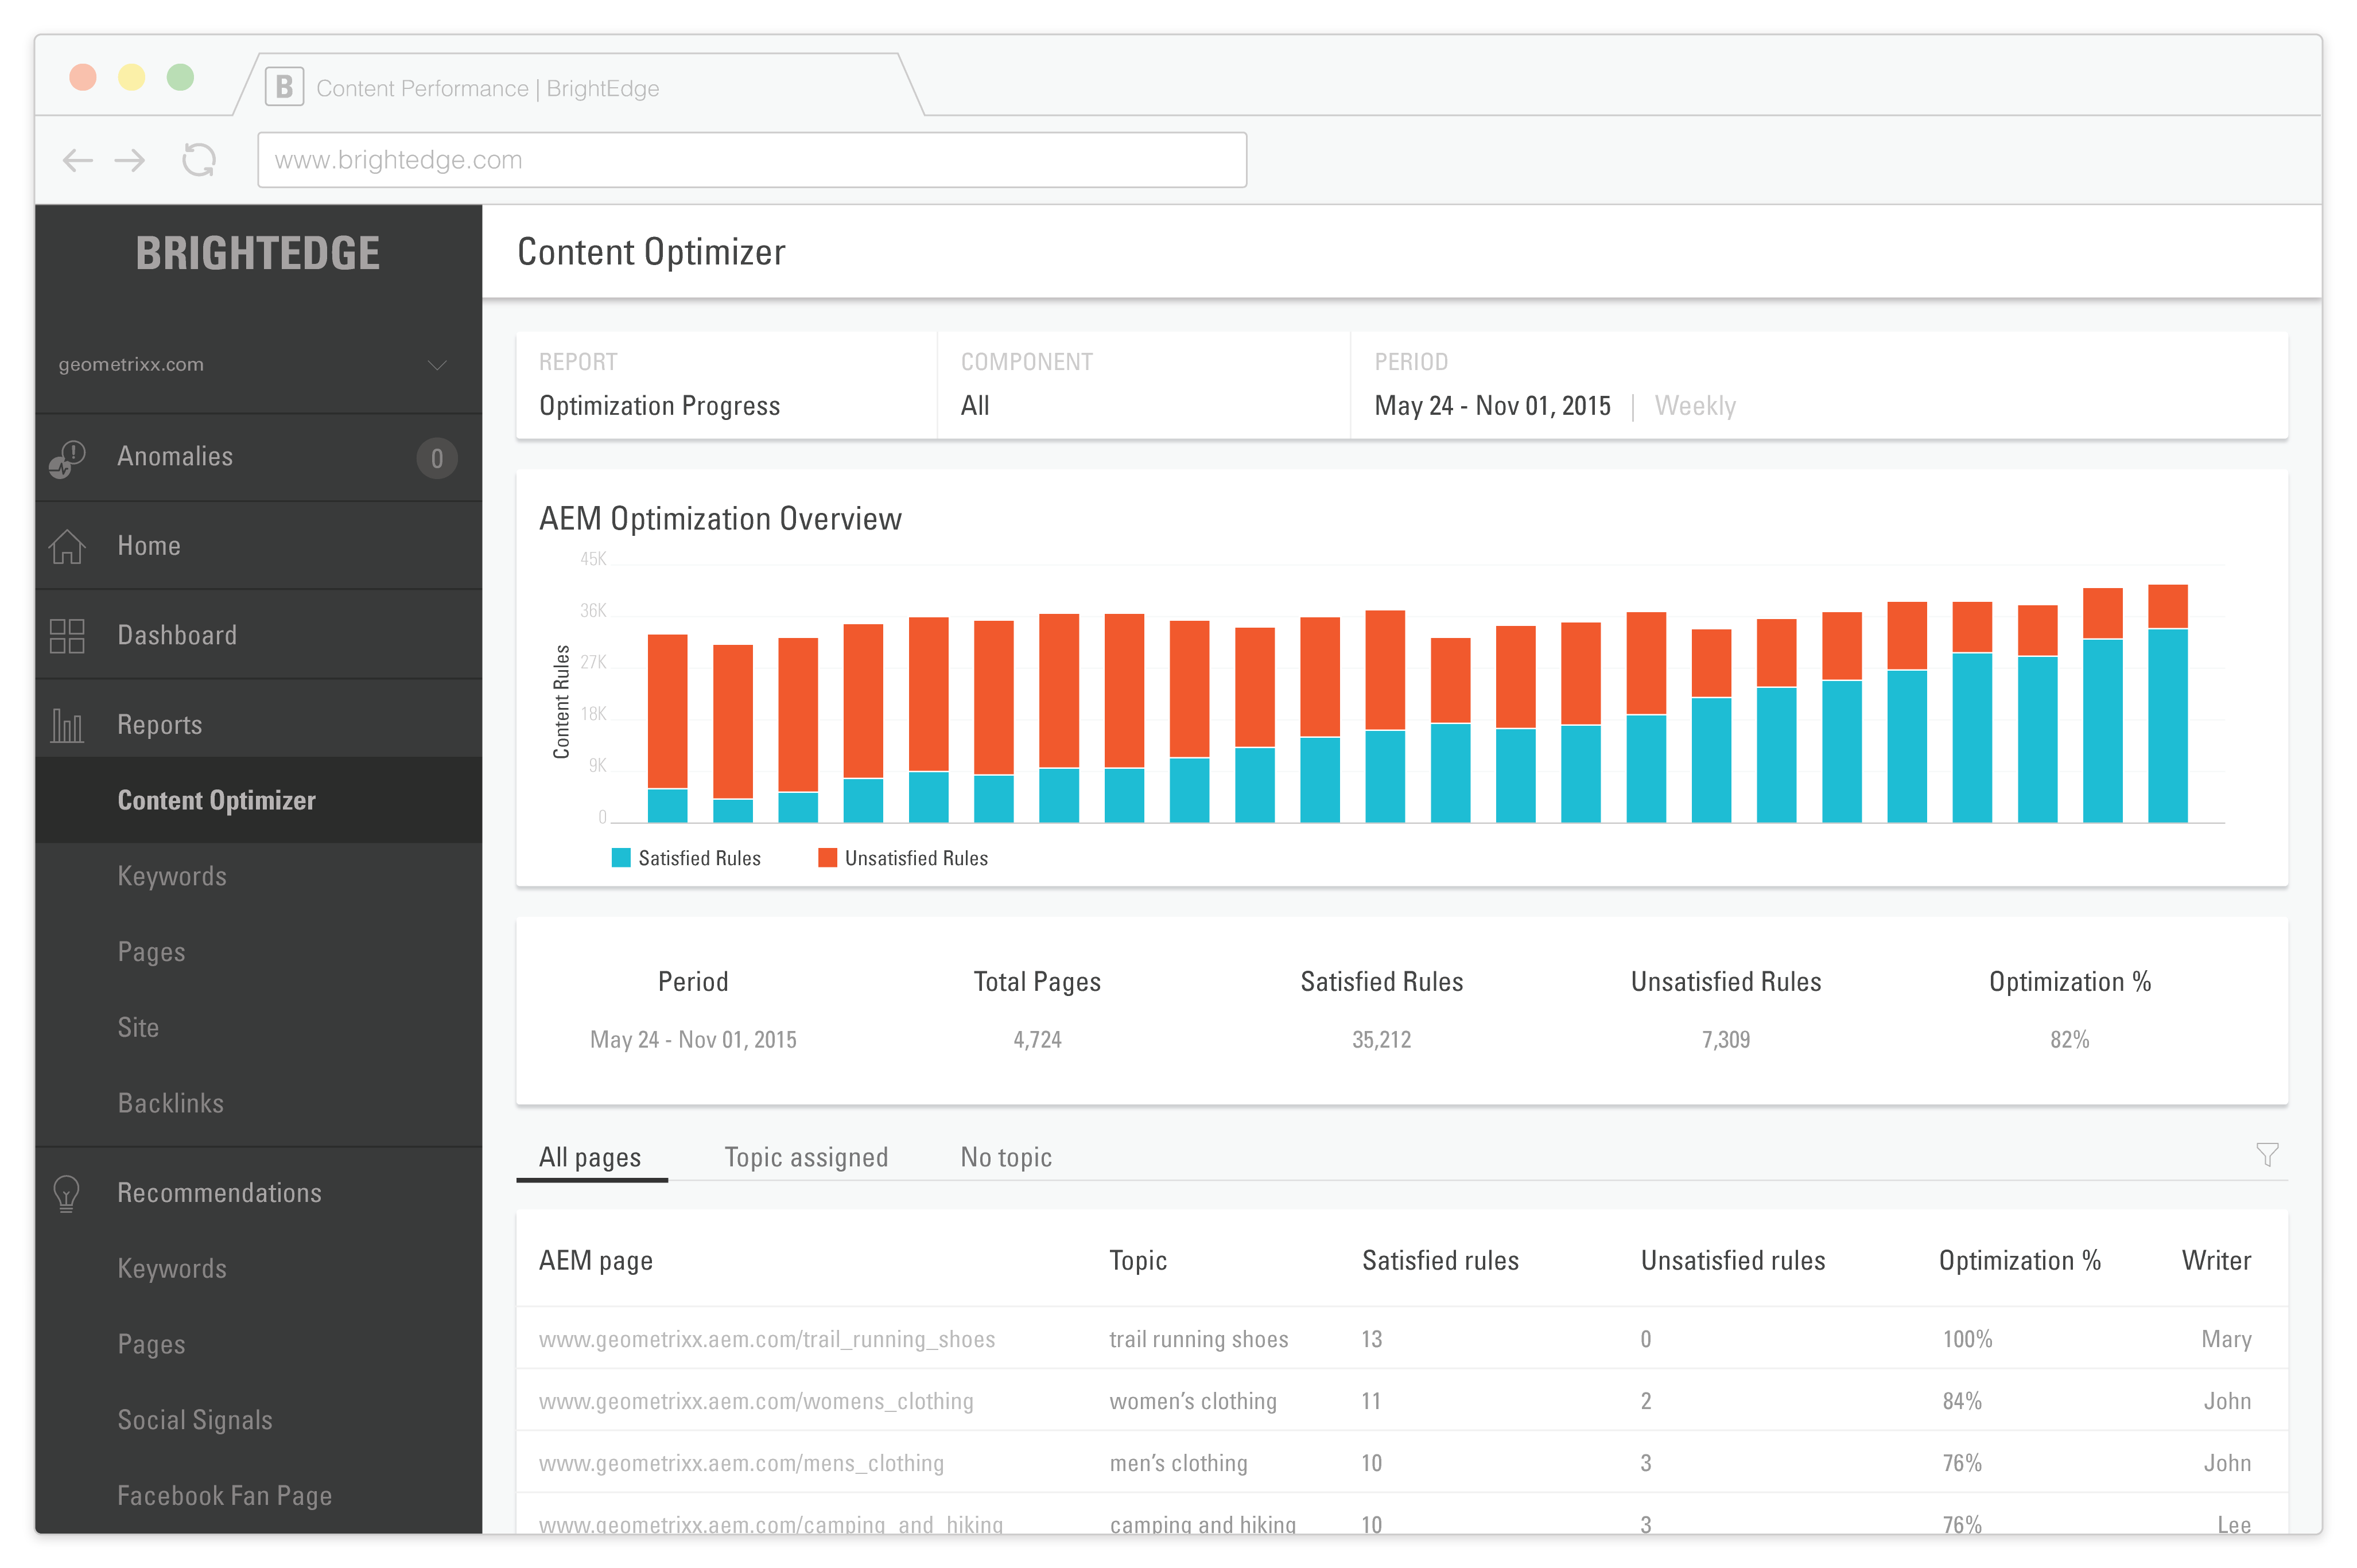
BrightEdge
Gain insights into your SEO performance, track keyword rankings, and optimize content strategies with the BrightEdge dashboard.
Funnel
Track and analyze user journey stages with the Funnel dashboard to optimize conversion rates and improve marketing strategies effectively.
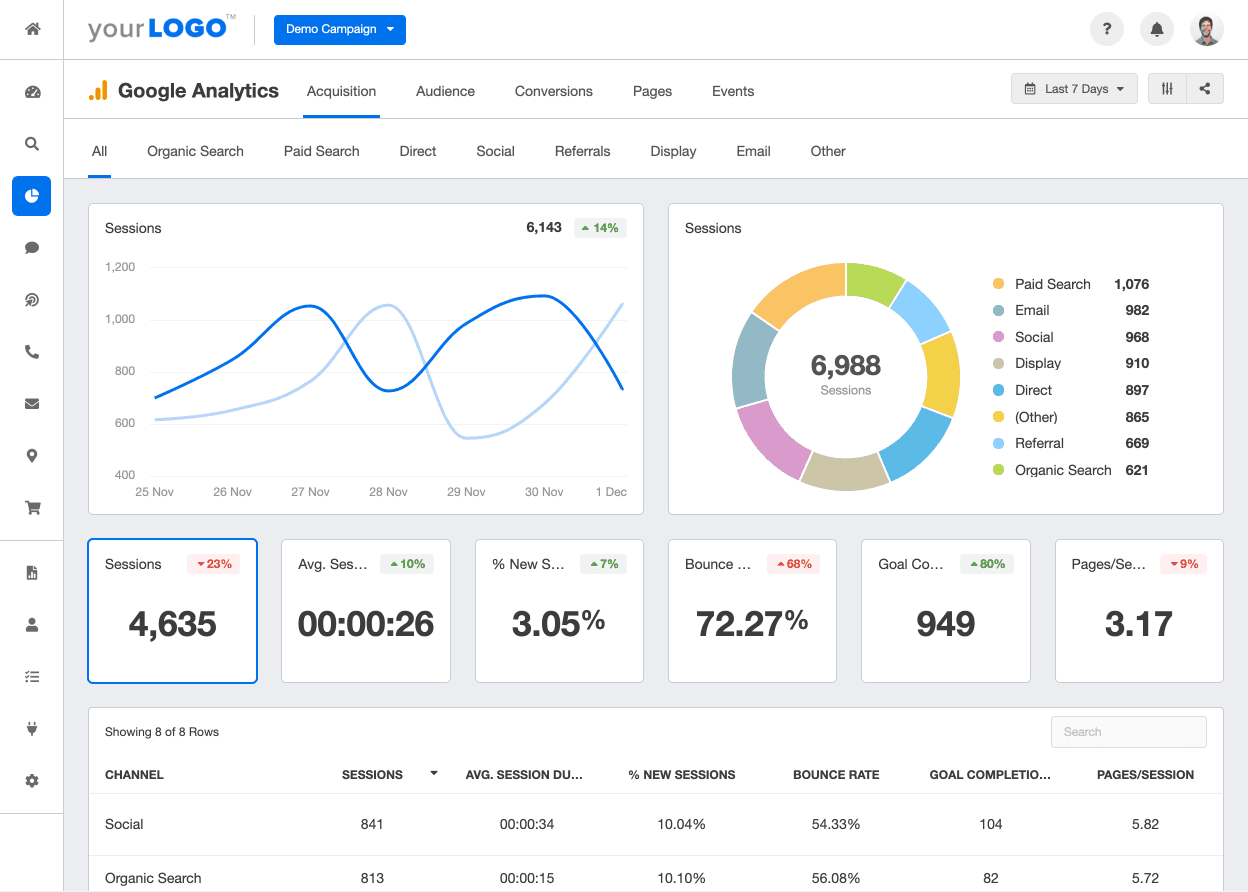
Google Analytics
Gain insights into your website's performance with this Google Analytics dashboard, offering real-time data, user behavior, and traffic sources.
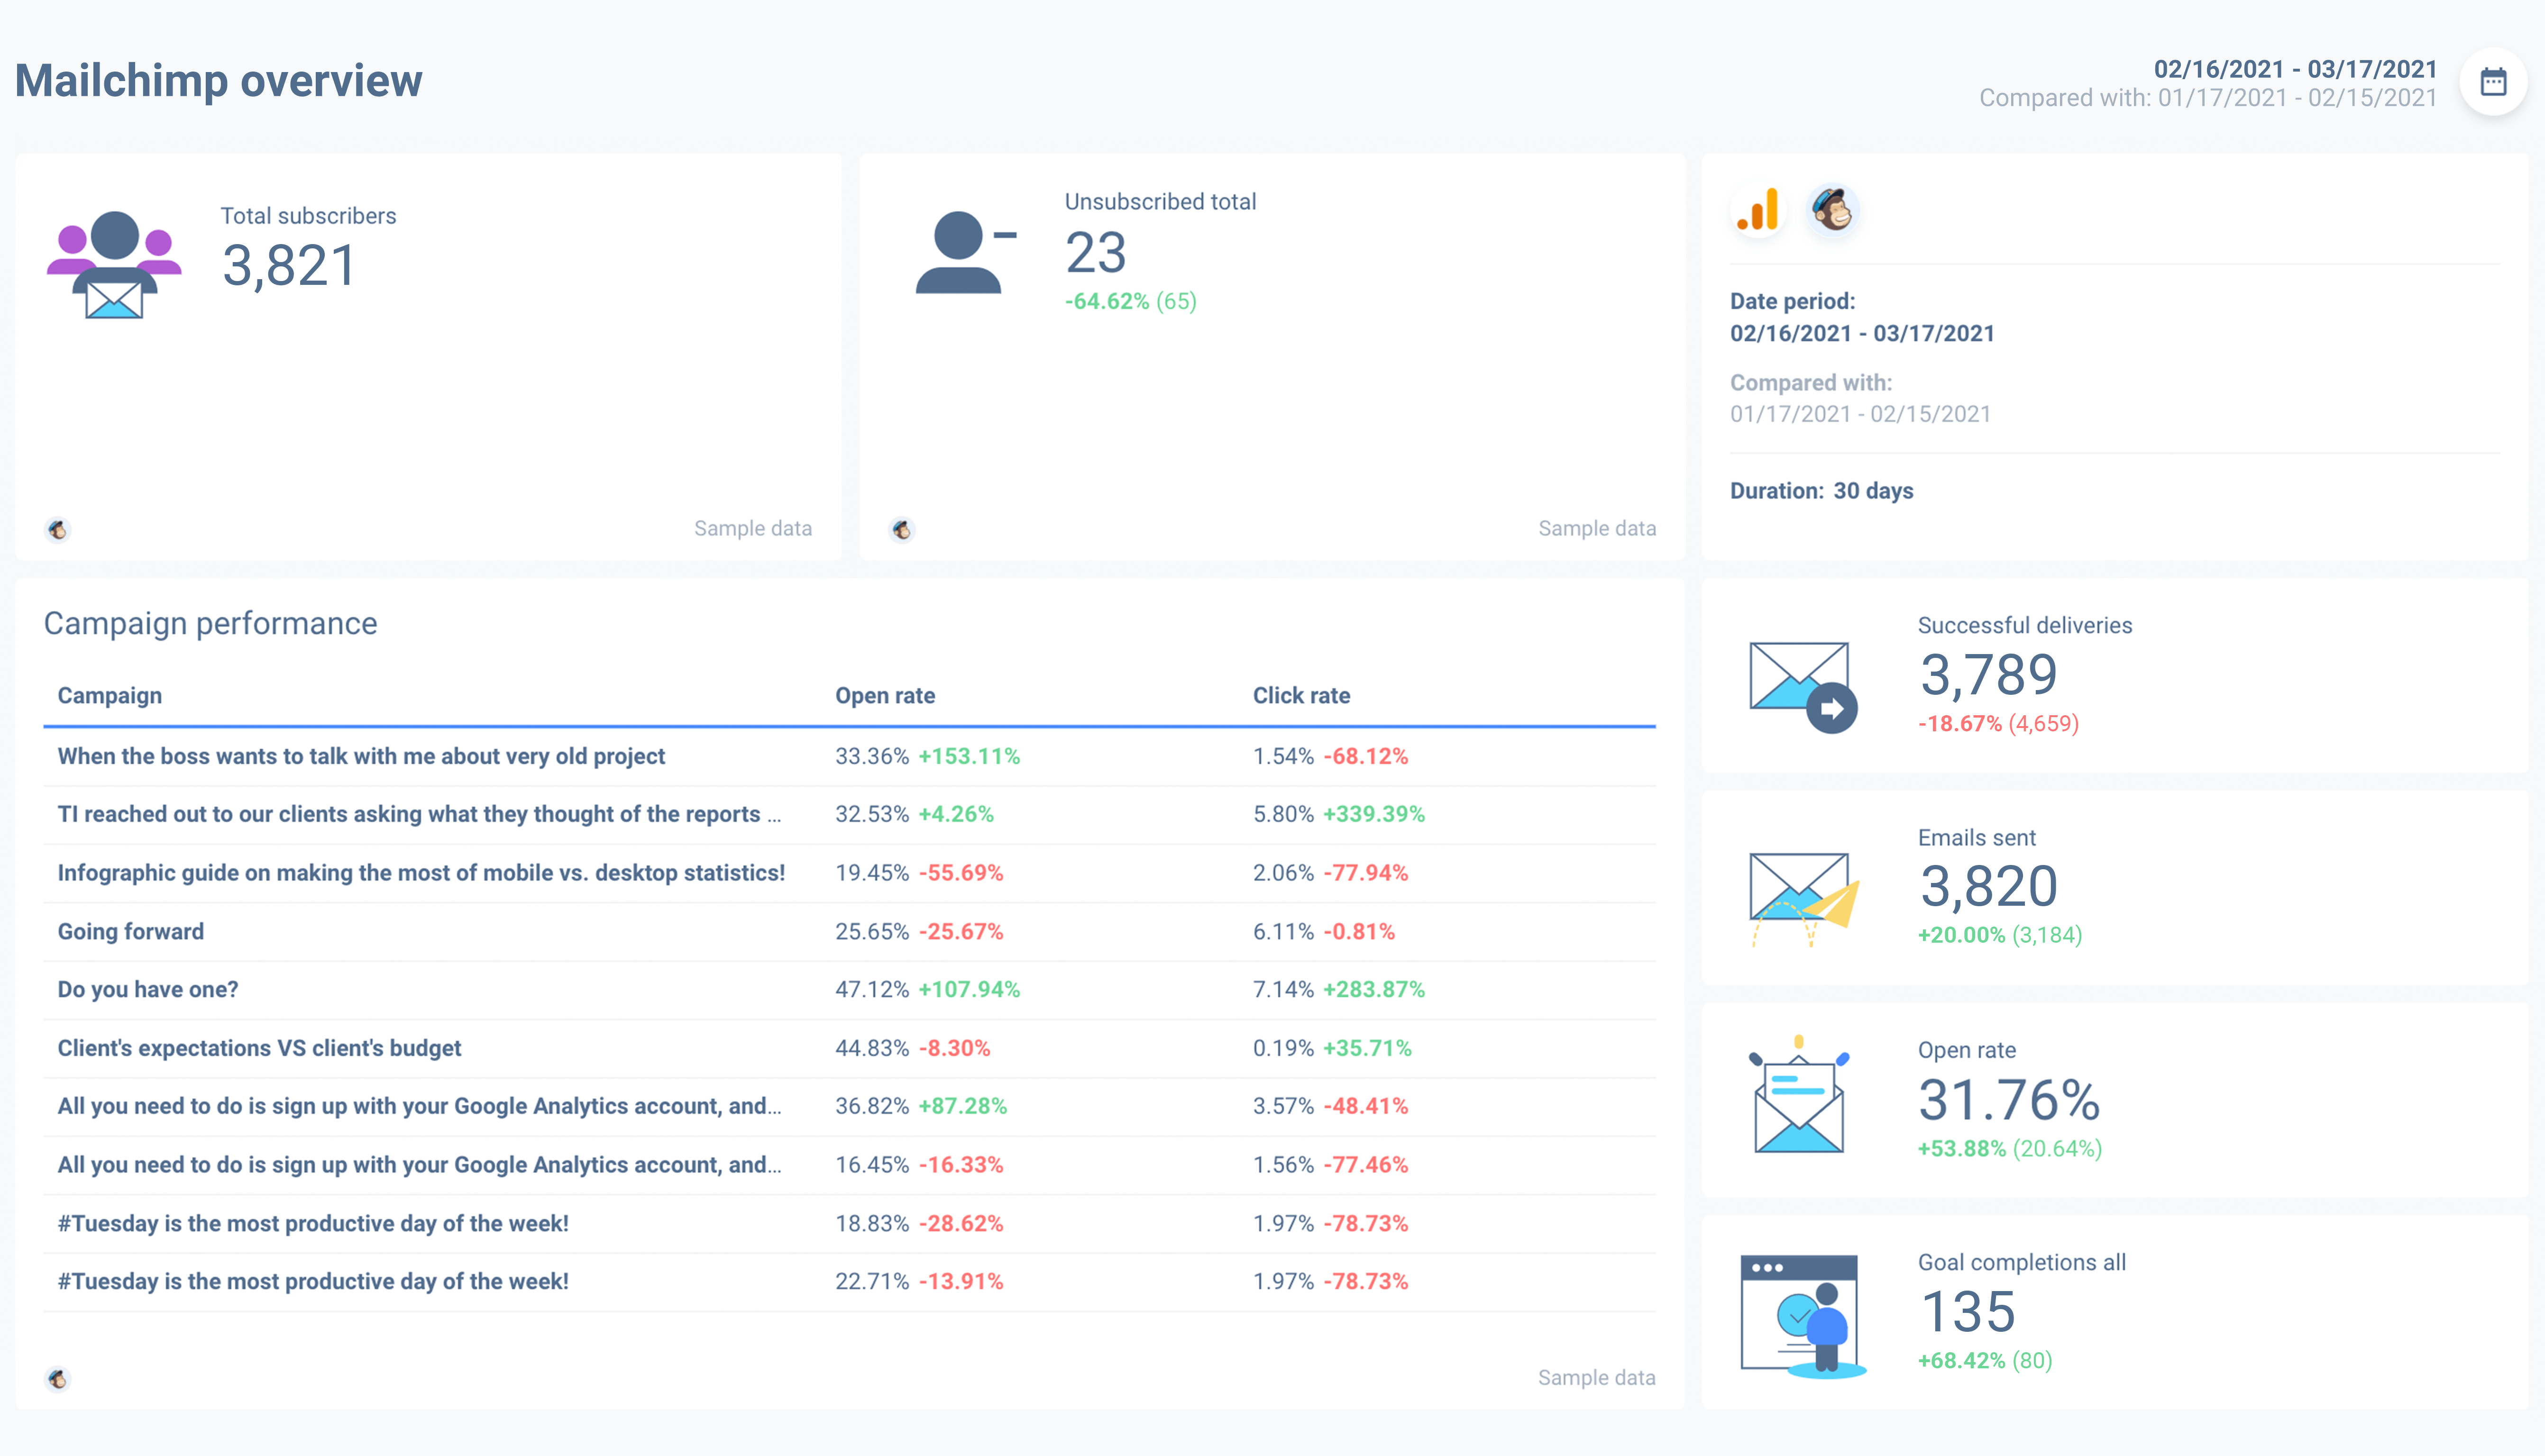
Mailchimp
Mailchimp's dashboard provides a comprehensive overview of your email campaigns, audience engagement, and marketing performance metrics.

Marketo
Gain insights into your marketing campaigns and lead management with the Marketo dashboard, designed for streamlined analysis and reporting.

Moz
Track and analyze your SEO performance with Moz's comprehensive dashboard, offering insights into rankings, backlinks, and keyword opportunities.
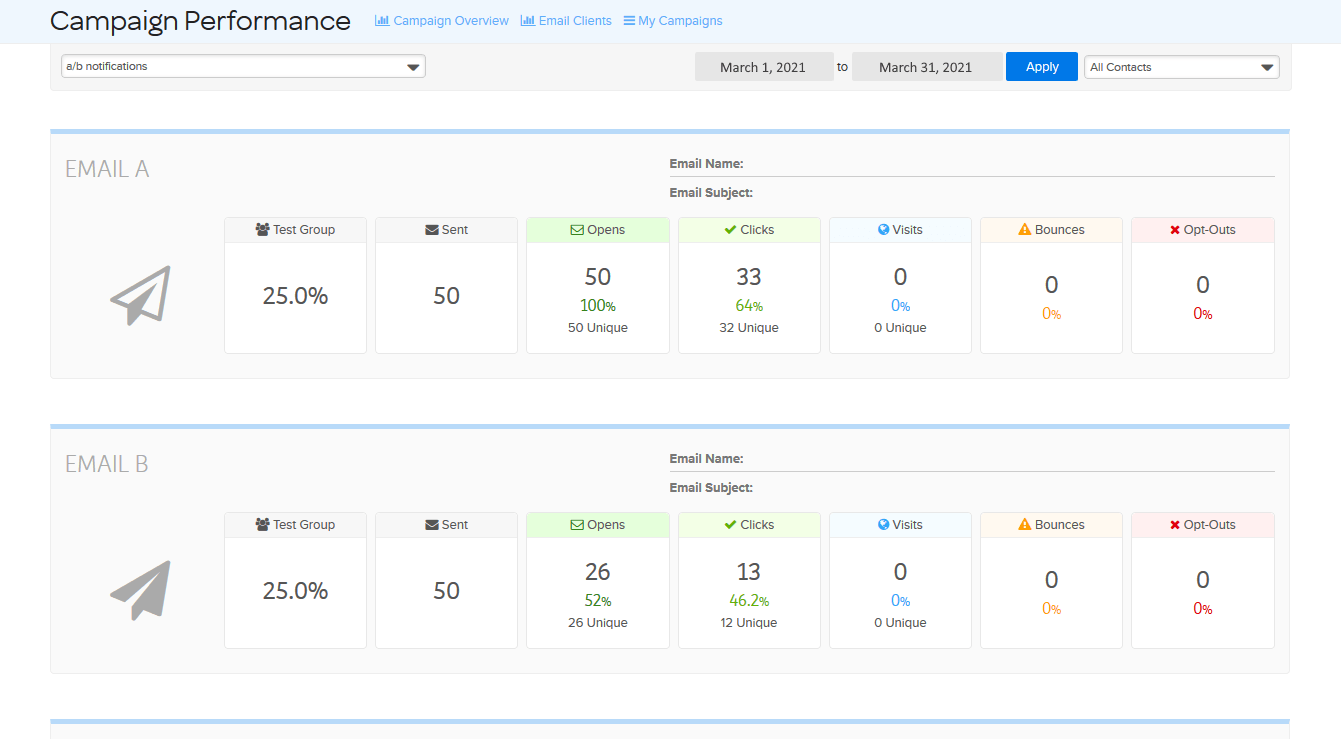
Optimizely
Optimize your digital experiences with real-time analytics, A/B testing insights, and user engagement metrics in one intuitive dashboard.
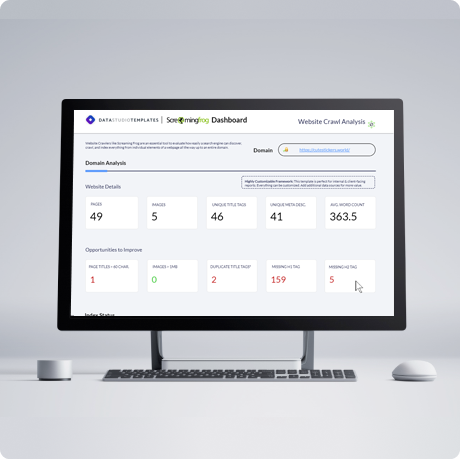
Screaming Frog
Analyze website SEO and performance metrics efficiently with the Screaming Frog dashboard, providing insights into crawl data and optimization opportunities.

SEMrush
Analyze and optimize your digital marketing strategies with SEMrush's comprehensive dashboard, offering insights into SEO, PPC, and content marketing.

Whatagraph
Whatagraph dashboard provides real-time data visualization and reporting for marketing analytics, simplifying performance tracking across multiple channels.

Adjust
The Adjust dashboard provides real-time analytics and insights for optimizing mobile app marketing campaigns and enhancing user engagement.

App Annie
Gain insights into app performance, market trends, and competitor analysis with the App Annie dashboard, designed for data-driven decision-making.

App Radar
Monitor app performance, analyze user data, and optimize marketing strategies with the App Radar dashboard for enhanced app visibility and growth.

Apple App Analytics
Gain insights into app performance with Apple App Analytics, featuring user engagement, retention, and monetization metrics in one intuitive dashboard.

Branch.io
Gain insights into user engagement and optimize your marketing strategies with the Branch.io dashboard, designed for seamless data integration and analysis.
Countly
Gain insights into user behavior, track app performance, and enhance user engagement with the comprehensive Countly analytics dashboard.

Firebase Analytics
Gain insights into user behavior and app performance with the Firebase Analytics dashboard, featuring real-time data and customizable reports.
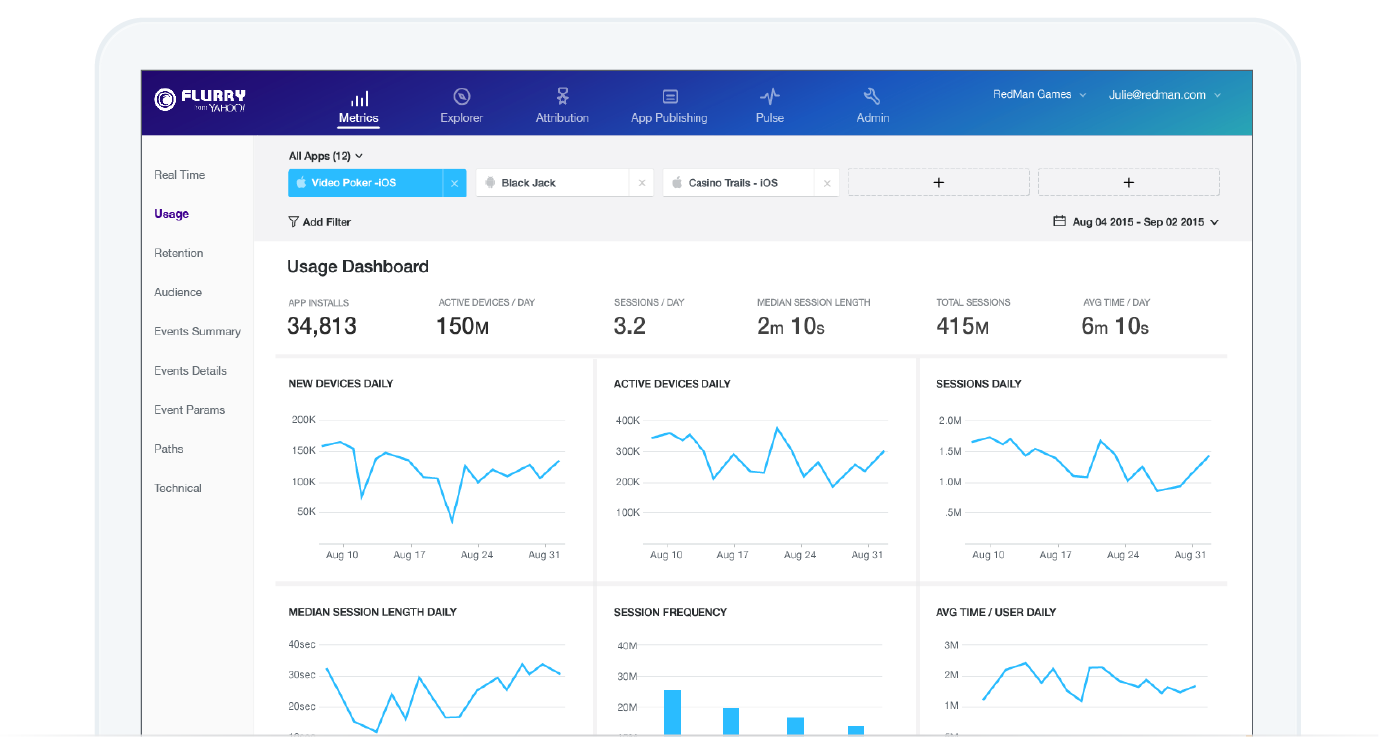
Flurry Analytics
Gain insights into app performance and user behavior with Flurry Analytics, offering real-time data to enhance your mobile strategy and engagement.
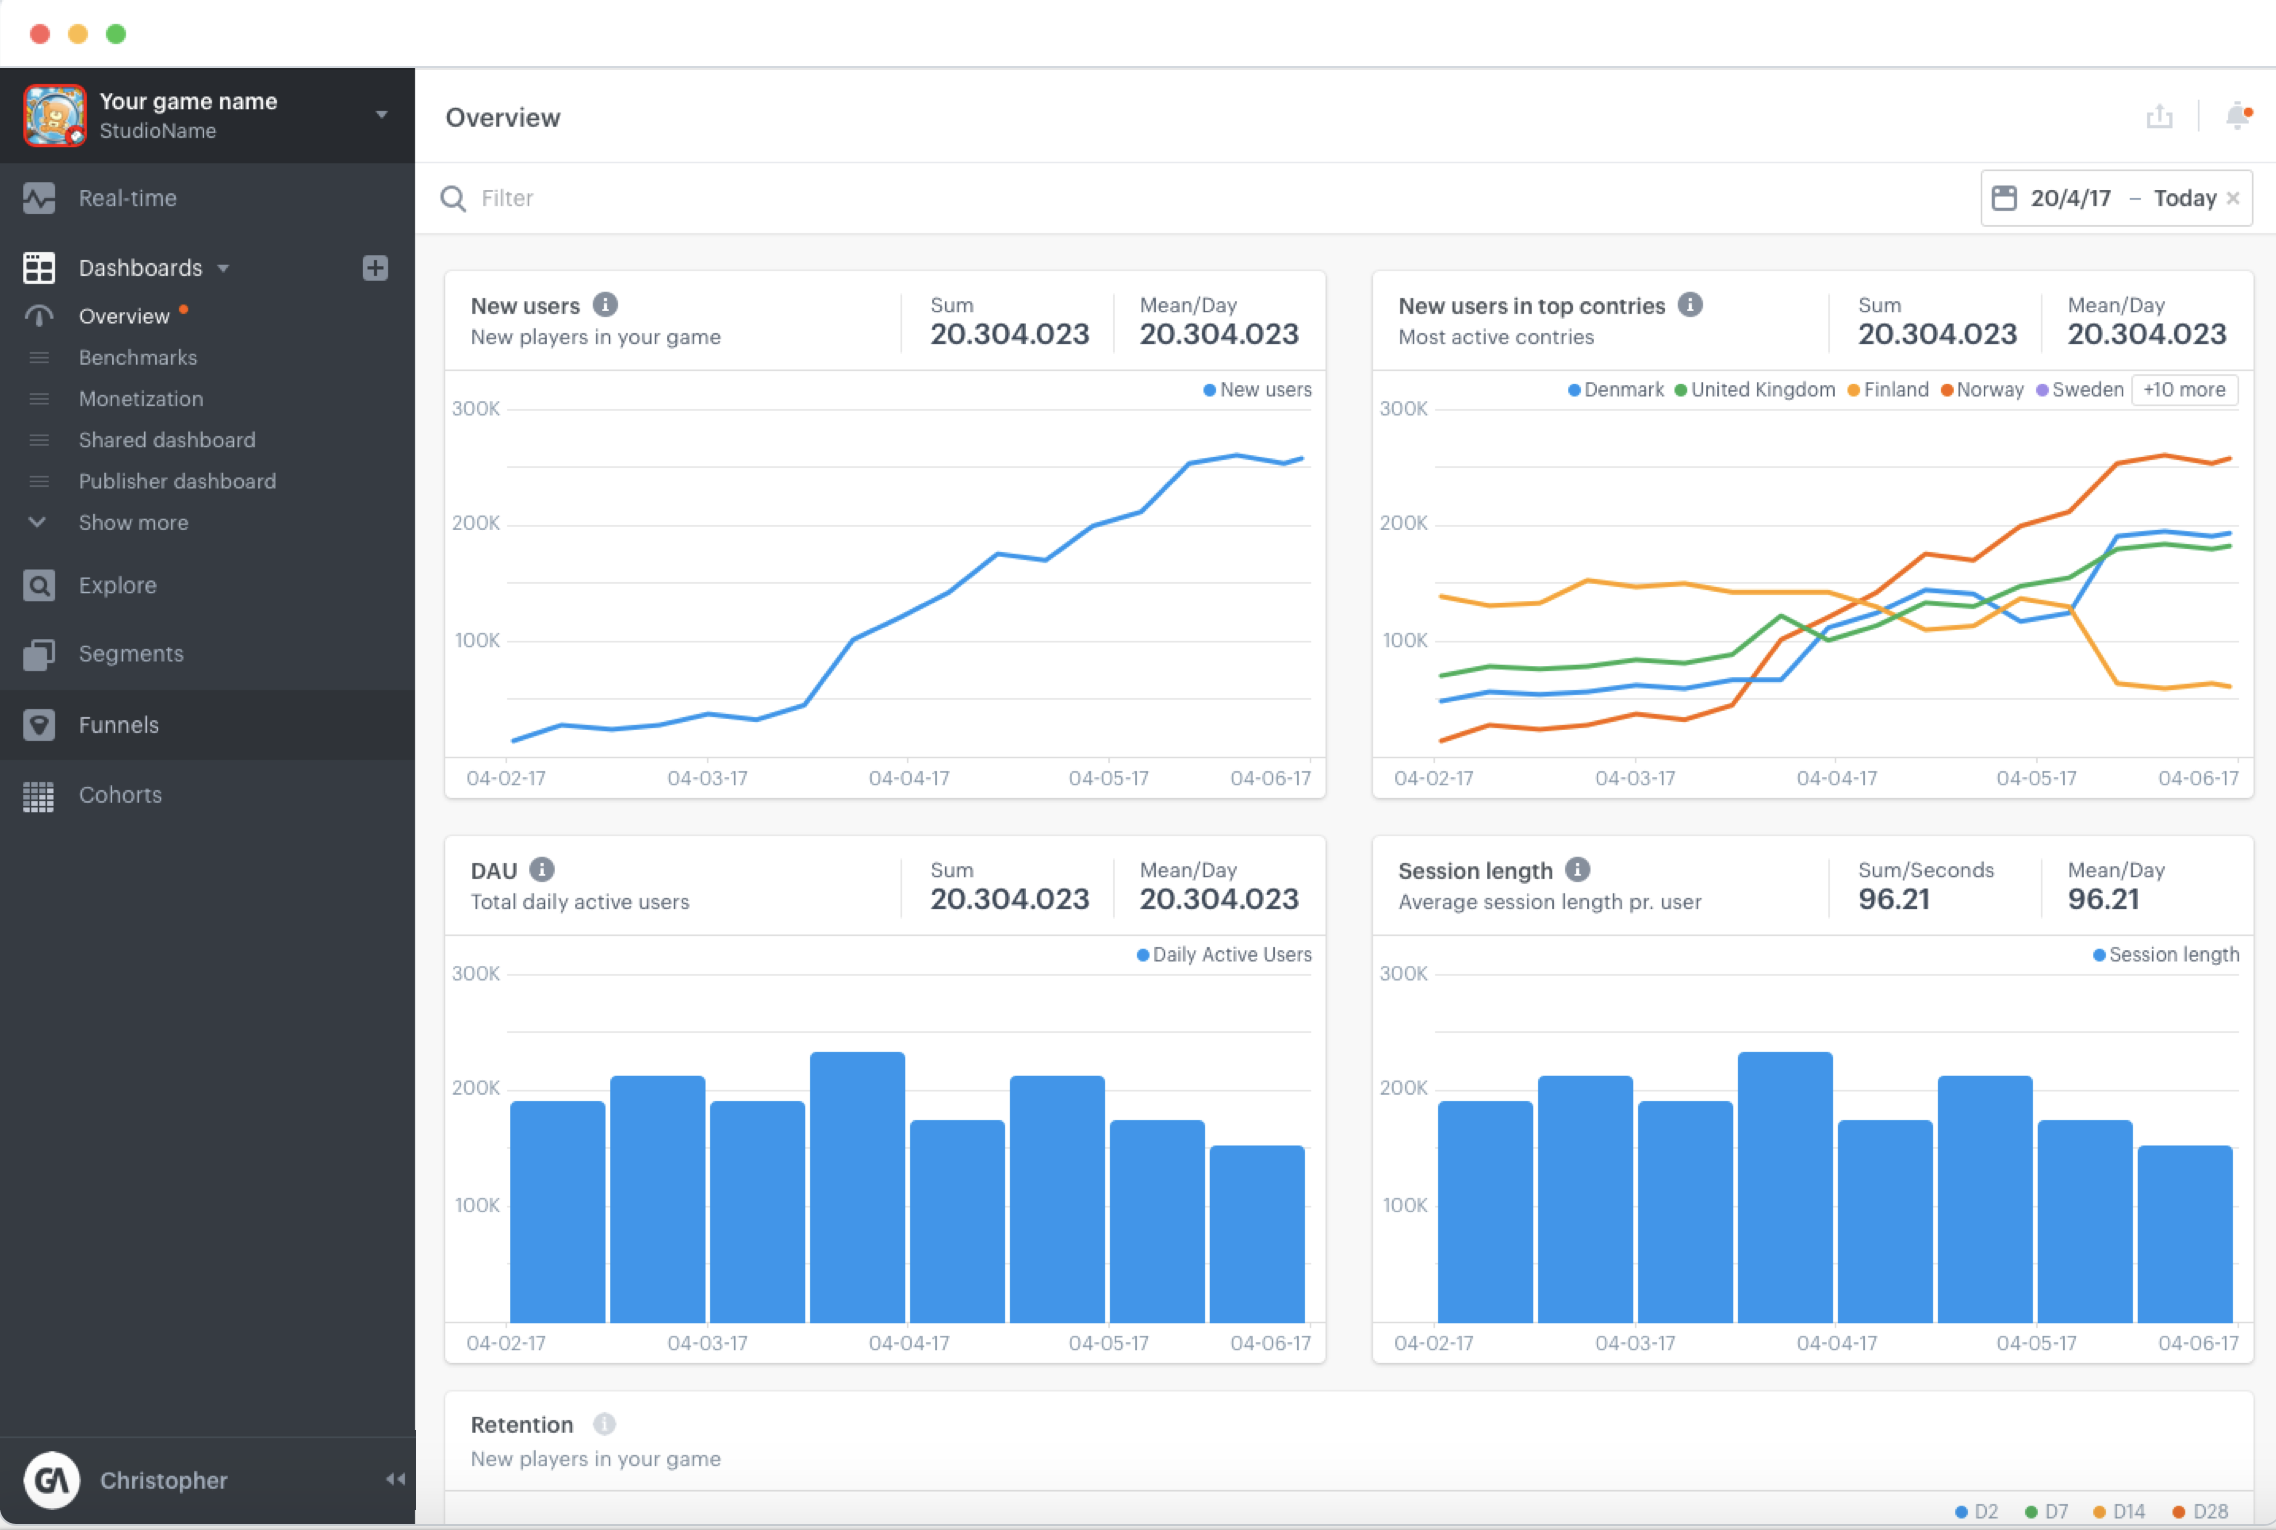
GameAnalytics
Gain insights into player behavior, retention, and monetization with the GameAnalytics dashboard, designed to optimize your gaming experience.
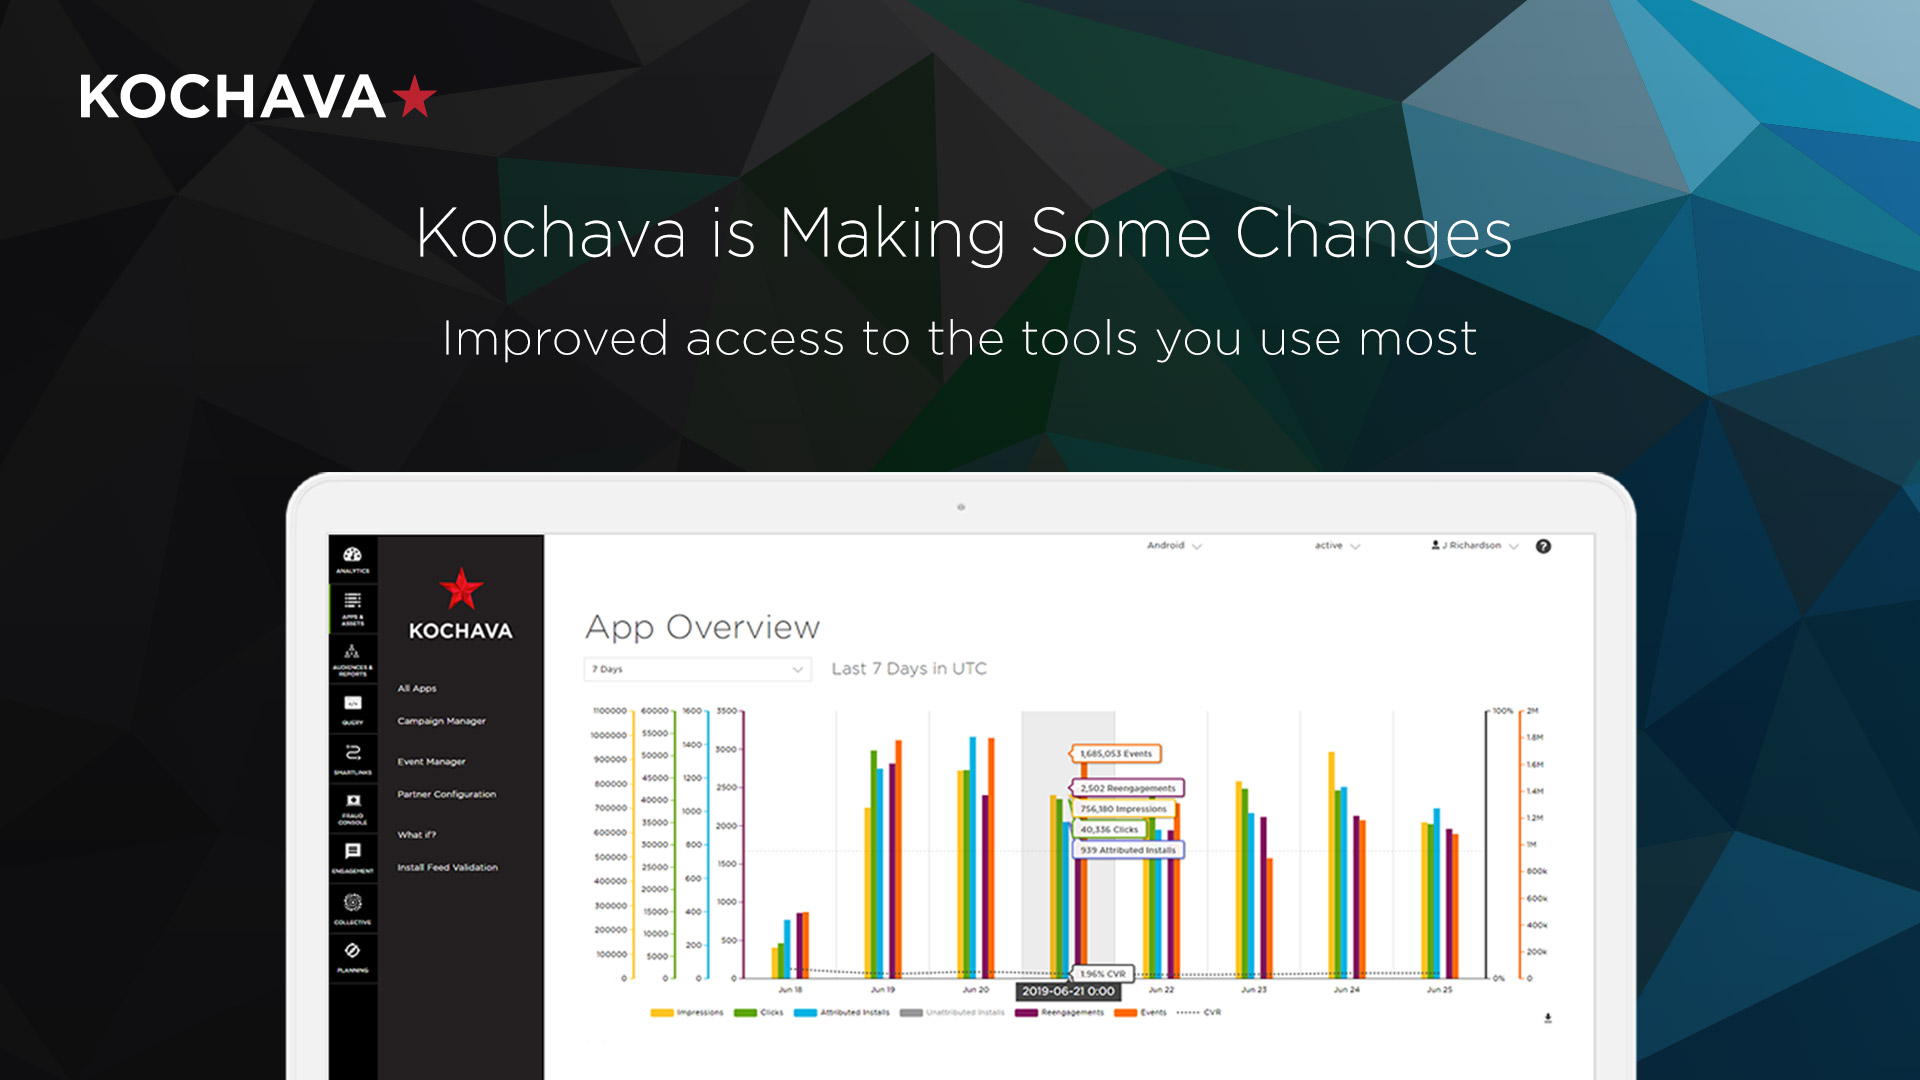
Kochava
The Kochava dashboard provides comprehensive analytics and insights for mobile app marketing, enabling data-driven decisions to optimize user engagement.

Localytics
Gain insights into user engagement, retention, and conversion with Localytics' intuitive dashboard designed for data-driven decision-making.

Sensor Tower
Monitor app performance and market trends with Sensor Tower's intuitive dashboard, offering real-time analytics and insights for strategic decision-making.

Singular
Singular's dashboard offers real-time analytics and insights, enabling data-driven decisions with customizable reports and intuitive visualizations.

Tenjin
Tenjin's dashboard provides comprehensive insights into your mobile marketing performance, enabling data-driven decisions with real-time analytics.

Asana Nonprofit Analytics
Gain insights into your nonprofit's projects and team efficiency with Asana Nonprofit Analytics, designed to enhance impact and streamline operations.
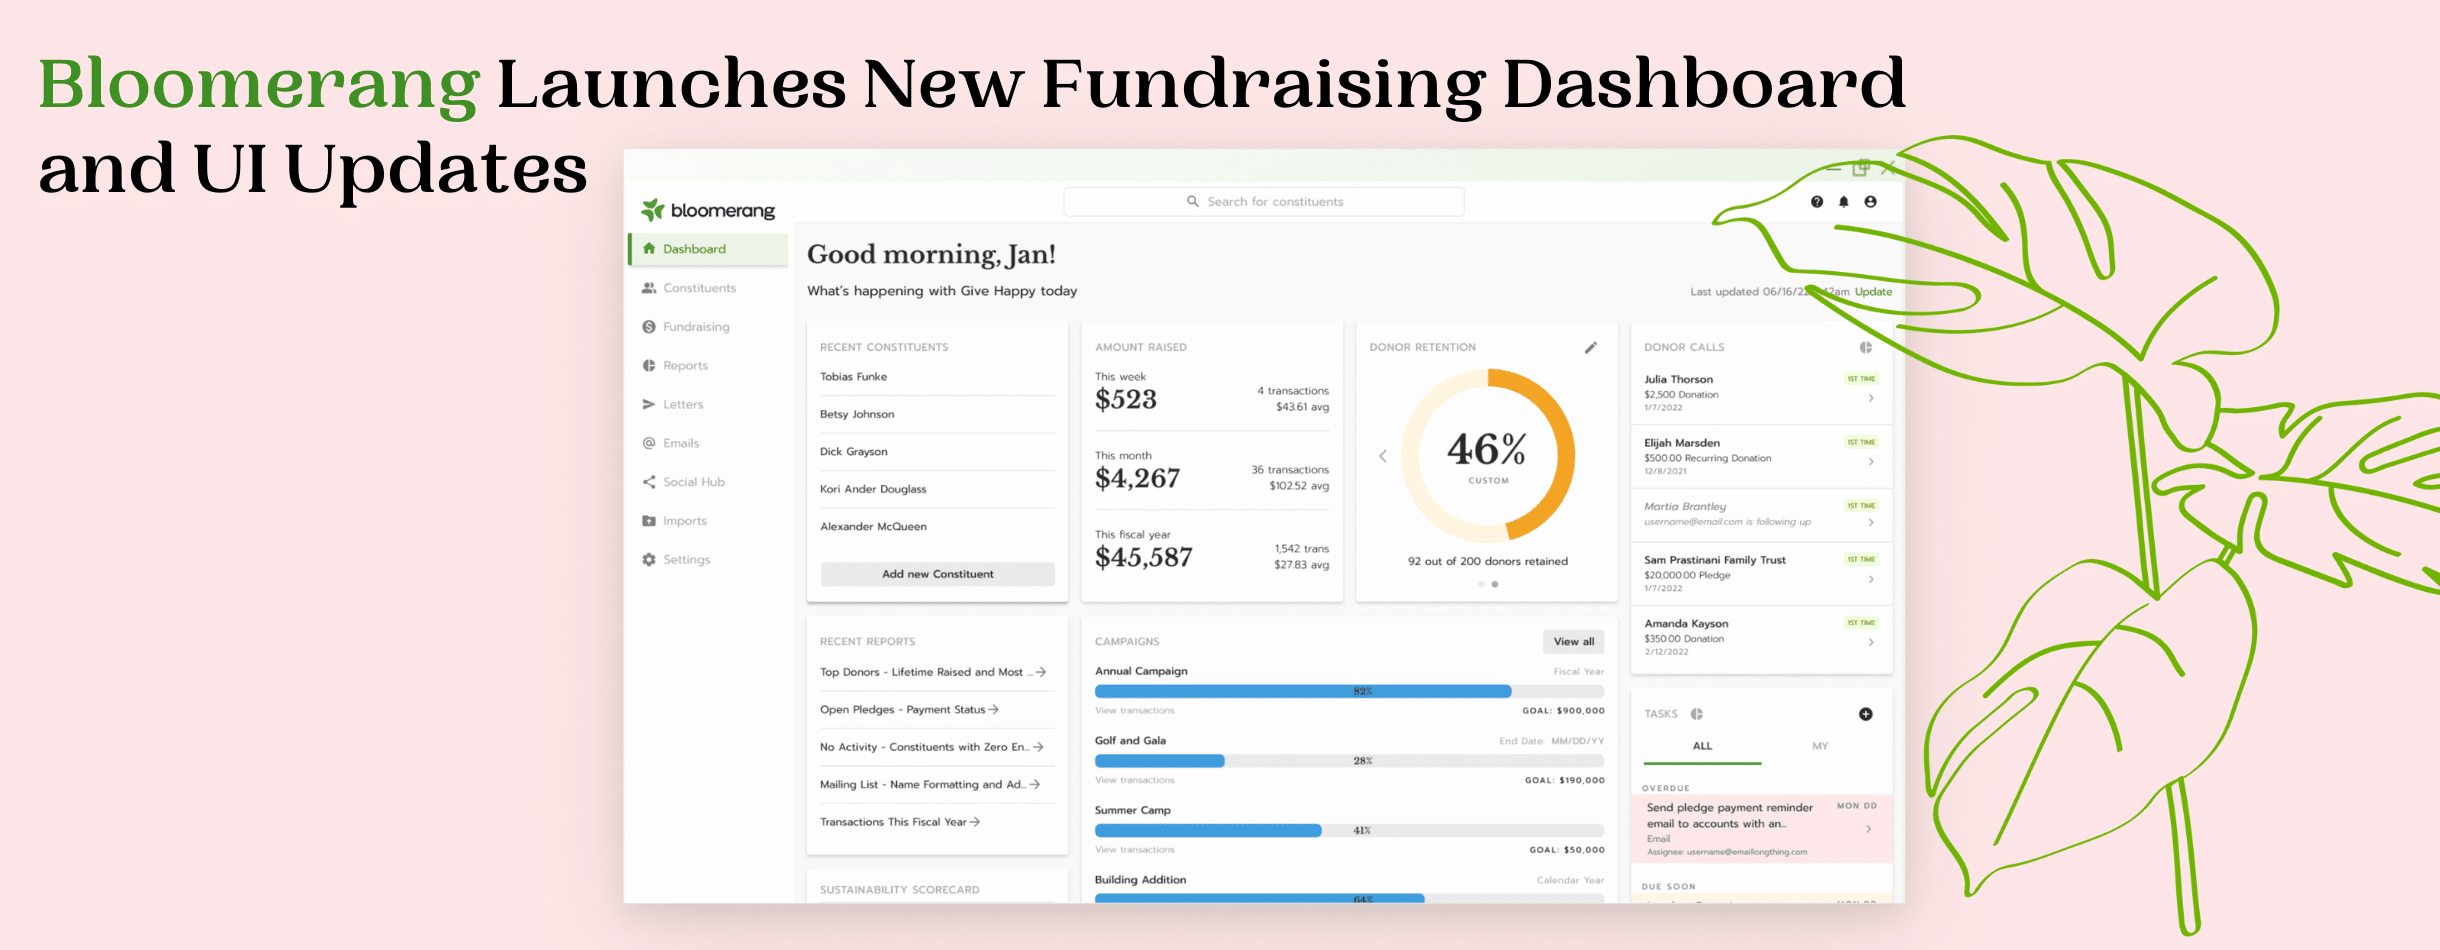
Bloomerang
The Bloomerang dashboard provides a comprehensive view of donor engagement, fundraising metrics, and campaign performance for nonprofit organizations.

Datawrapper for Nonprofits
Visualize and analyze nonprofit data effortlessly with Datawrapper for Nonprofits. Enhance decision-making with interactive charts and maps.
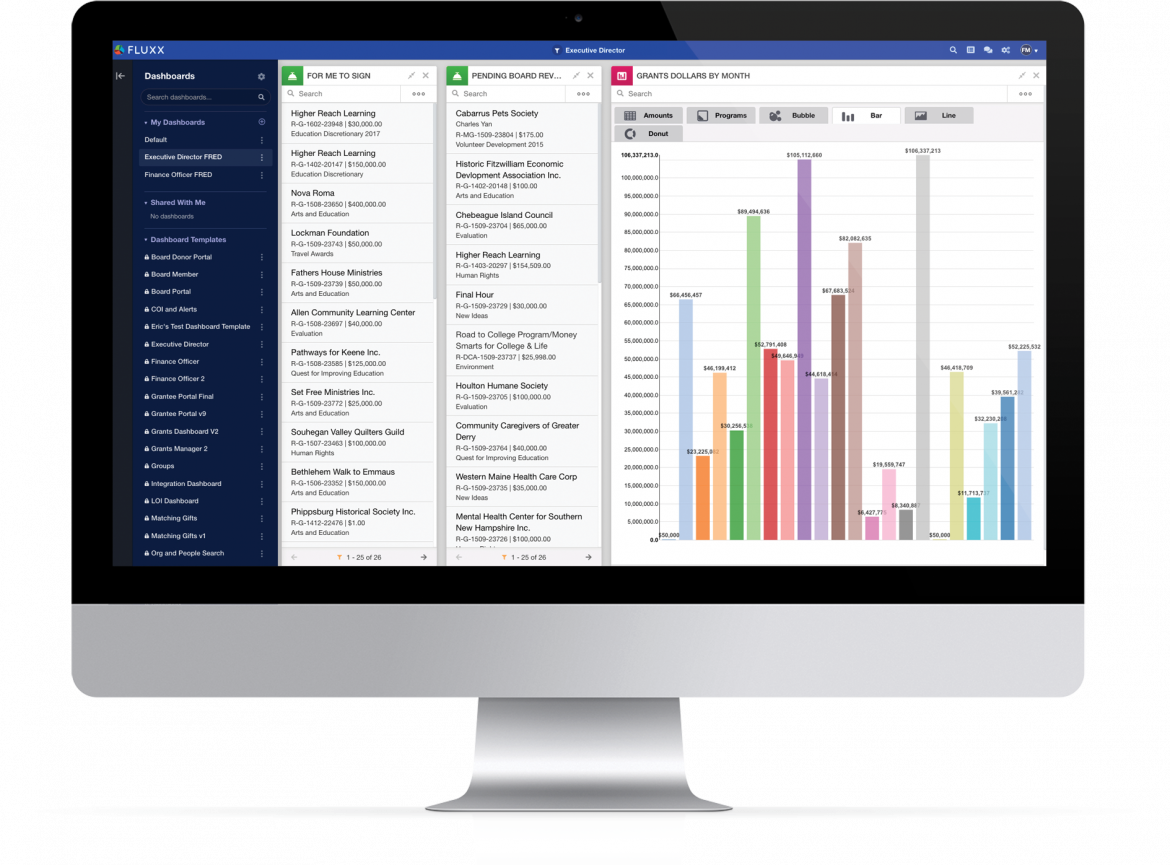
Fluxx
The Fluxx dashboard provides a comprehensive overview of grant management processes, enhancing efficiency and collaboration for organizations.
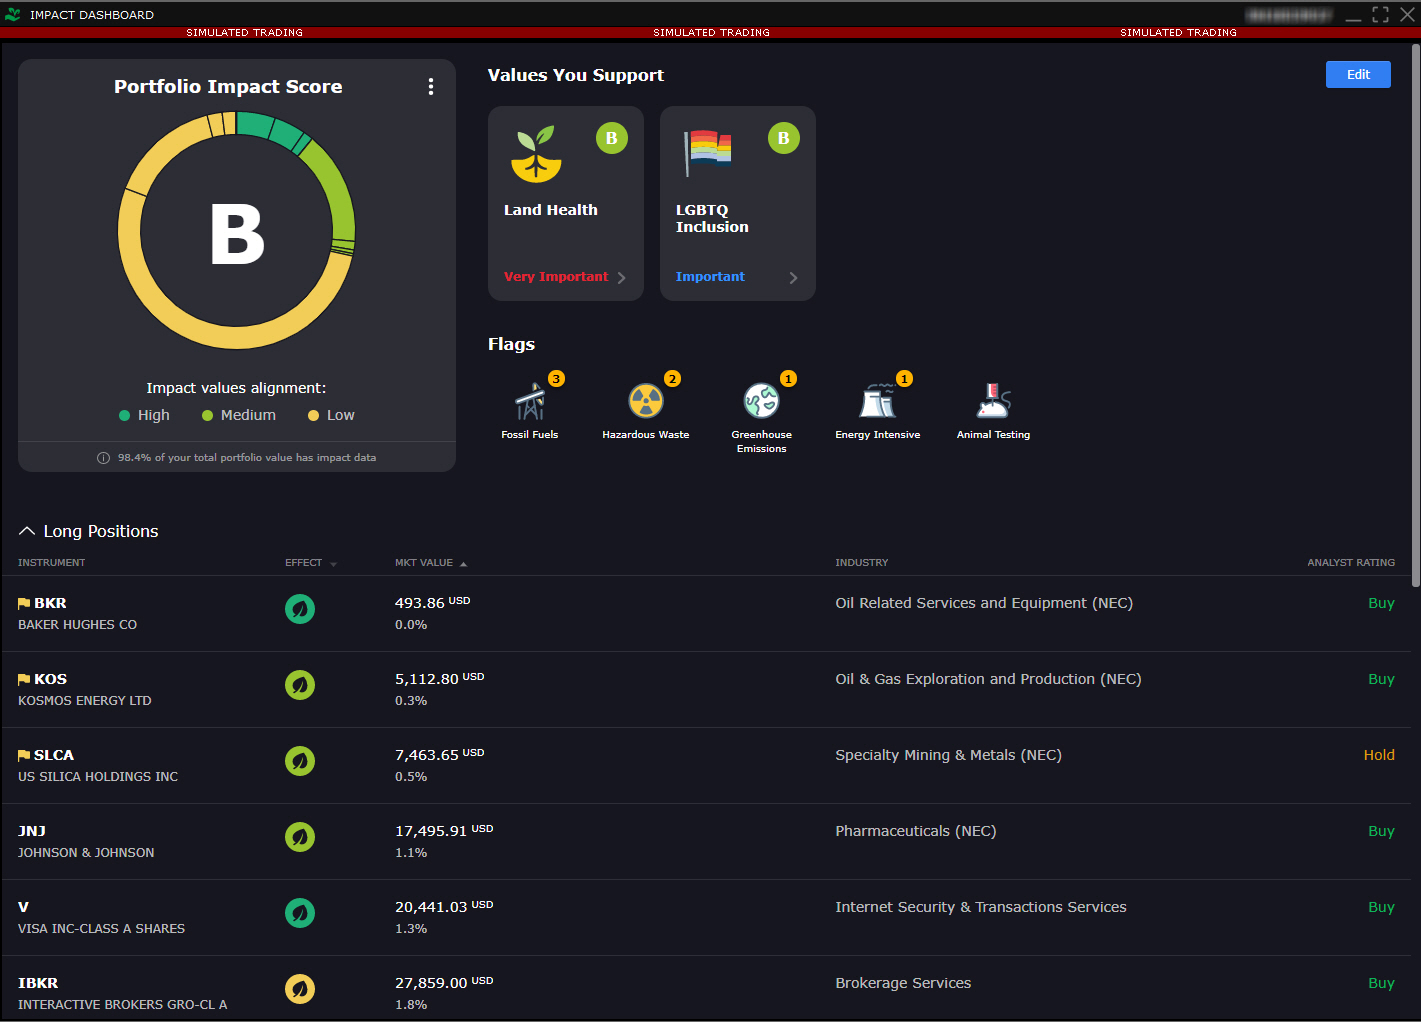
Impact Dashboard
The Impact Dashboard provides real-time insights into organizational performance, highlighting key metrics and trends to drive strategic decision-making.

Kindful Analytics
Gain insights into donor behavior, fundraising trends, and engagement metrics with the Kindful Analytics dashboard to enhance your nonprofit's impact.
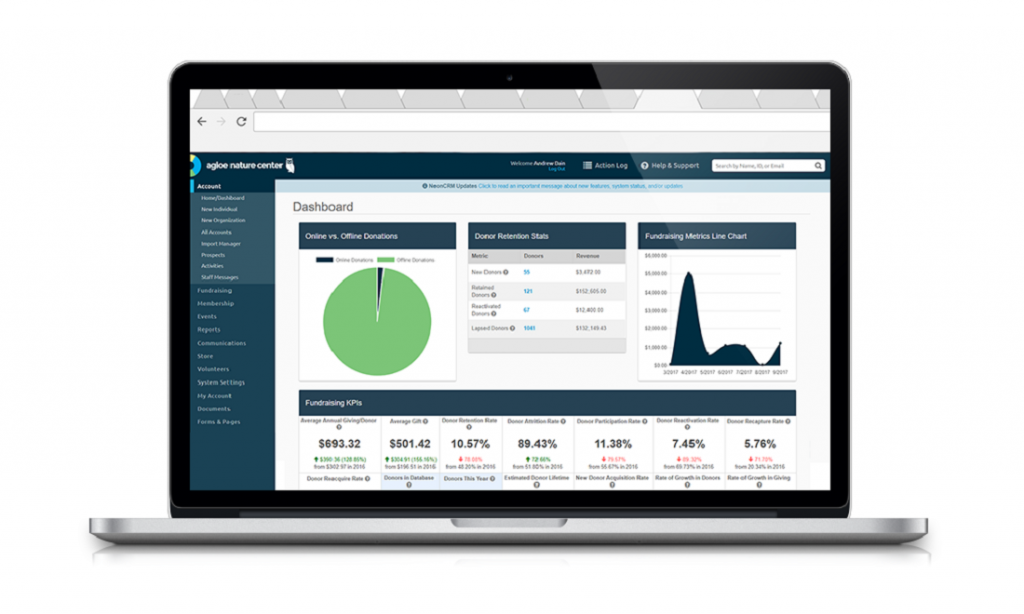
Neon CRM
Neon CRM's dashboard provides a comprehensive view of your organization's fundraising, donor management, and engagement activities.

Network for Good Analytics
Gain insights into donor behavior, fundraising trends, and campaign performance with the Network for Good Analytics dashboard.
OneCause Analytics
Gain insights into your fundraising efforts with OneCause Analytics, offering real-time data visualization and performance tracking for nonprofits.

Power BI for Nonprofits
Empower your nonprofit with data-driven insights using Power BI. Visualize donations, track volunteer hours, and optimize program impact efficiently.

Raiser’s Edge NXT
Experience seamless donor management and insightful analytics with the Raiser’s Edge NXT dashboard, designed for nonprofit efficiency and growth.
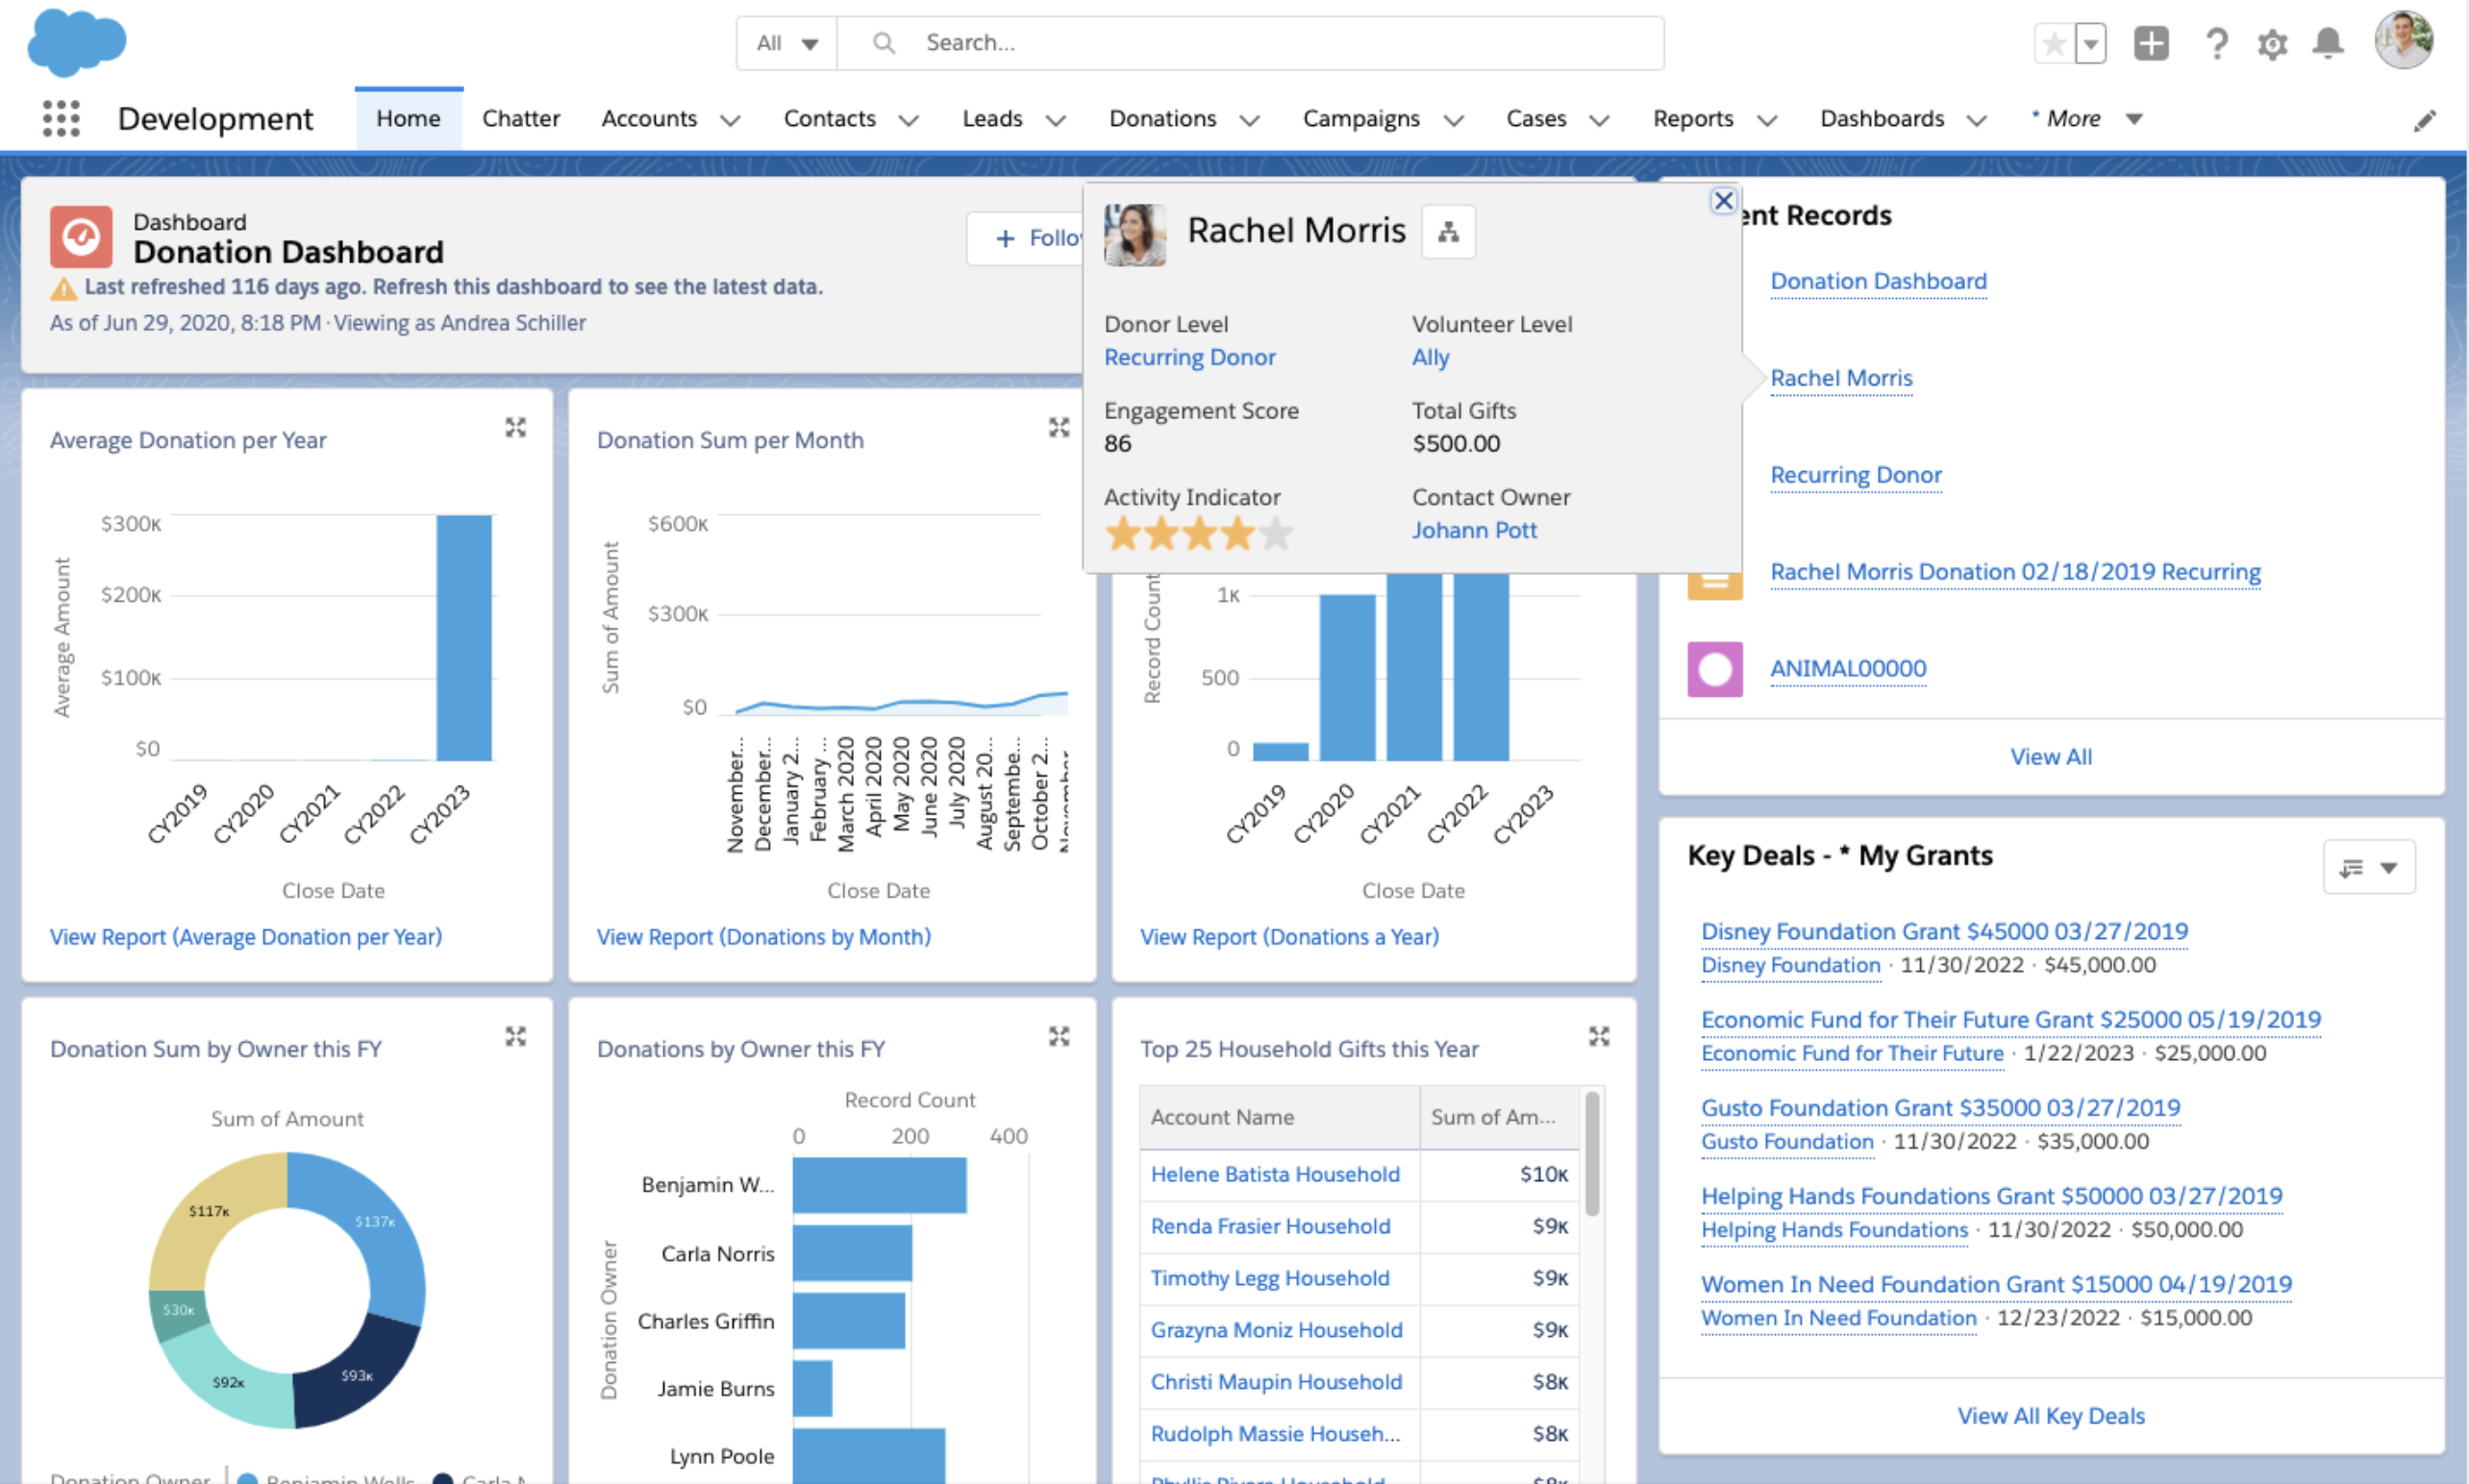
Salesforce Nonprofit Cloud
Streamline nonprofit operations with Salesforce Nonprofit Cloud dashboard, enhancing donor management, fundraising, and mission impact.
Social Solutions Apricot
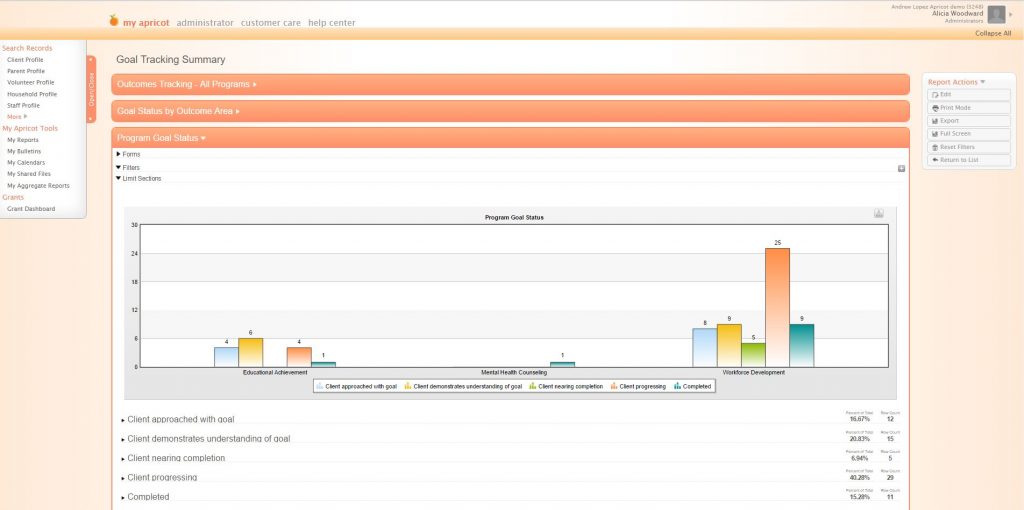
The Social Solutions Apricot dashboard offers a comprehensive view of client data, program outcomes, and performance metrics for informed decision-making.

Tableau for Nonprofits
Empower your nonprofit with data-driven insights using Tableau for Nonprofits, designed to enhance decision-making and optimize resource allocation.

Airtable
Streamline your project management and collaboration with Airtable's customizable dashboard, offering real-time data insights and seamless team integration.

Asana
Streamline your project management with Asana's dashboard, offering real-time insights, task tracking, and team collaboration in one intuitive interface.

Basecamp
Basecamp's dashboard offers a streamlined view of projects, tasks, and team communication to boost productivity and collaboration efficiently.
ClickUp
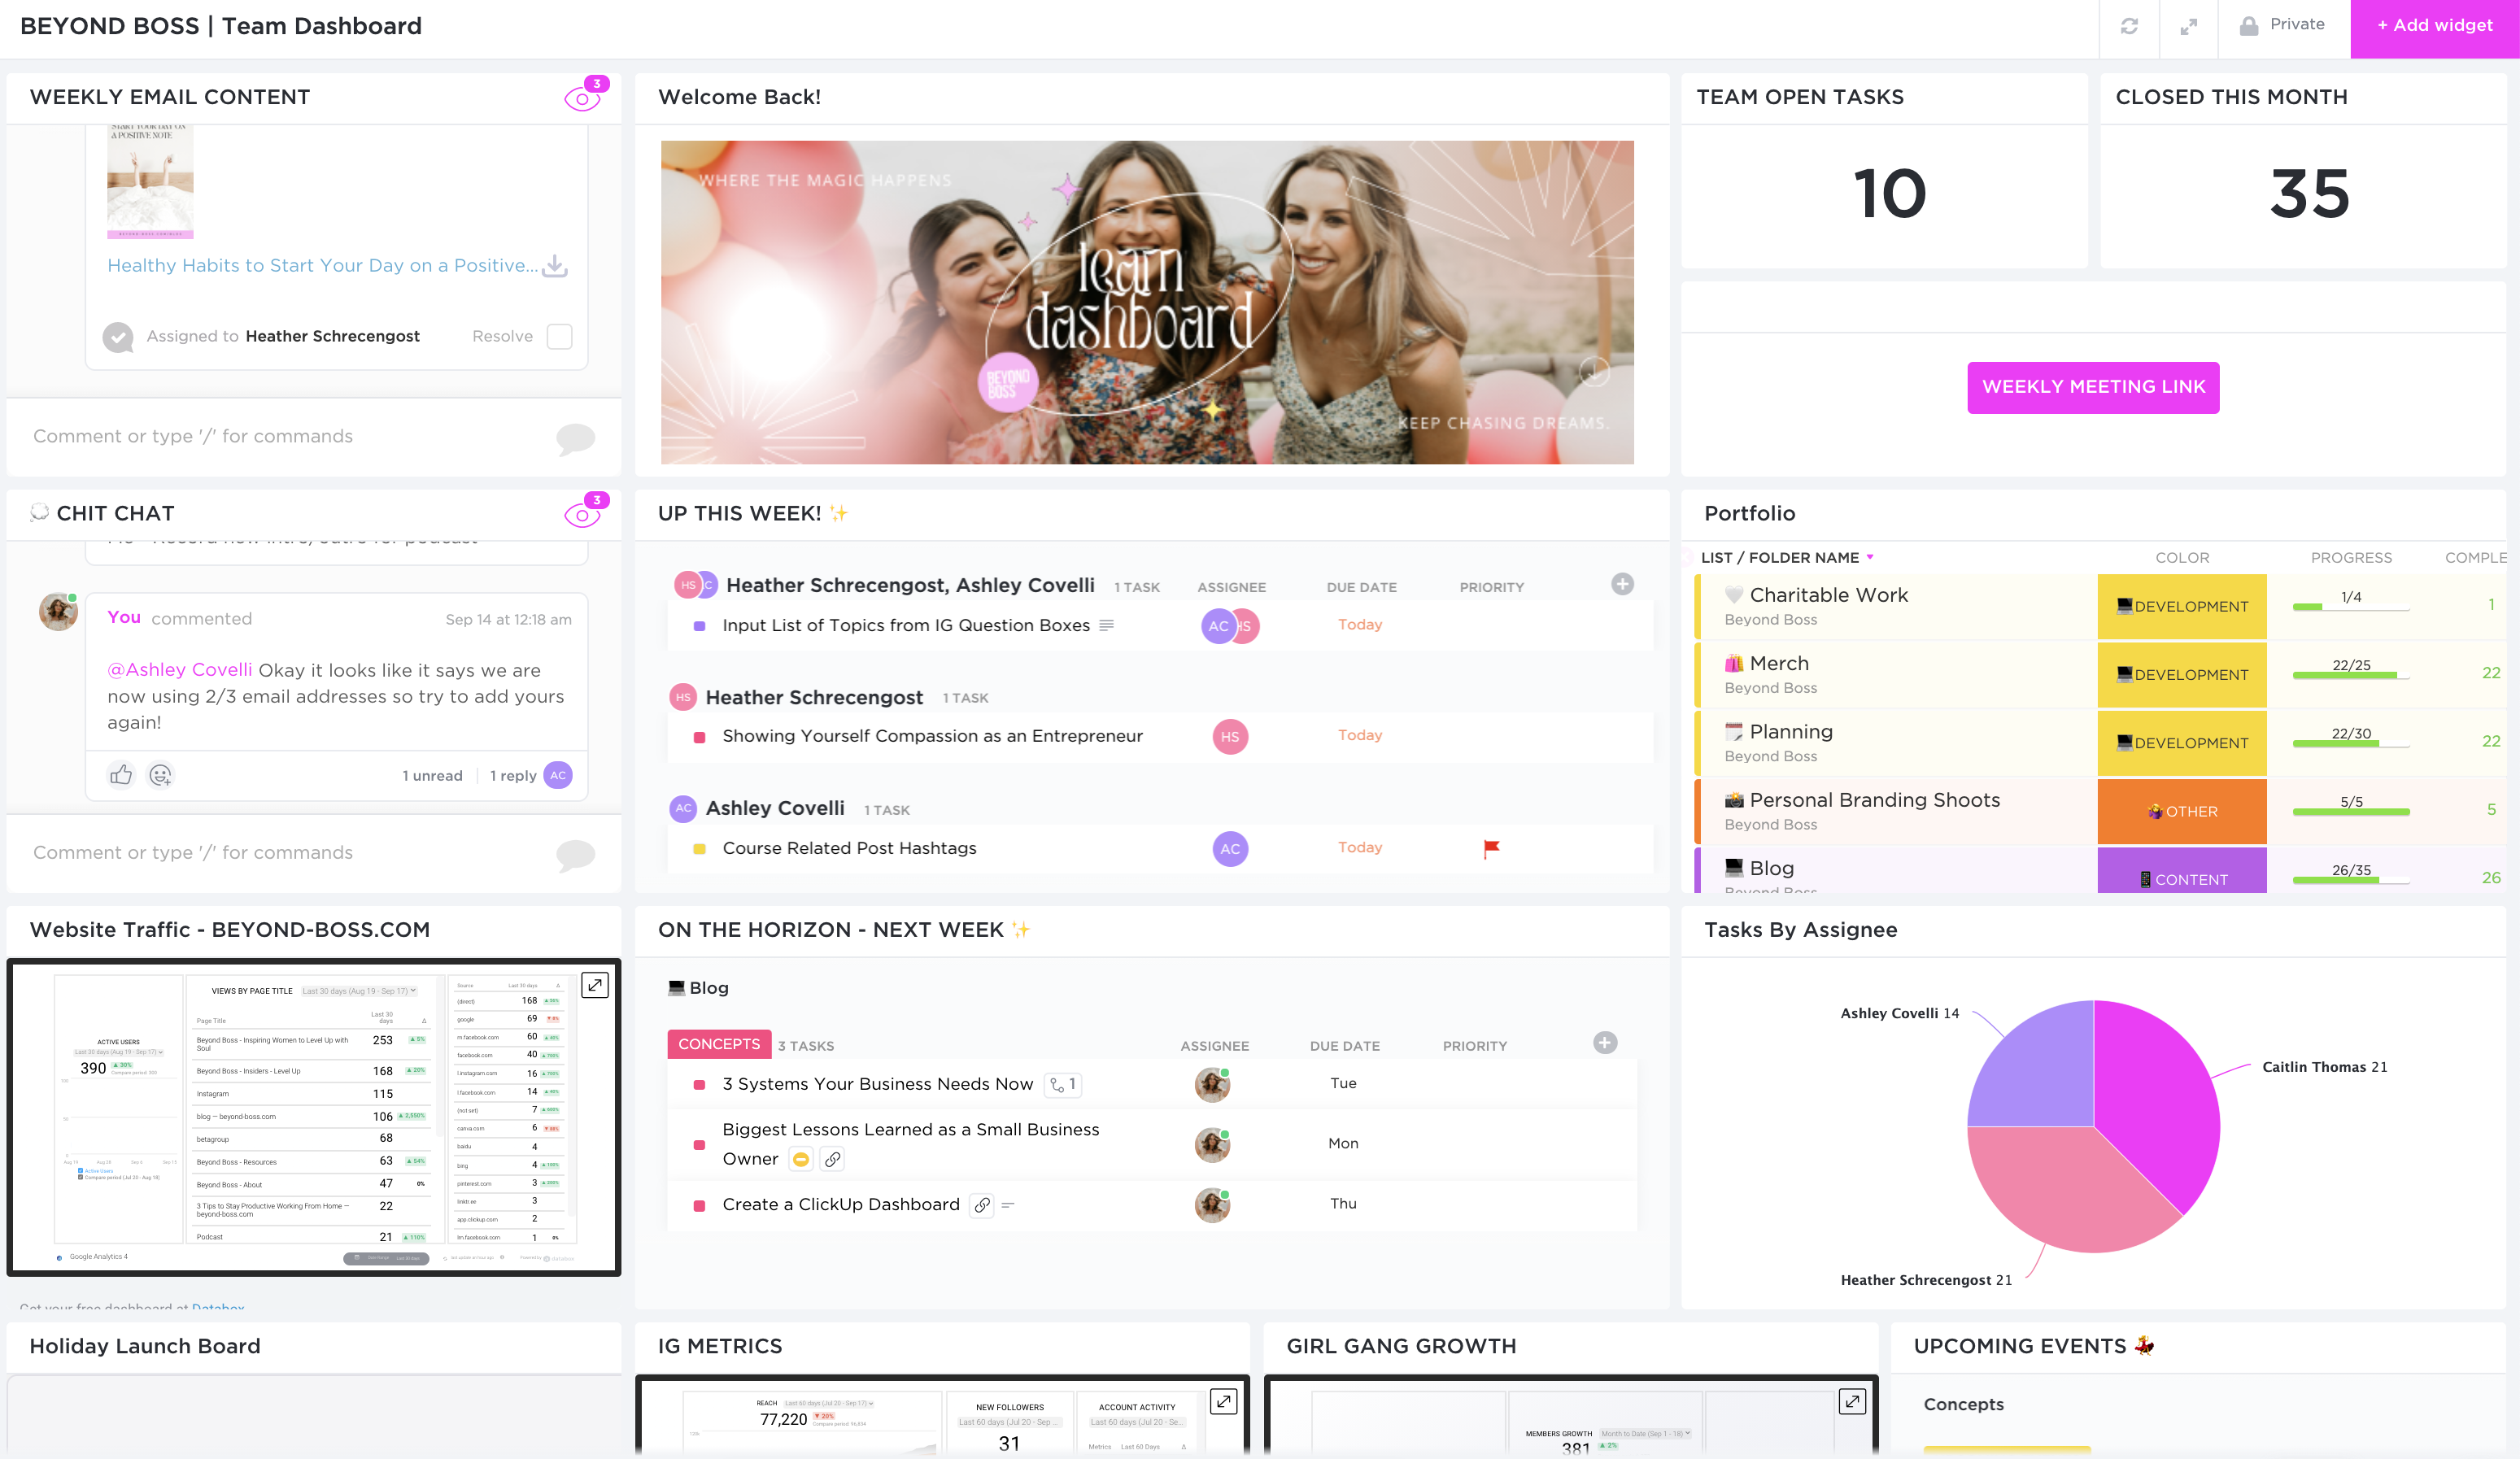
Efficiently manage tasks, projects, and team collaboration with the ClickUp dashboard, designed to streamline workflows and boost productivity.
Hive
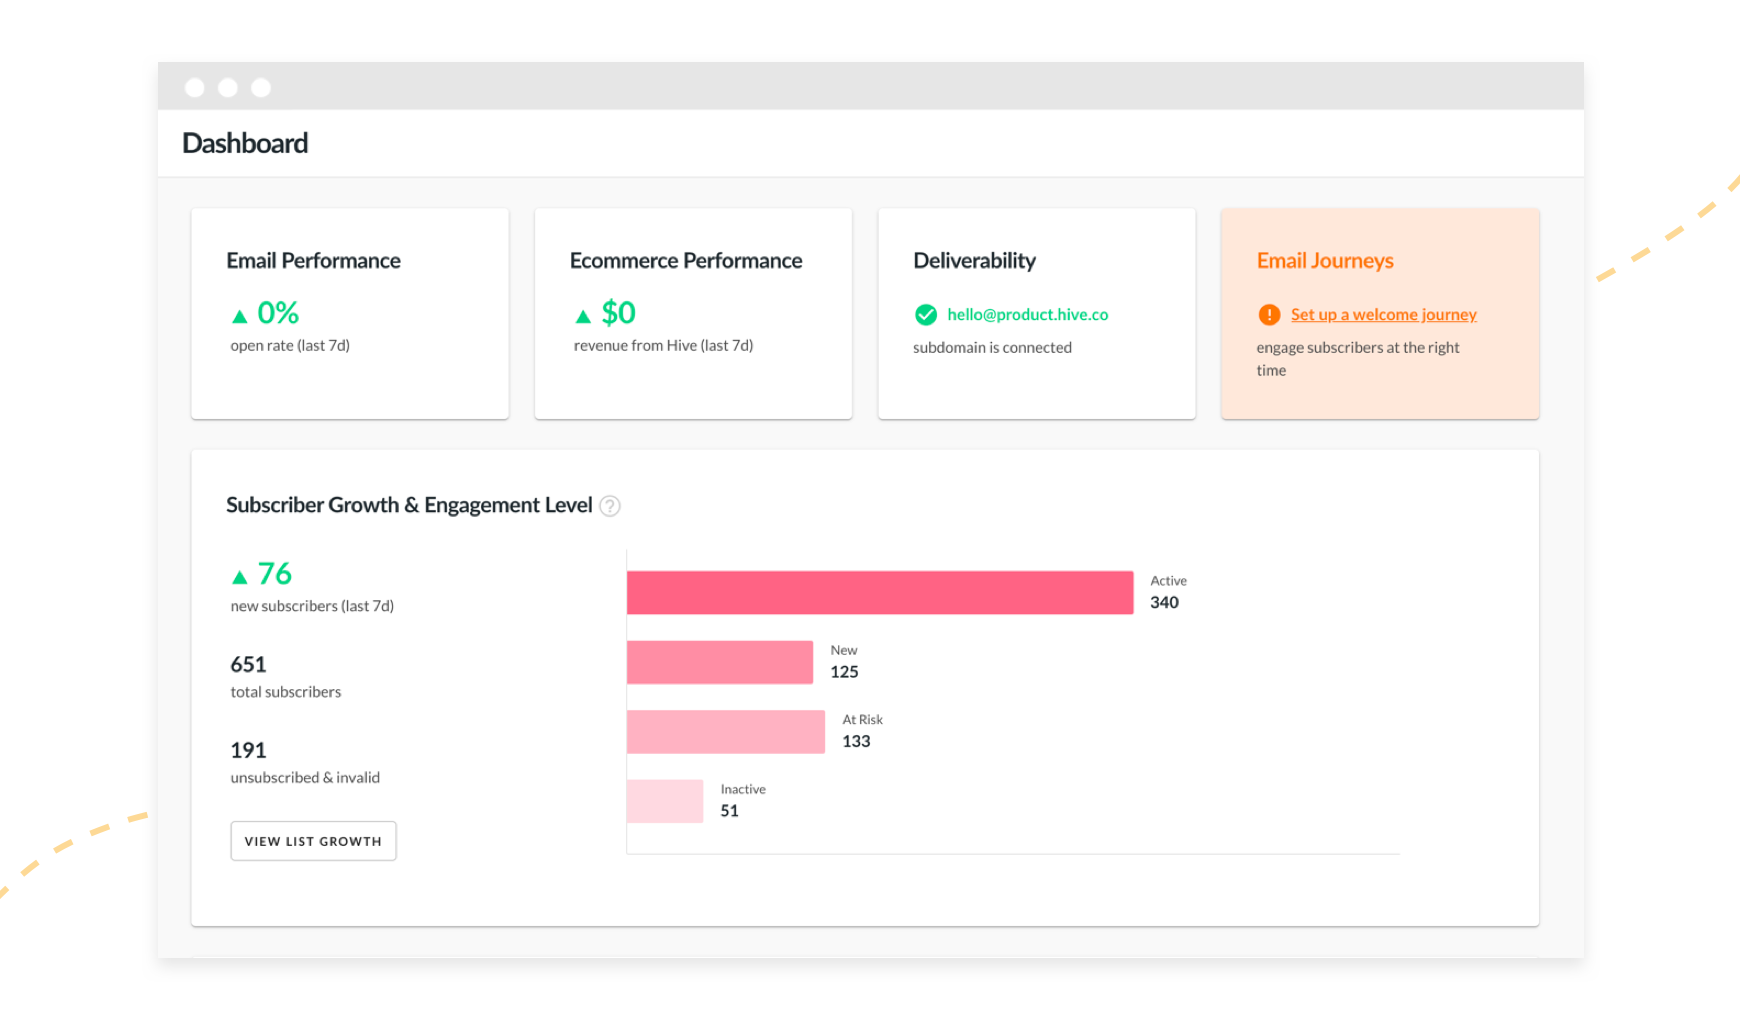
The Hive dashboard provides real-time analytics and insights into project management, enhancing team collaboration and productivity efficiently.

Jira
Efficiently track, manage, and visualize your team's projects and tasks with this comprehensive Jira dashboard, tailored for agile workflows.
Microsoft Project
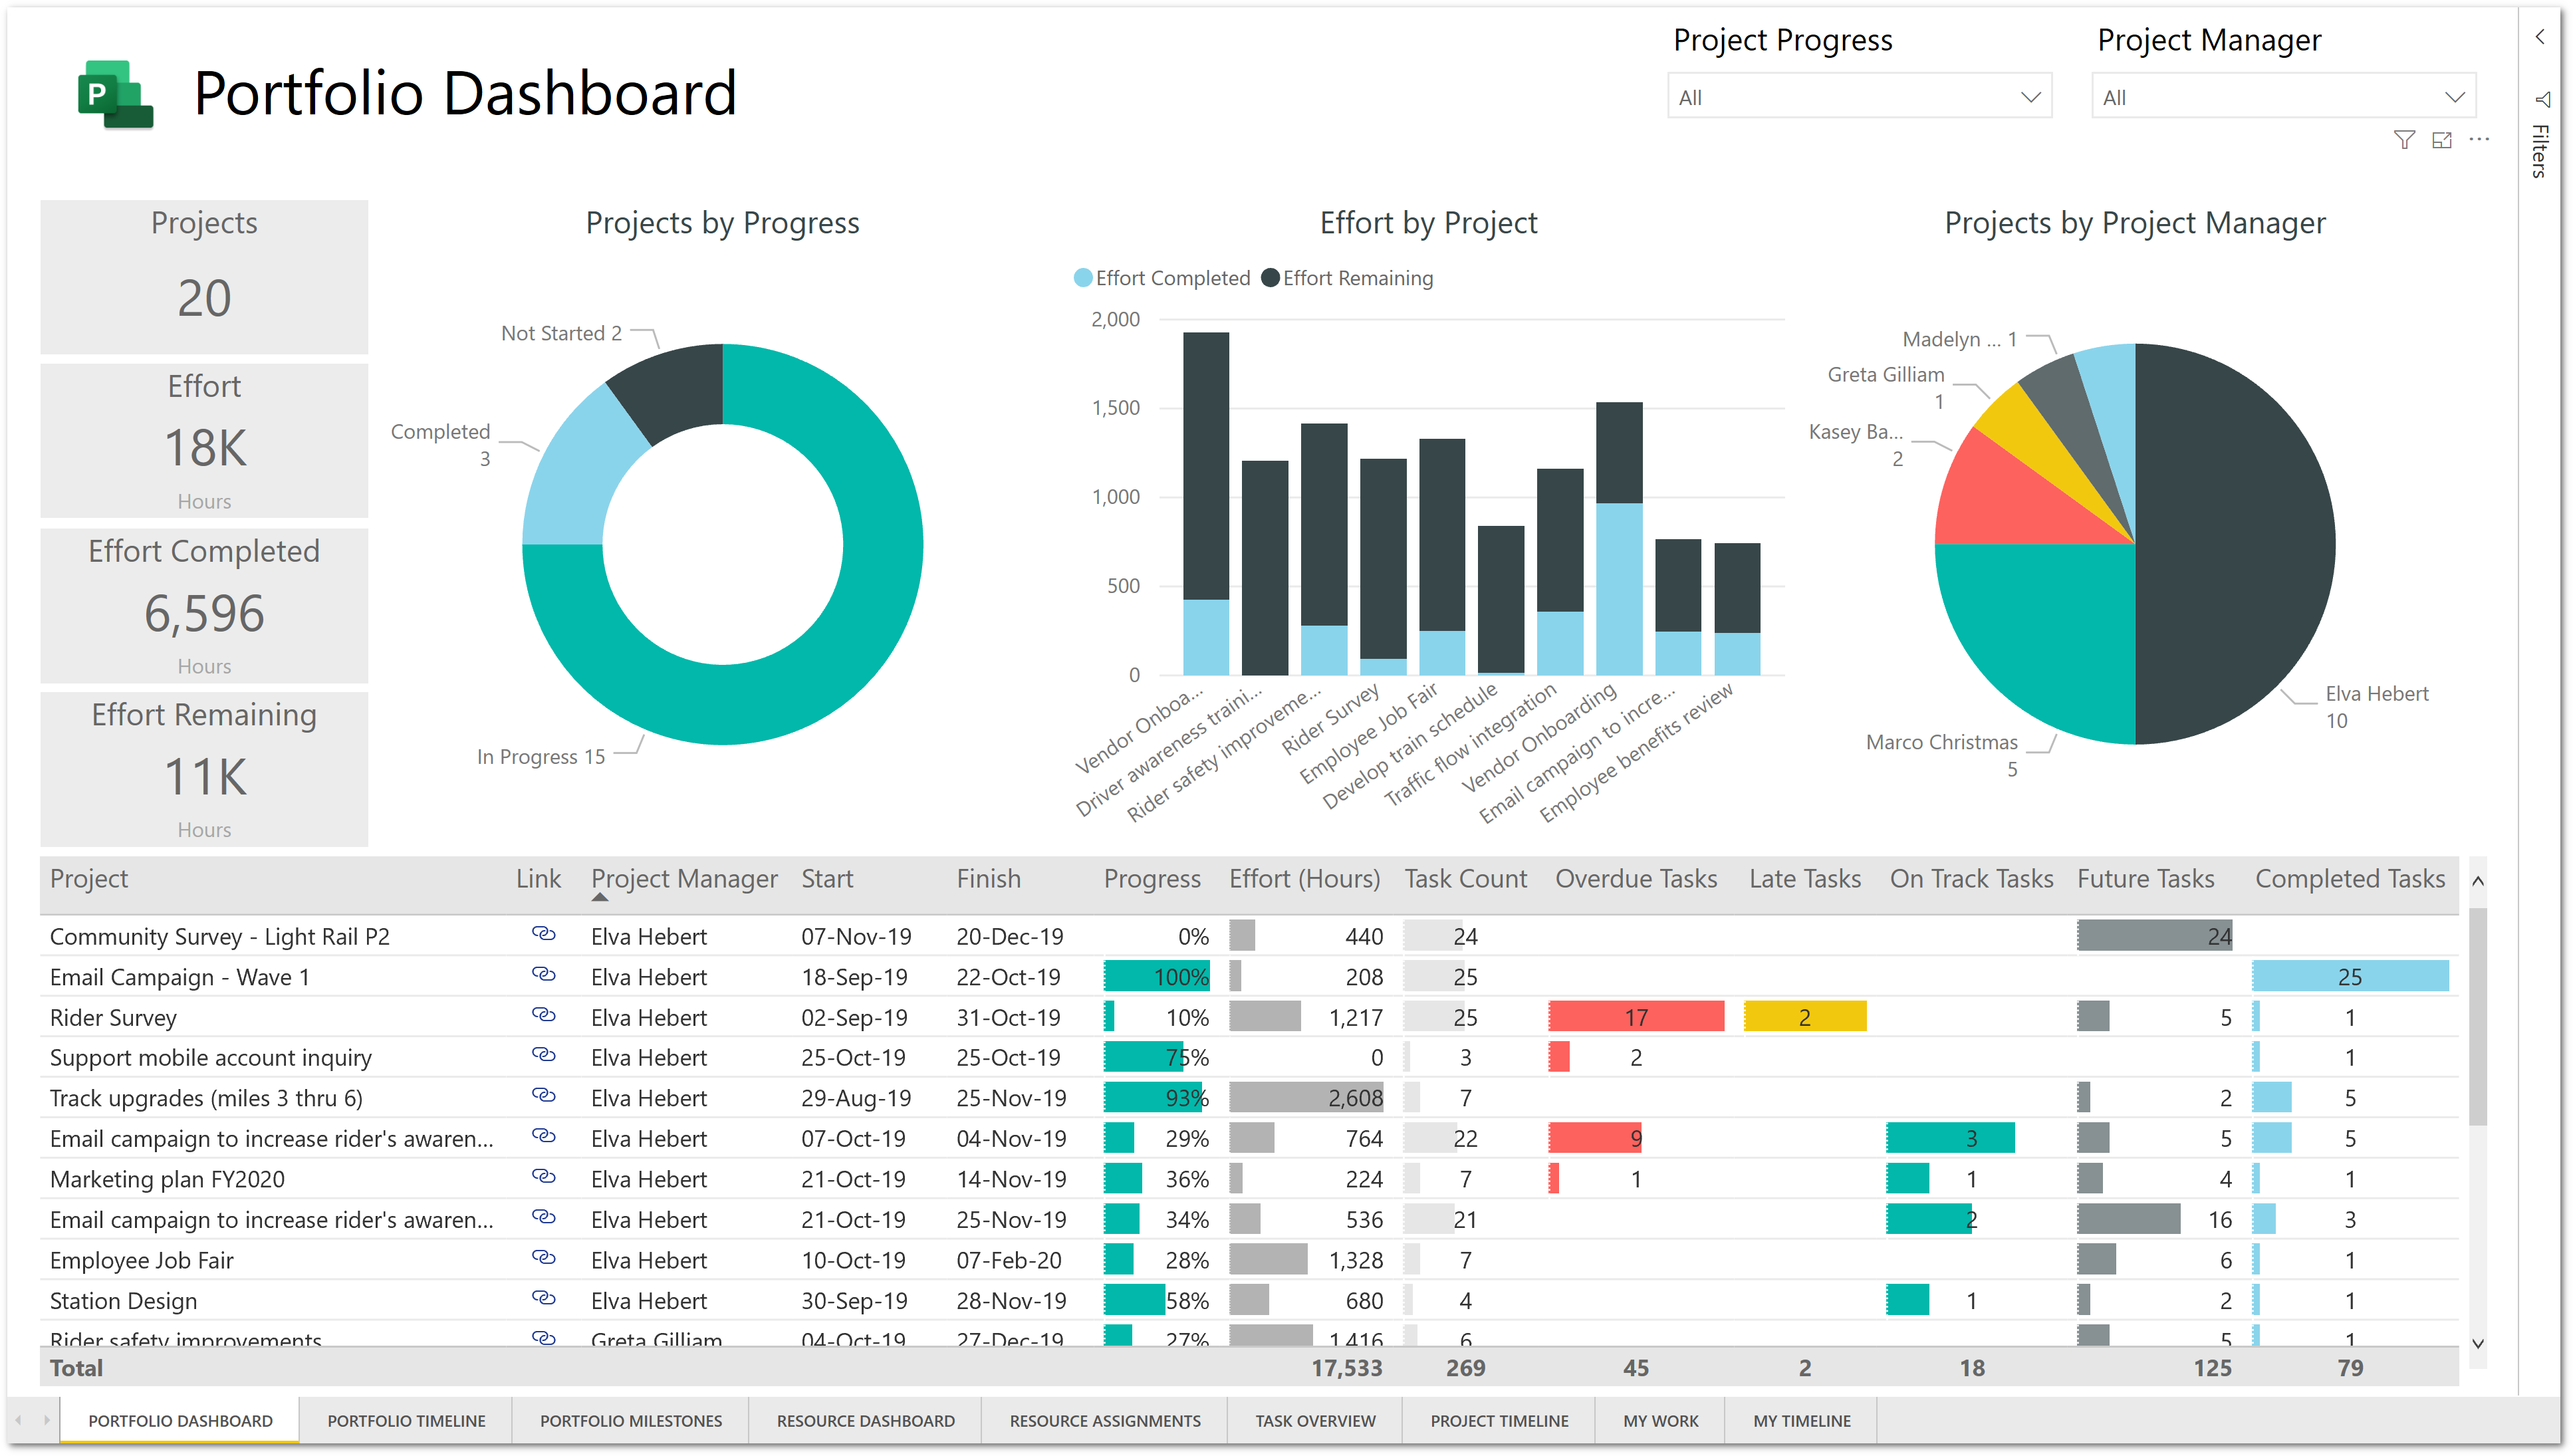
Streamline project management with Microsoft Project's dashboard, offering real-time insights, task tracking, and resource allocation in one place.
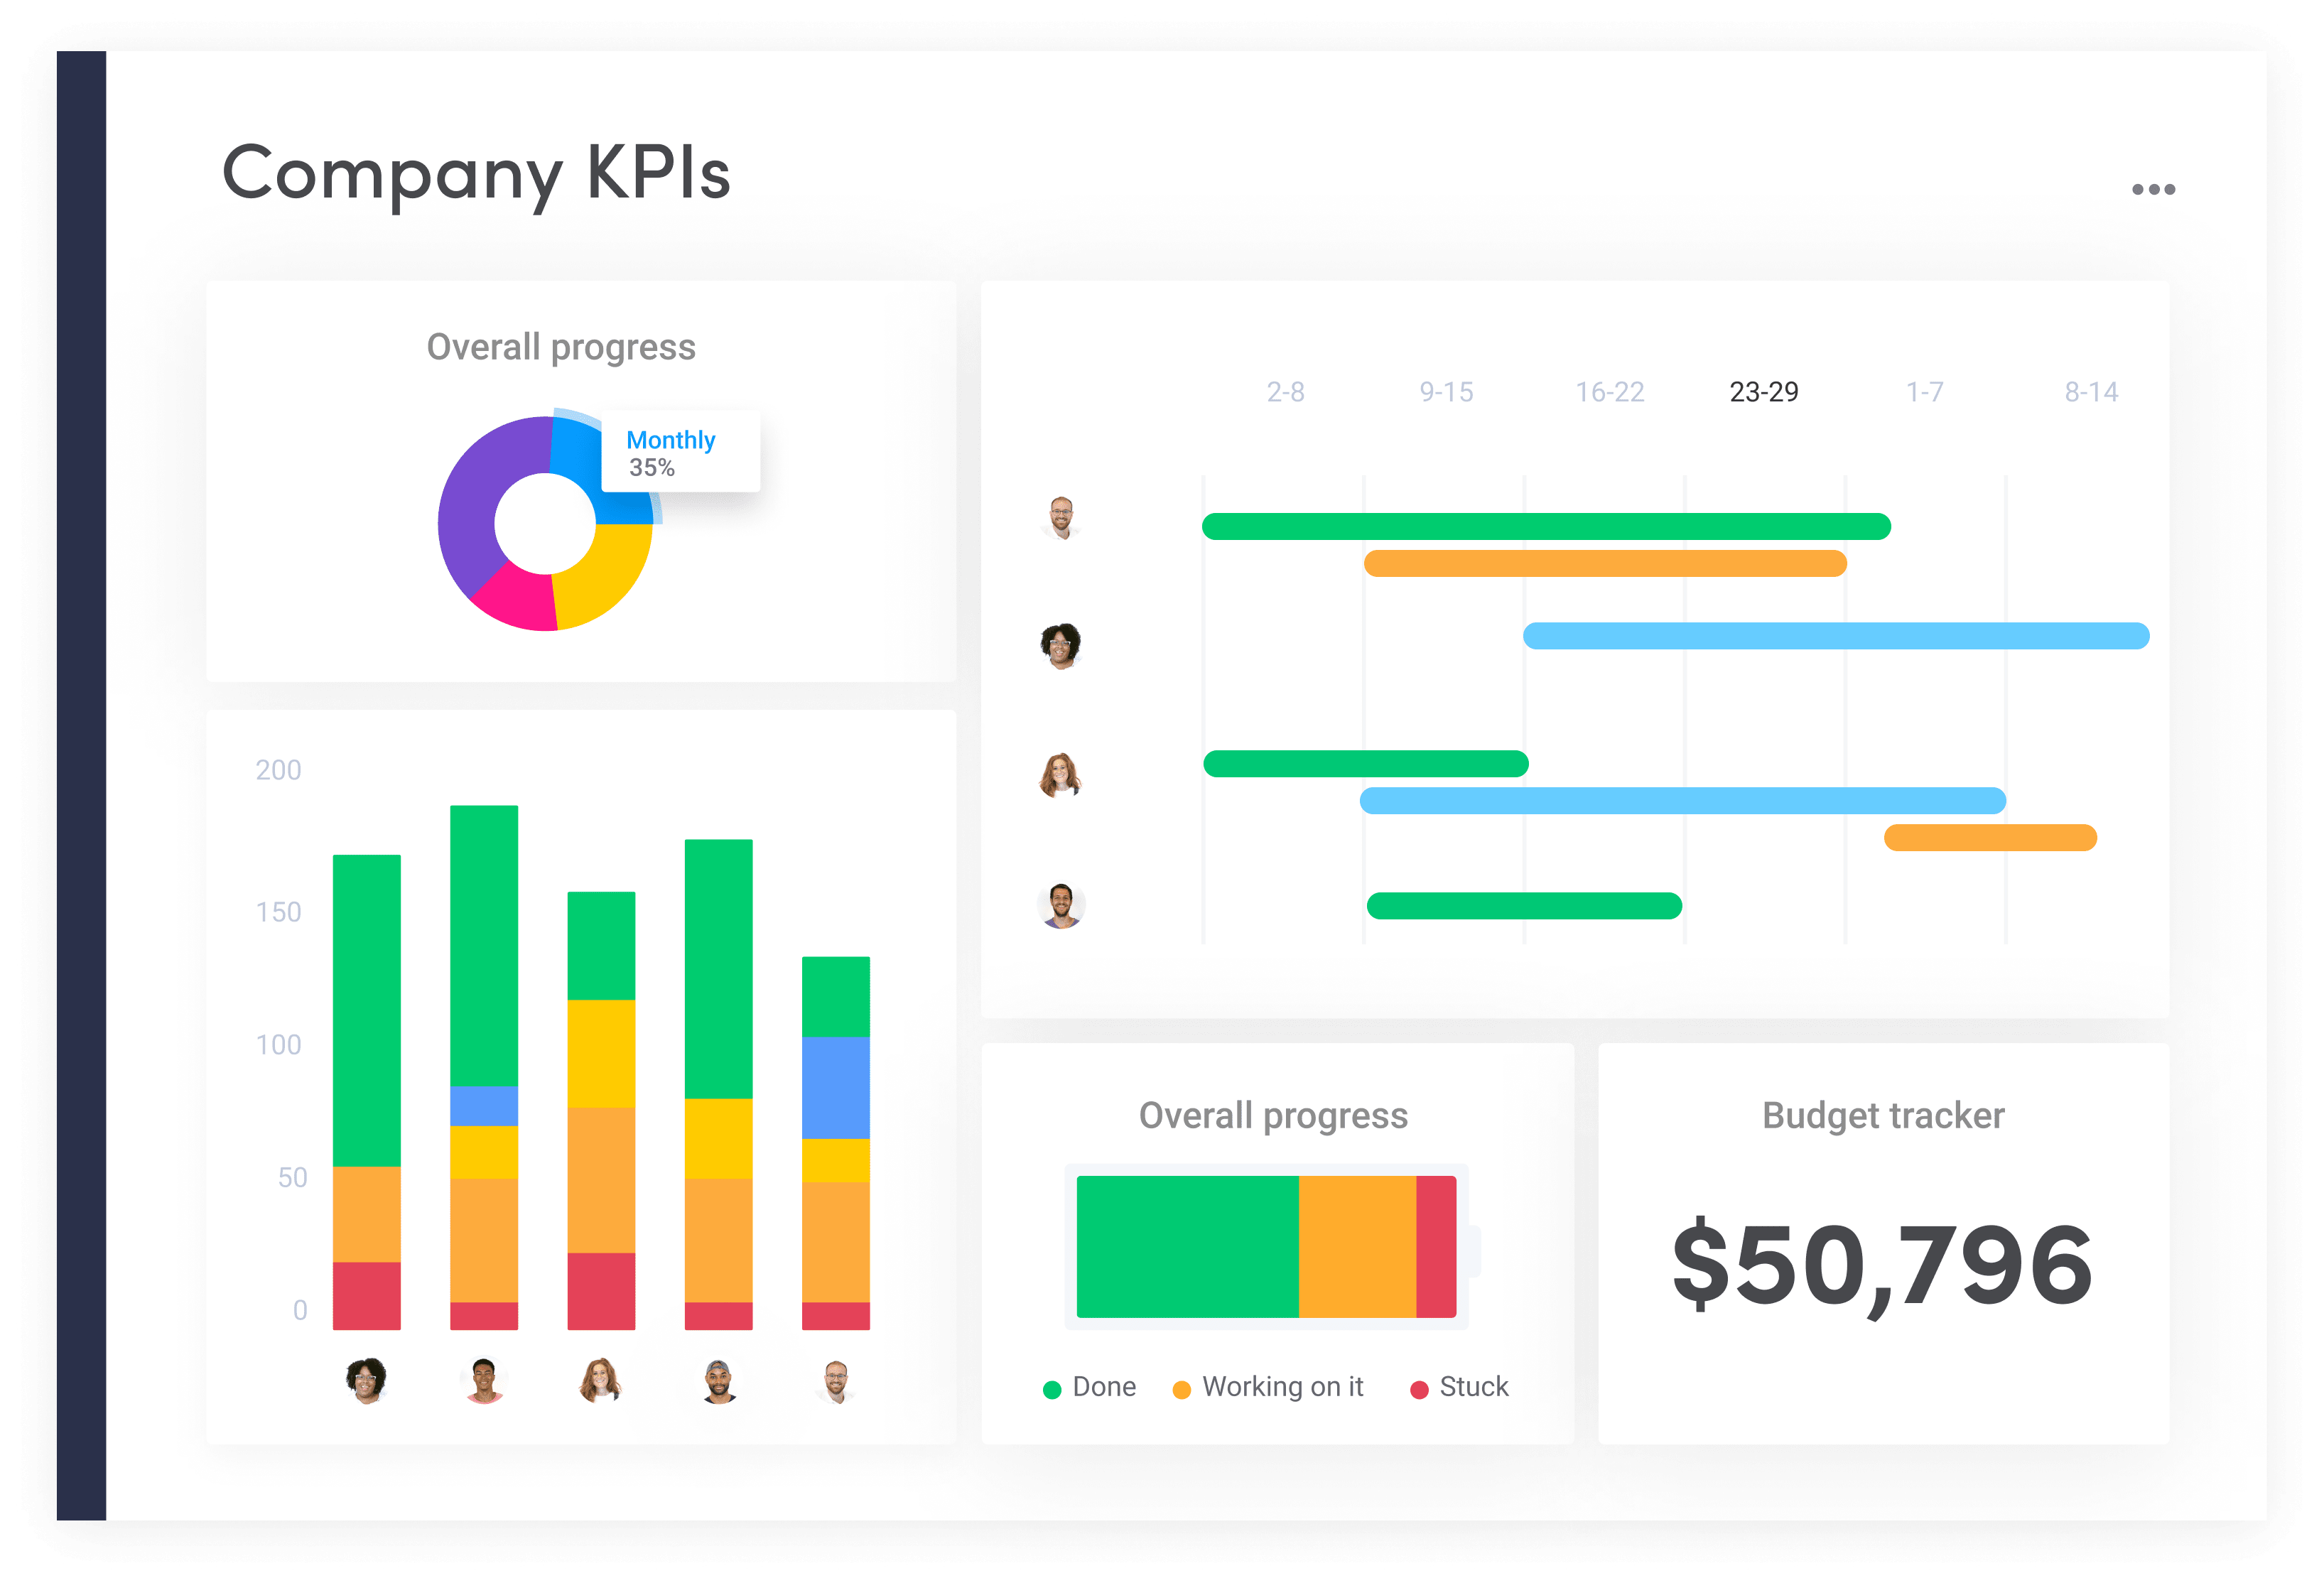
Monday.com
Streamline your project management with Monday.com's versatile dashboard, offering real-time insights, task tracking, and team collaboration in one place.

Notion
Streamline your workflow with the Notion dashboard, offering seamless project management, task tracking, and collaboration in one intuitive interface.

nTask
Streamline your project management with the nTask dashboard, offering intuitive task tracking, collaboration, and productivity tools in one place.

Podio
Streamline project management and team collaboration with Podio's customizable dashboard, offering real-time insights and seamless task tracking.
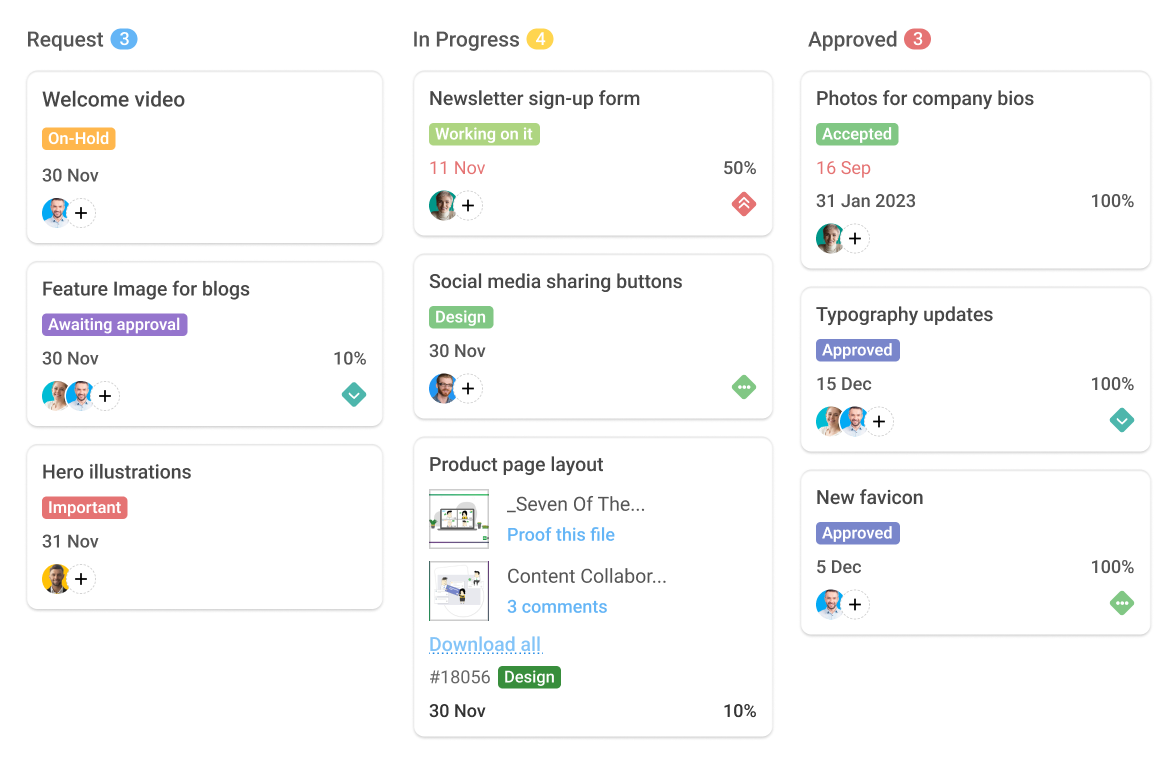
ProofHub
ProofHub's dashboard offers a centralized platform for team collaboration, project management, and task tracking, enhancing productivity and efficiency.
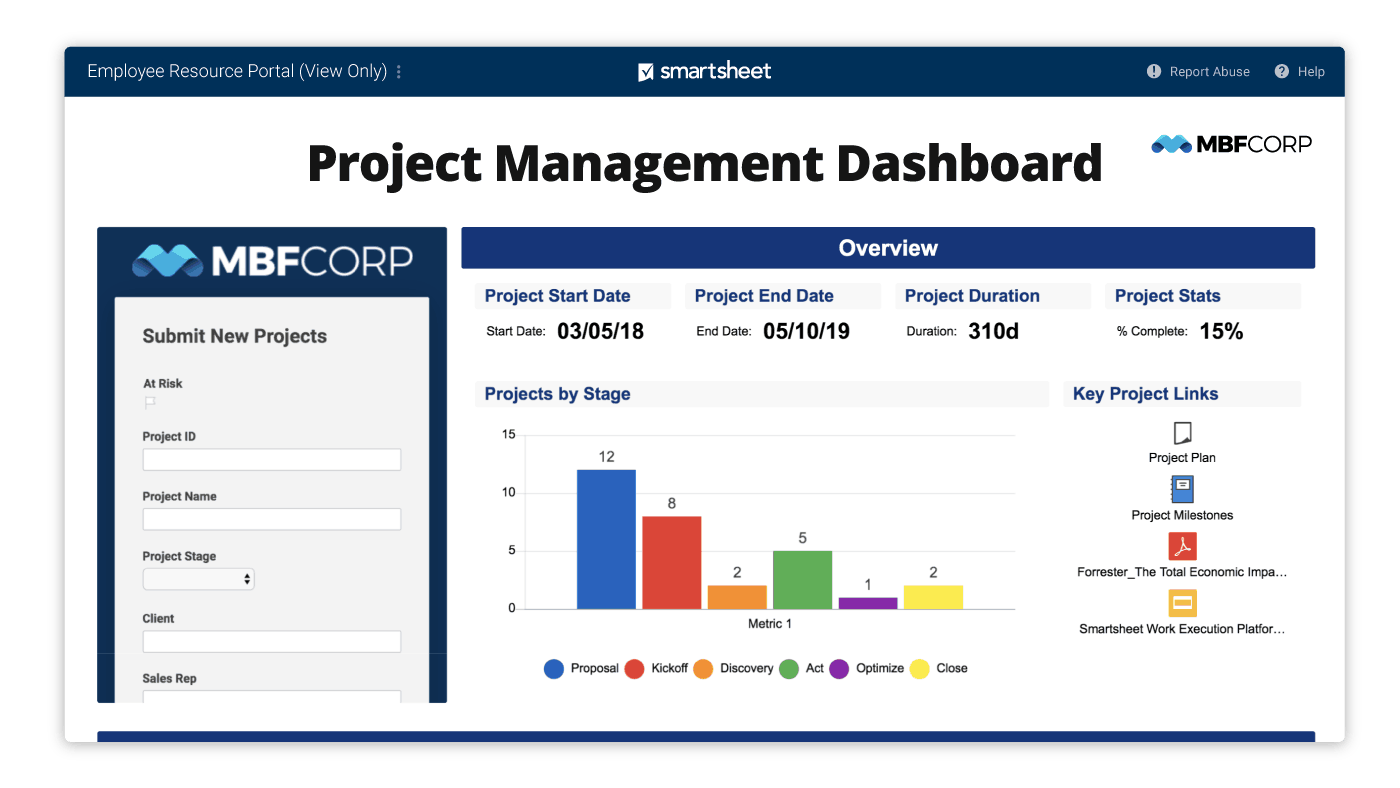
Smartsheet
Streamline project management with Smartsheet's interactive dashboard, offering real-time data visualization and collaboration tools for teams.
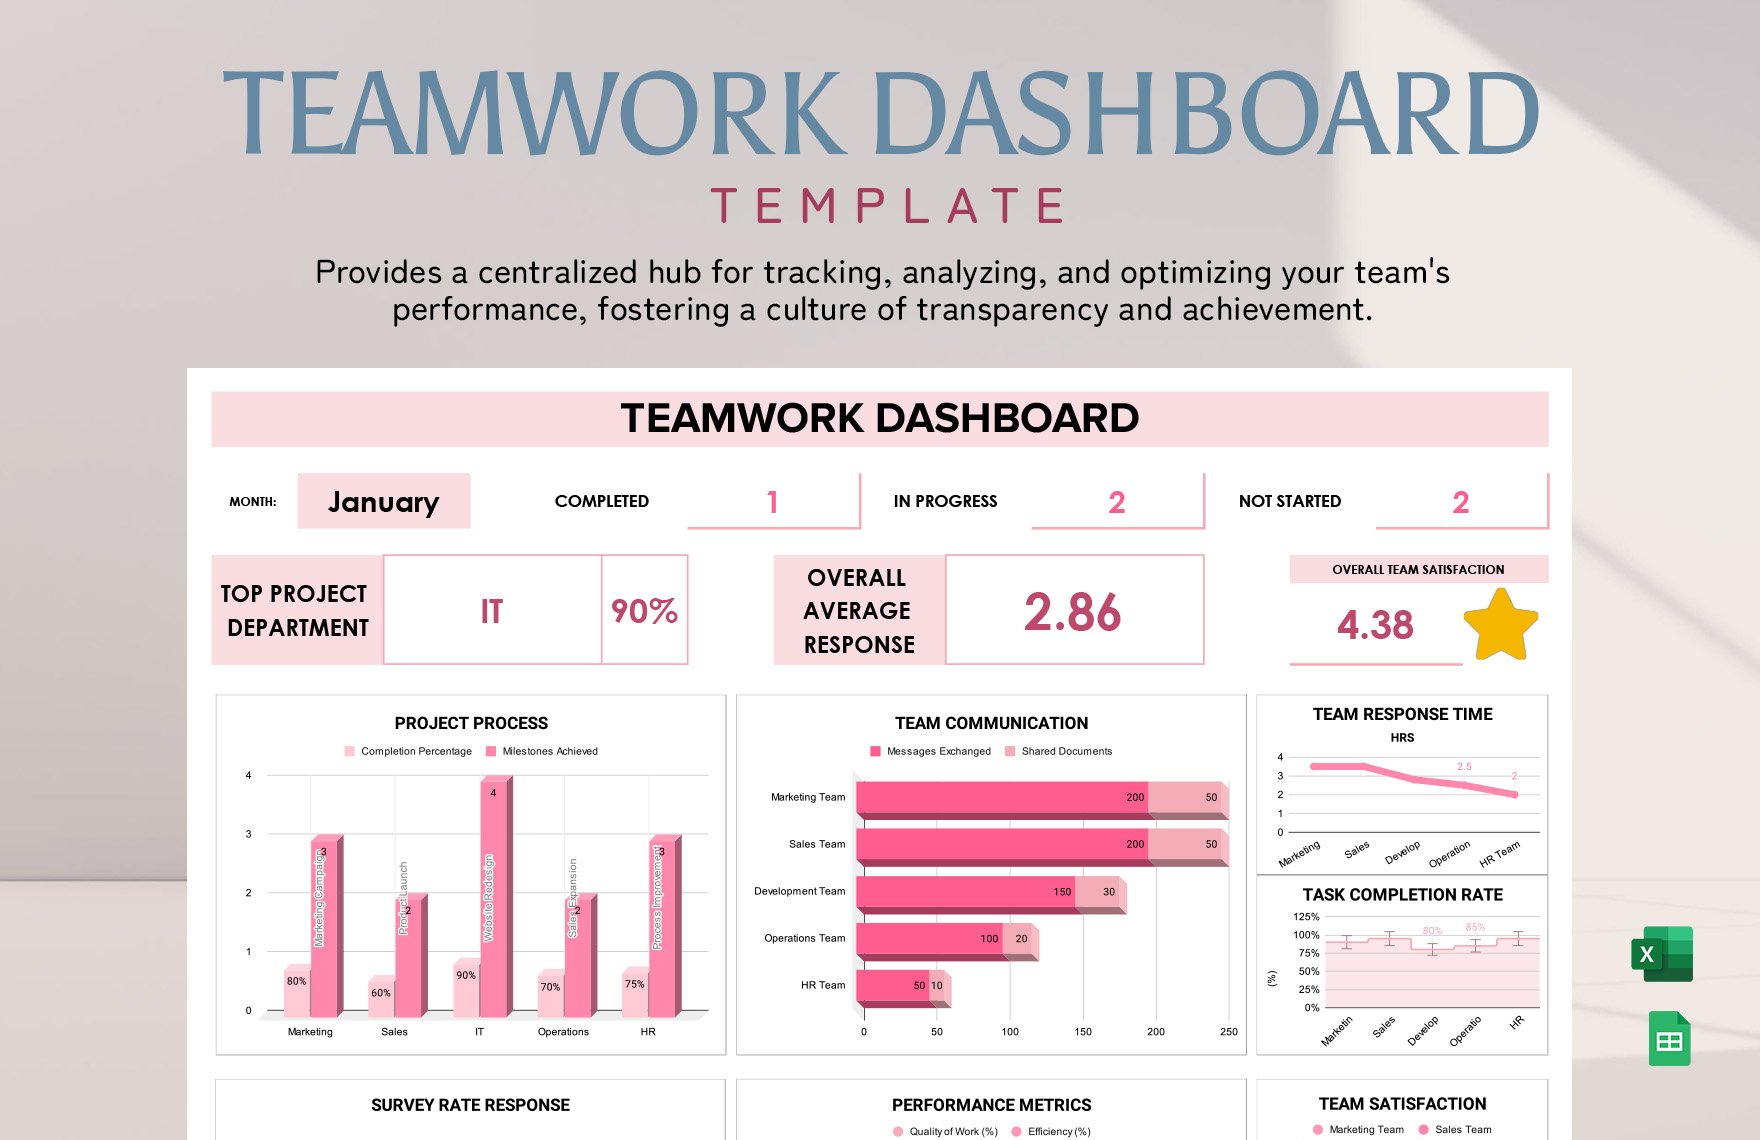
Teamwork
Monitor and enhance team collaboration with real-time insights, task management, and performance metrics on the Teamwork dashboard.

Trello
Streamline your project management with Trello's intuitive dashboard, offering seamless task tracking, collaboration, and productivity enhancement.

Wrike
Streamline project management with Wrike's dashboard, offering real-time insights, task tracking, and team collaboration in one intuitive interface.
Zoho Projects
Efficiently manage projects with Zoho Projects' dashboard, offering real-time insights, task tracking, and team collaboration in one intuitive interface.

AppFolio Analytics
AppFolio Analytics provides comprehensive insights into property management performance, enabling data-driven decisions with real-time metrics and trends.

Buildium Analytics
Gain insights into property management with Buildium Analytics, offering real-time data on financials, occupancy, and maintenance efficiency.
CoStar
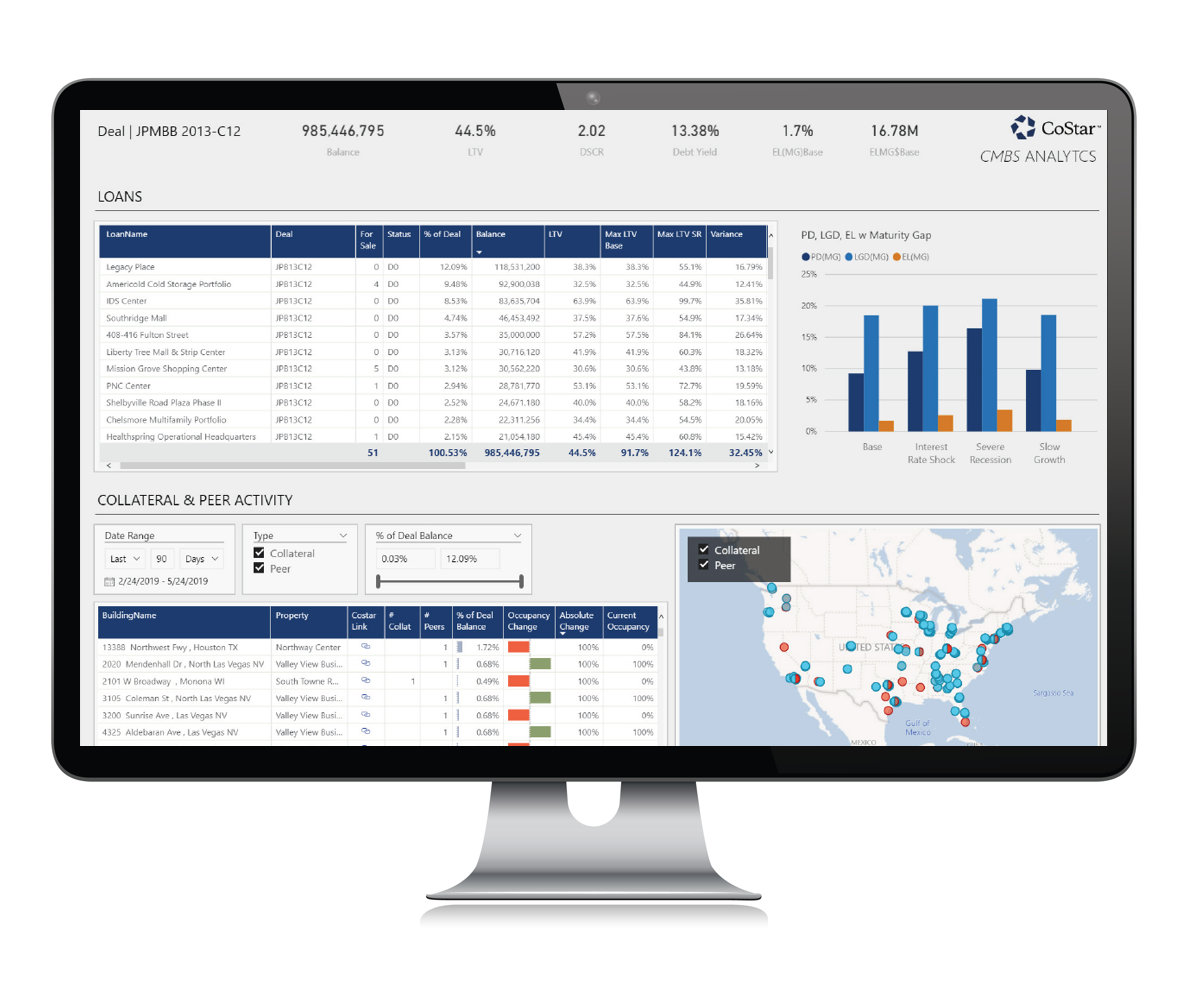
Explore real estate insights with CoStar's dashboard, offering comprehensive data analytics for informed property investment decisions.

MLS Analytics (Multiple Listing Service)
Explore comprehensive real estate data insights with the MLS Analytics dashboard, offering detailed property trends and market analysis for informed decisions.
MRI Software
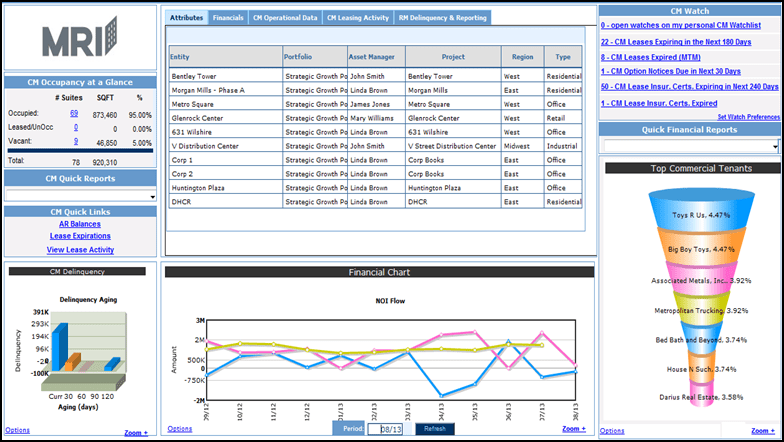
MRI Software's dashboard offers real-time insights and analytics for property management, enhancing decision-making and operational efficiency.

Power BI for Real Estate
Gain insights into property trends, sales performance, and market analysis with the Power BI for Real Estate dashboard for informed decision-making.
RealPage Analytics
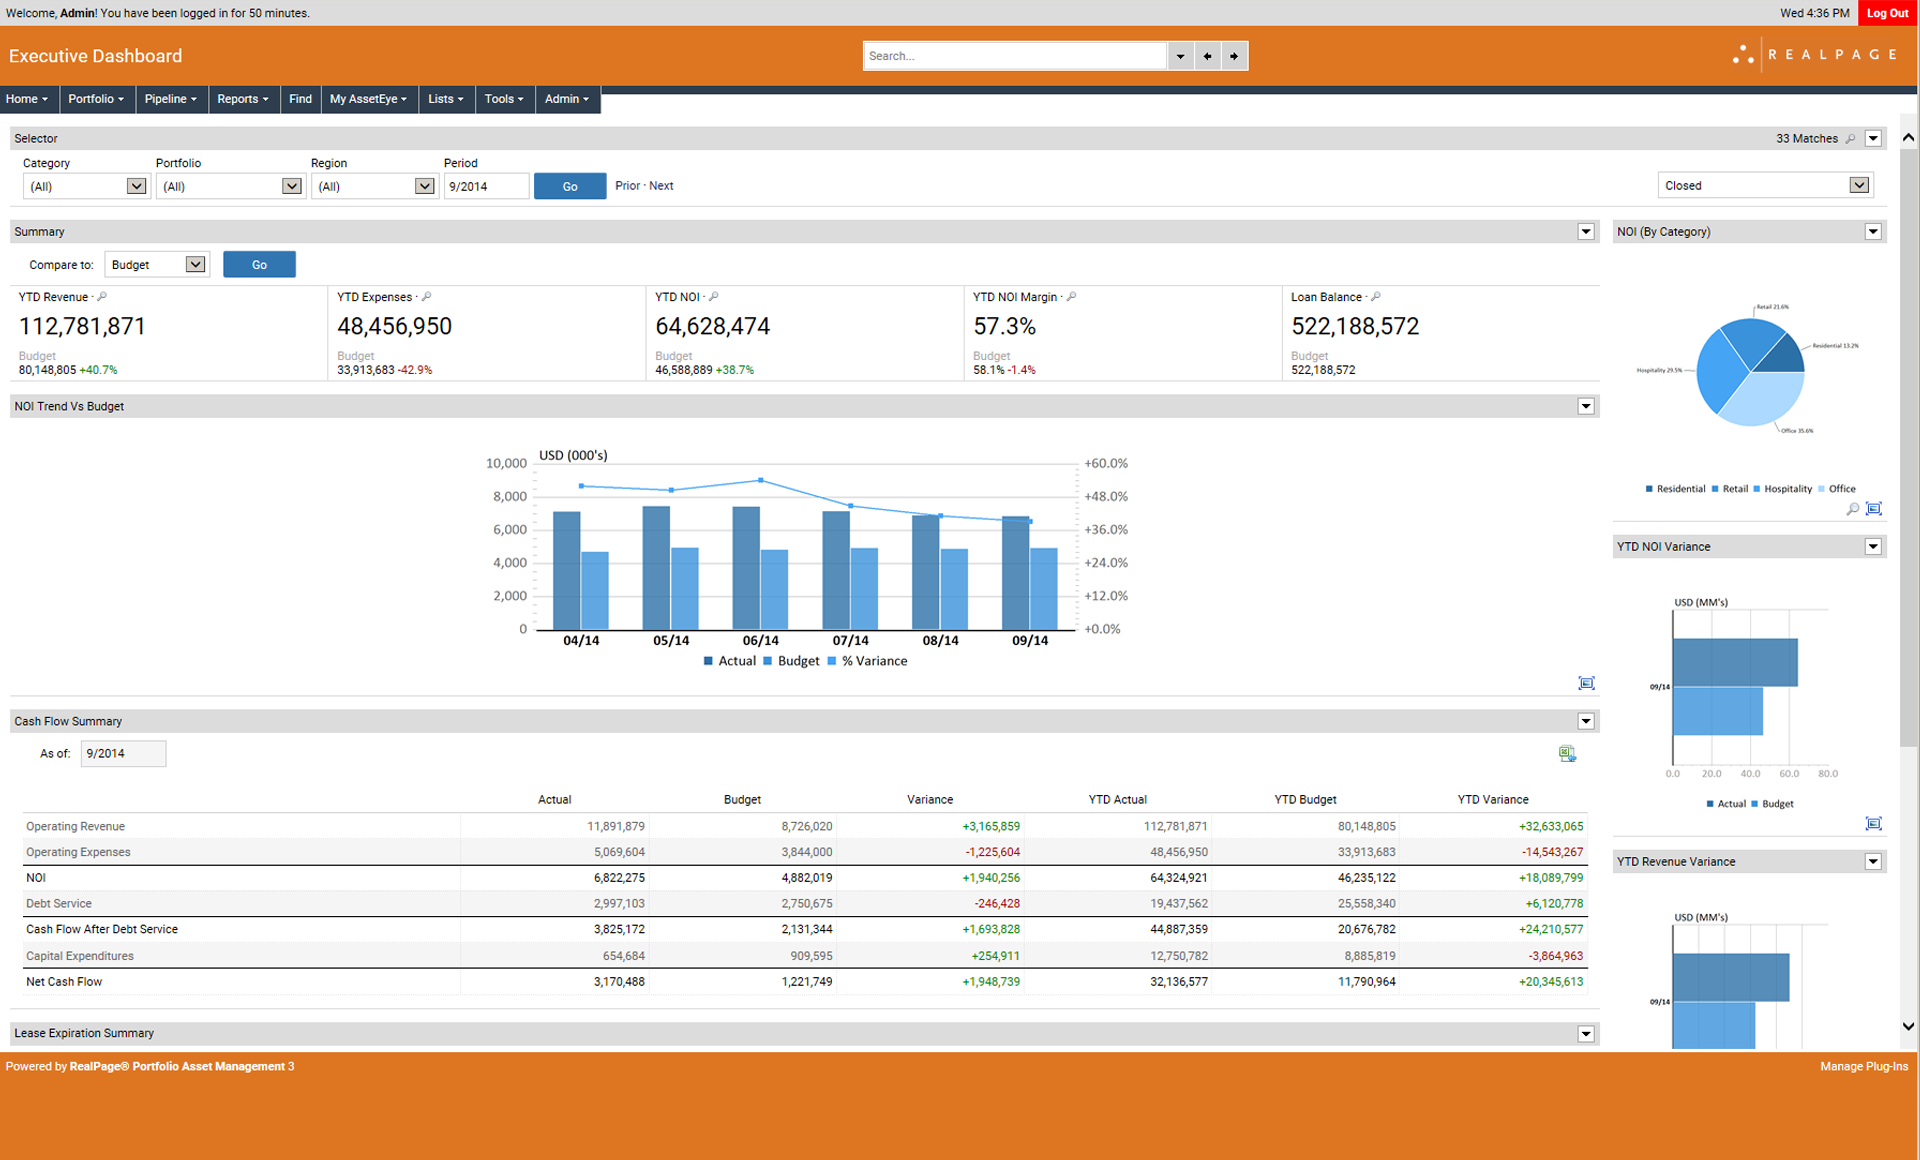
Gain actionable insights into real estate trends and performance metrics with the RealPage Analytics dashboard for informed decision-making.
Redfin Analytics
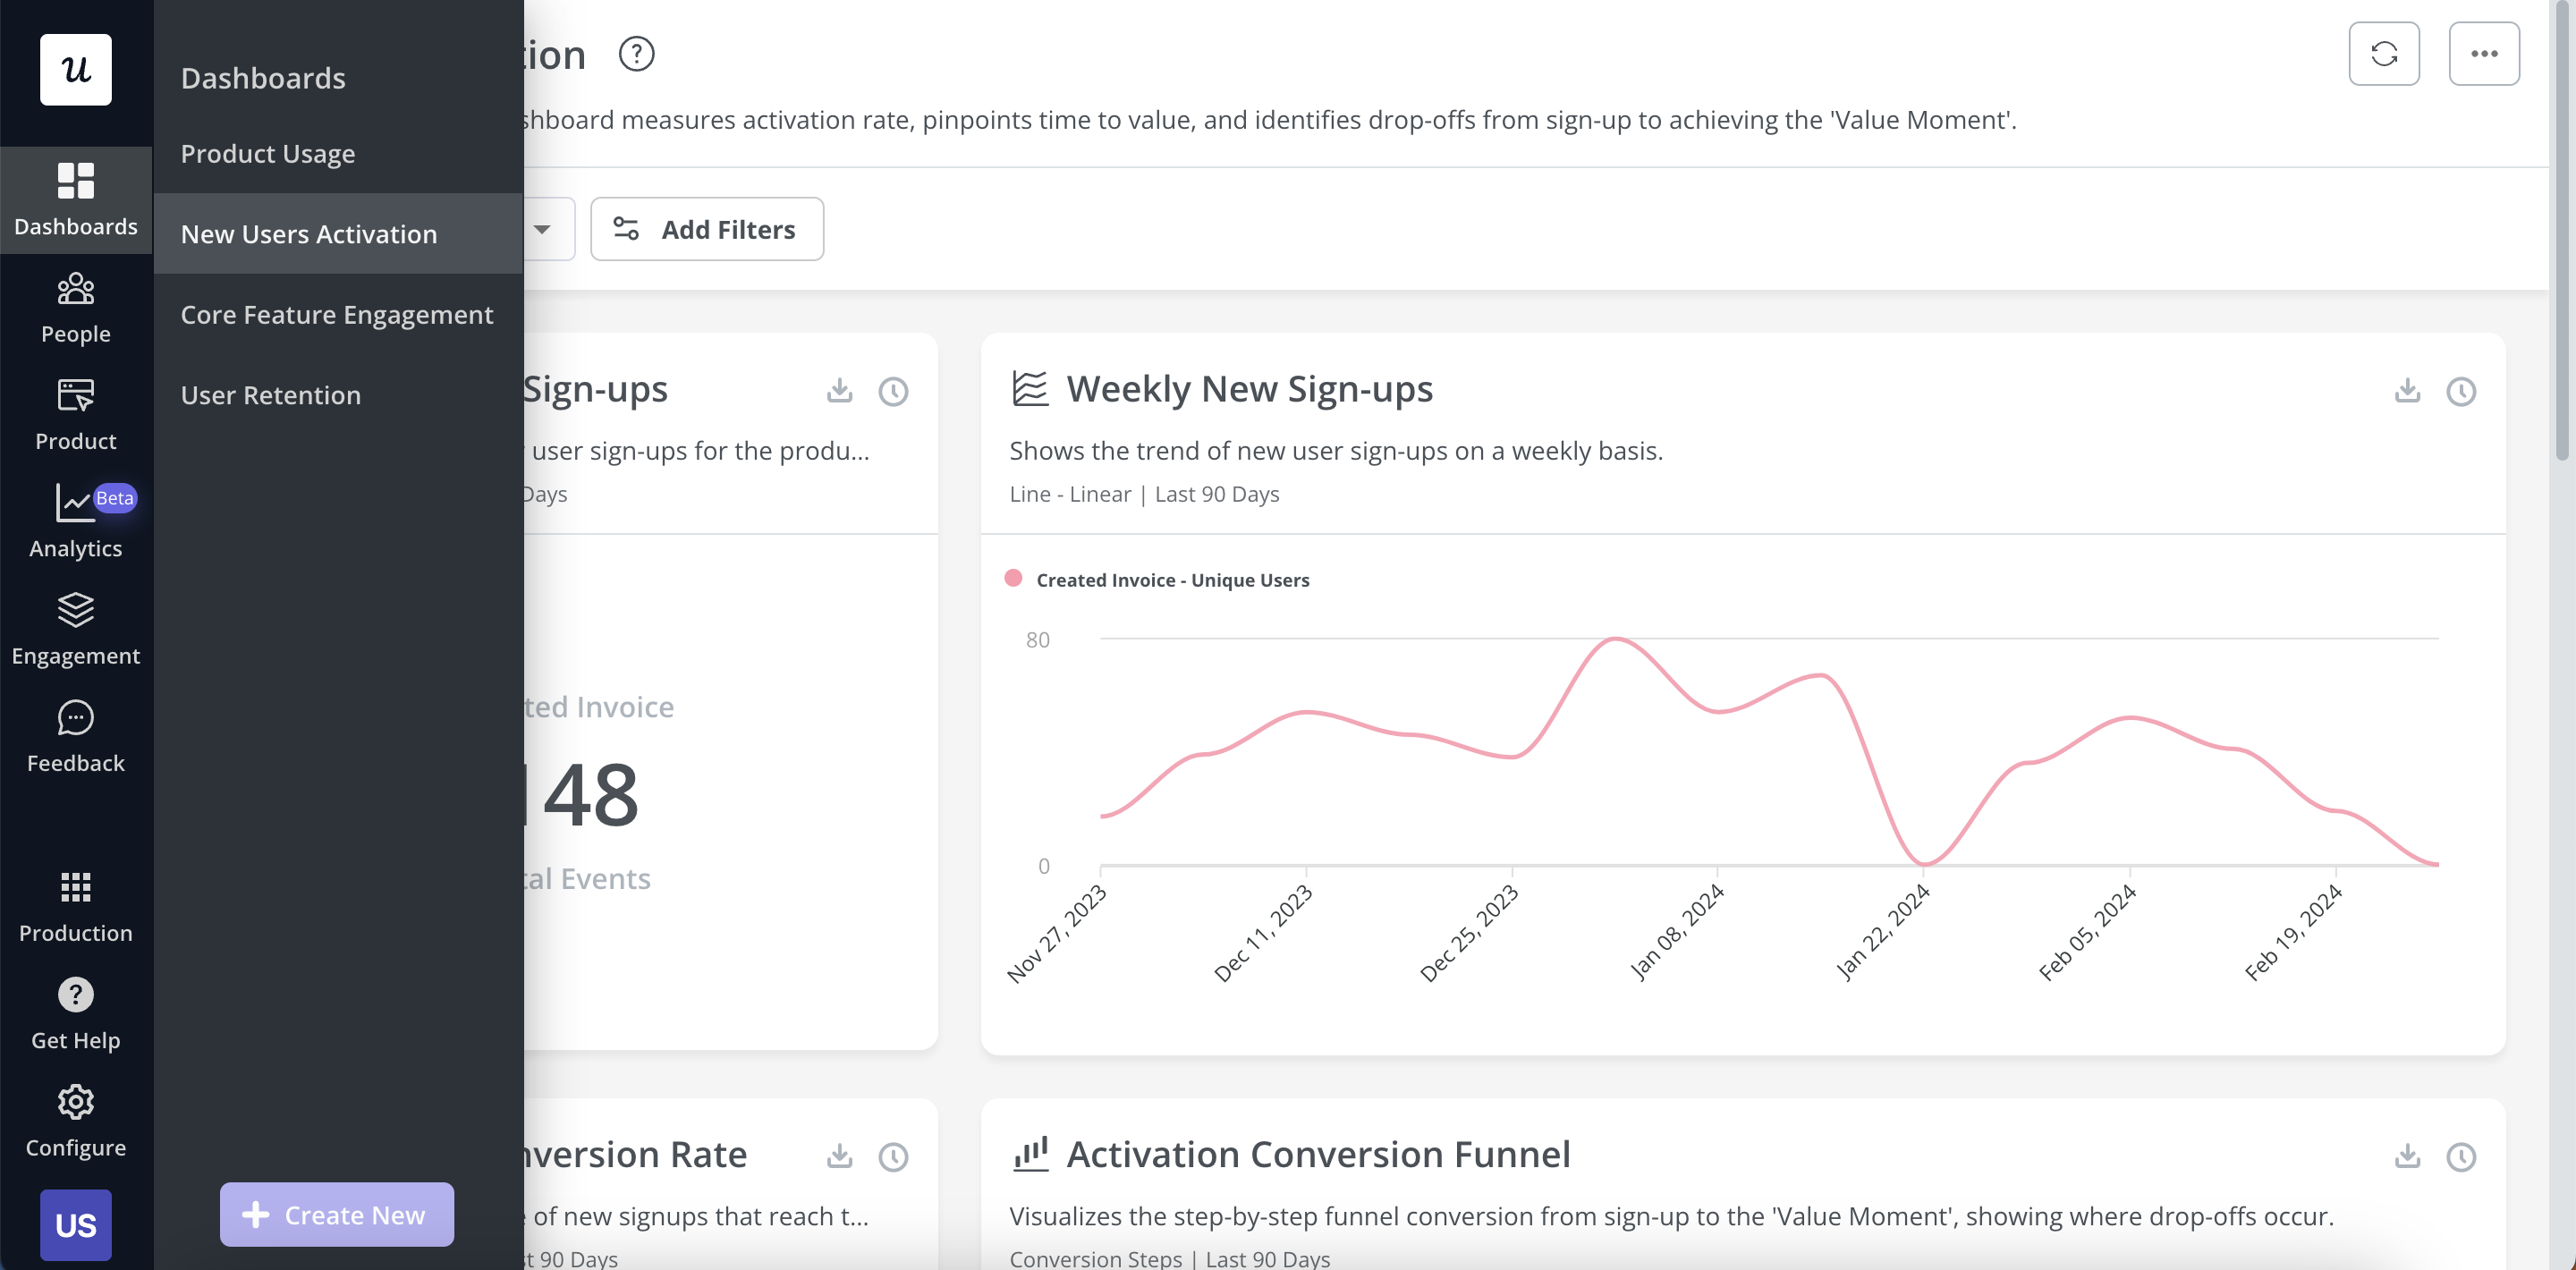
Explore comprehensive real estate insights with Redfin Analytics, offering data-driven tools for market trends, property values, and neighborhood comparisons.
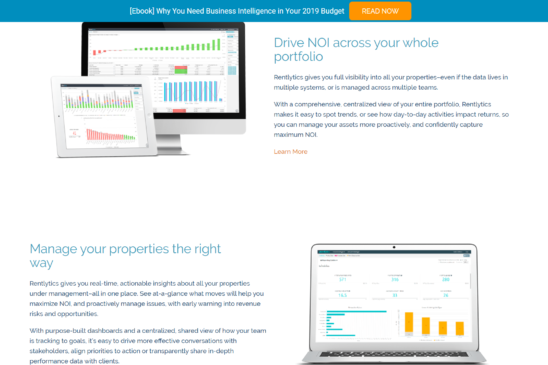
Rentlytics
Rentlytics provides real-time insights and analytics for property managers to optimize rental operations and enhance tenant satisfaction.

Reonomy
Explore Reonomy's comprehensive dashboard for real estate insights, offering data-driven analytics and property intelligence in a user-friendly interface.

Tableau Real Estate Dashboards
Explore comprehensive insights into real estate trends, property values, and market dynamics with Tableau Real Estate Dashboards for strategic decision-making.
VTS Analytics
VTS Analytics provides real-time insights into property performance, tenant engagement, and market trends, enhancing decision-making for real estate professionals.

Yardi Matrix
Yardi Matrix dashboard provides comprehensive real estate data analytics, offering insights into market trends and property performance.

Zillow Analytics
Gain insights into real estate trends with Zillow Analytics, featuring interactive data visualizations for market analysis and property evaluations.

Brightpearl
Brightpearl's dashboard offers real-time insights into sales, inventory, and financials, enabling efficient business management in one platform.

Epicor Eagle
The Epicor Eagle dashboard provides real-time insights and analytics to streamline retail operations and enhance decision-making efficiency.
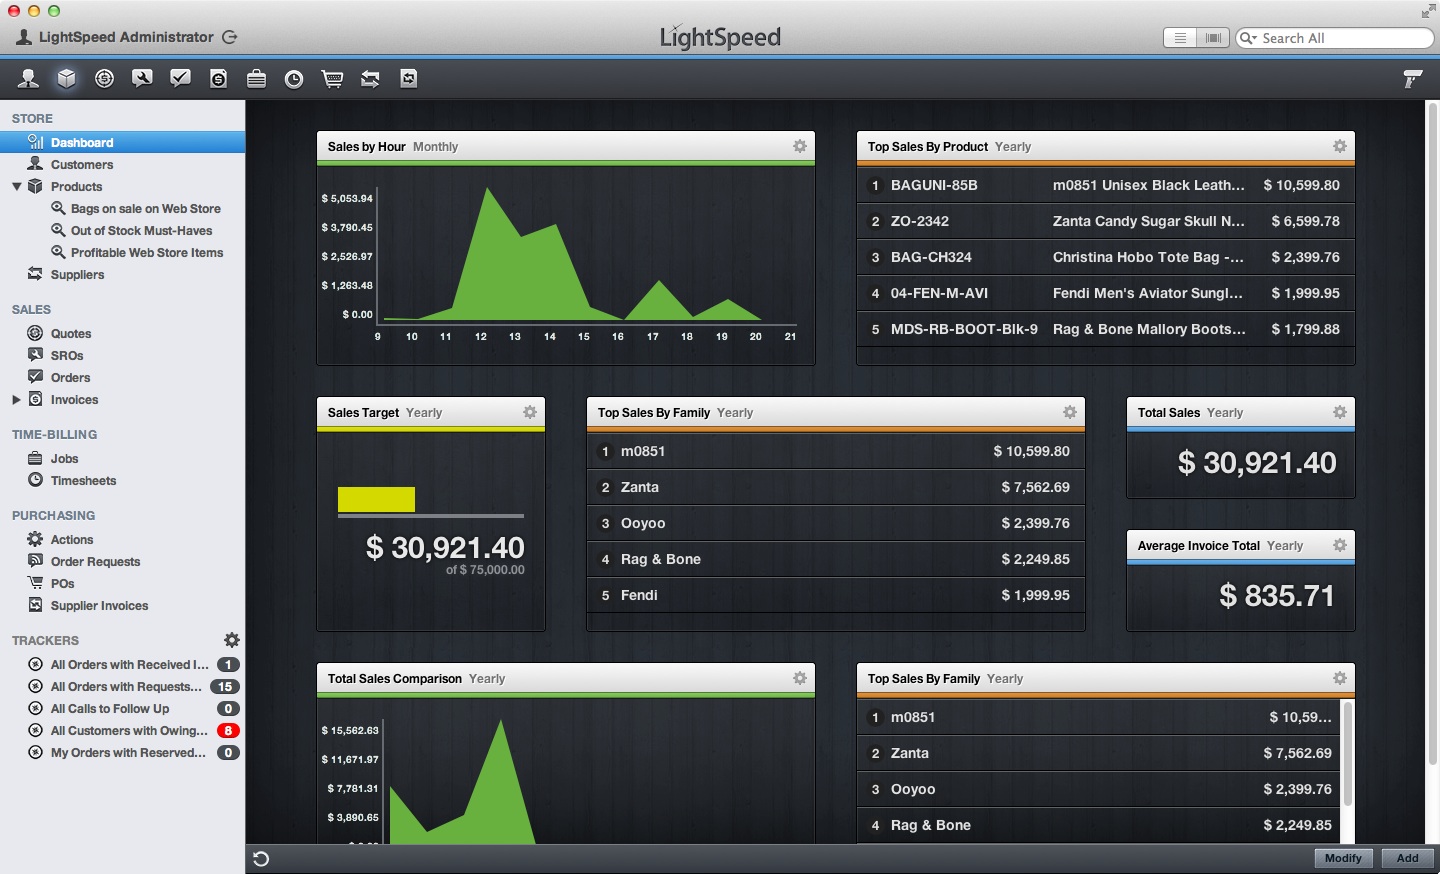
Lightspeed Retail
Gain insights into your retail operations with Lightspeed Retail's intuitive dashboard, offering real-time data and analytics to optimize your business.

Microsoft Dynamics 365 Commerce
Experience seamless retail management with Microsoft Dynamics 365 Commerce, offering real-time insights and integrated solutions for your business.
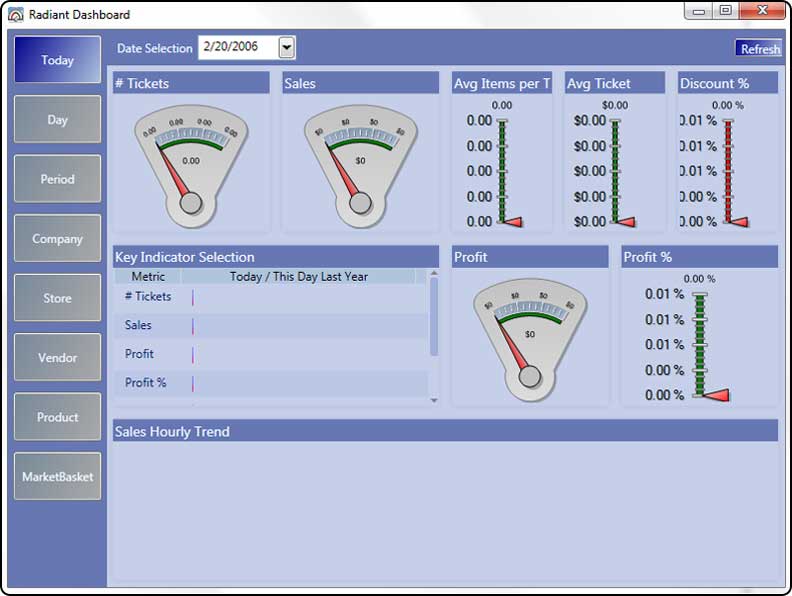
NCR Counterpoint
The NCR Counterpoint dashboard provides real-time insights into sales, inventory, and customer data to optimize retail operations efficiently.
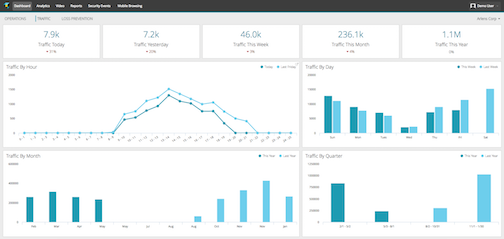
RetailNext
RetailNext dashboard provides real-time analytics on store performance, customer behavior, and sales trends to optimize retail operations effectively.

Springboard Retail
Gain insights into sales, inventory, and customer data with the Springboard Retail dashboard, designed for efficient retail management and growth.

Square Analytics
Gain insights into your business performance with Square Analytics. Track sales, customer trends, and inventory in real-time for smarter decisions.
Vend
Monitor sales, inventory, and customer insights seamlessly with the Vend dashboard, designed for streamlined retail management and performance tracking.

BluJay Solutions
The BluJay Solutions dashboard provides real-time logistics insights, optimizing supply chain efficiency with user-friendly analytics and tracking tools.

FourKites
Gain real-time visibility into your supply chain operations with FourKites, enhancing efficiency and decision-making with actionable insights.

FreightPOP
FreightPOP's dashboard offers real-time logistics insights, shipment tracking, and cost analysis to streamline your freight management process.
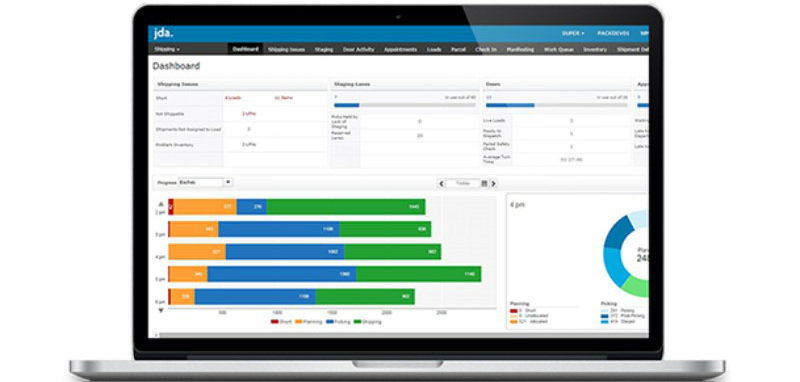
JDA Software
Optimize supply chain operations with JDA Software's intuitive dashboard, offering real-time insights and analytics for enhanced decision-making.

Locus
The Locus dashboard provides real-time insights and analytics to optimize logistics operations, enhance efficiency, and streamline supply chain processes.

Manhattan Associates
The Manhattan Associates dashboard provides real-time insights and analytics for supply chain management, enhancing operational efficiency and decision-making.
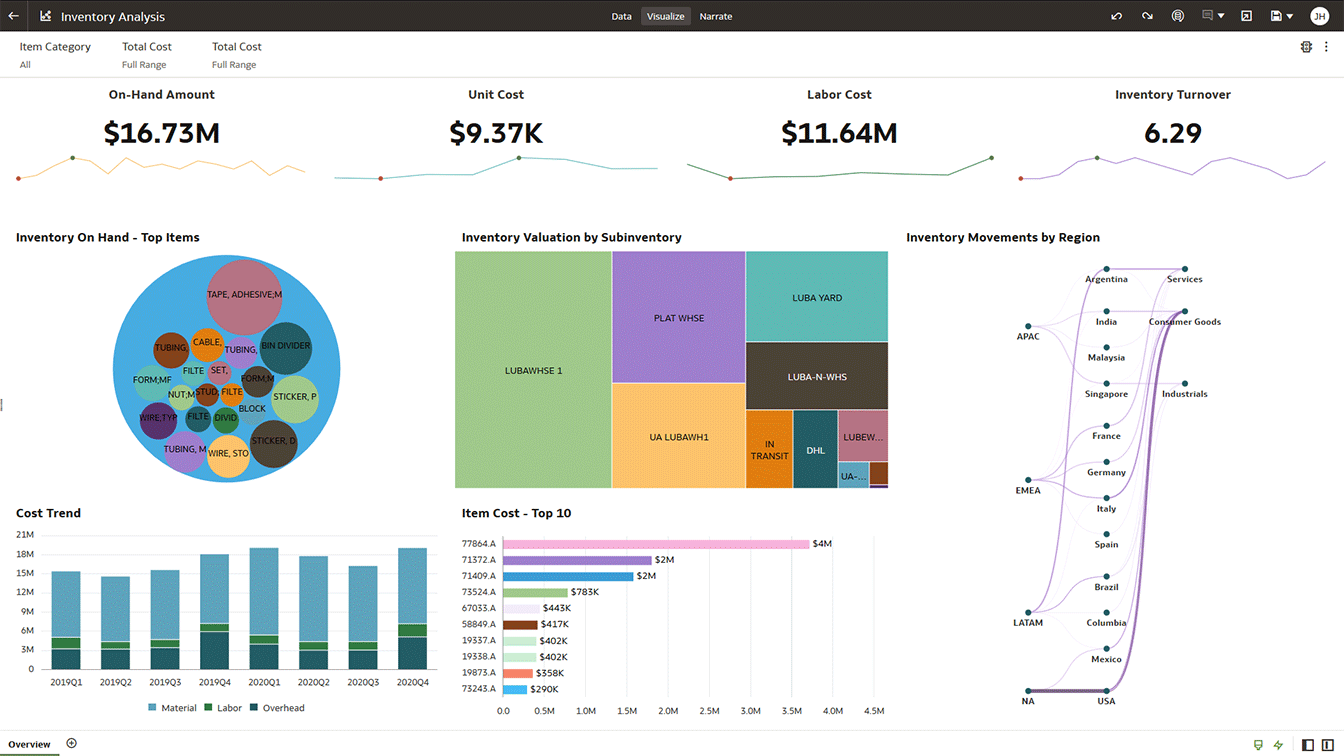
Oracle SCM Cloud
Gain real-time insights and streamline your supply chain operations with Oracle SCM Cloud's comprehensive and user-friendly dashboard.

SAP Integrated Business Planning
Optimize and streamline your supply chain operations with SAP Integrated Business Planning, offering real-time insights and predictive analytics.

ShipBob Analytics
Gain real-time insights into your inventory, orders, and shipments with ShipBob Analytics, optimizing your fulfillment operations effortlessly.
Track-POD
Track-POD dashboard offers real-time delivery tracking, performance analytics, and route optimization to enhance logistics efficiency and customer satisfaction.

Amplitude
Gain insights into user behavior and product analytics with the Amplitude dashboard, designed to enhance decision-making and drive growth.

Crazy Egg
Gain insights into user behavior with Crazy Egg's intuitive dashboard, featuring heatmaps, scroll maps, and more to optimize your website's performance.
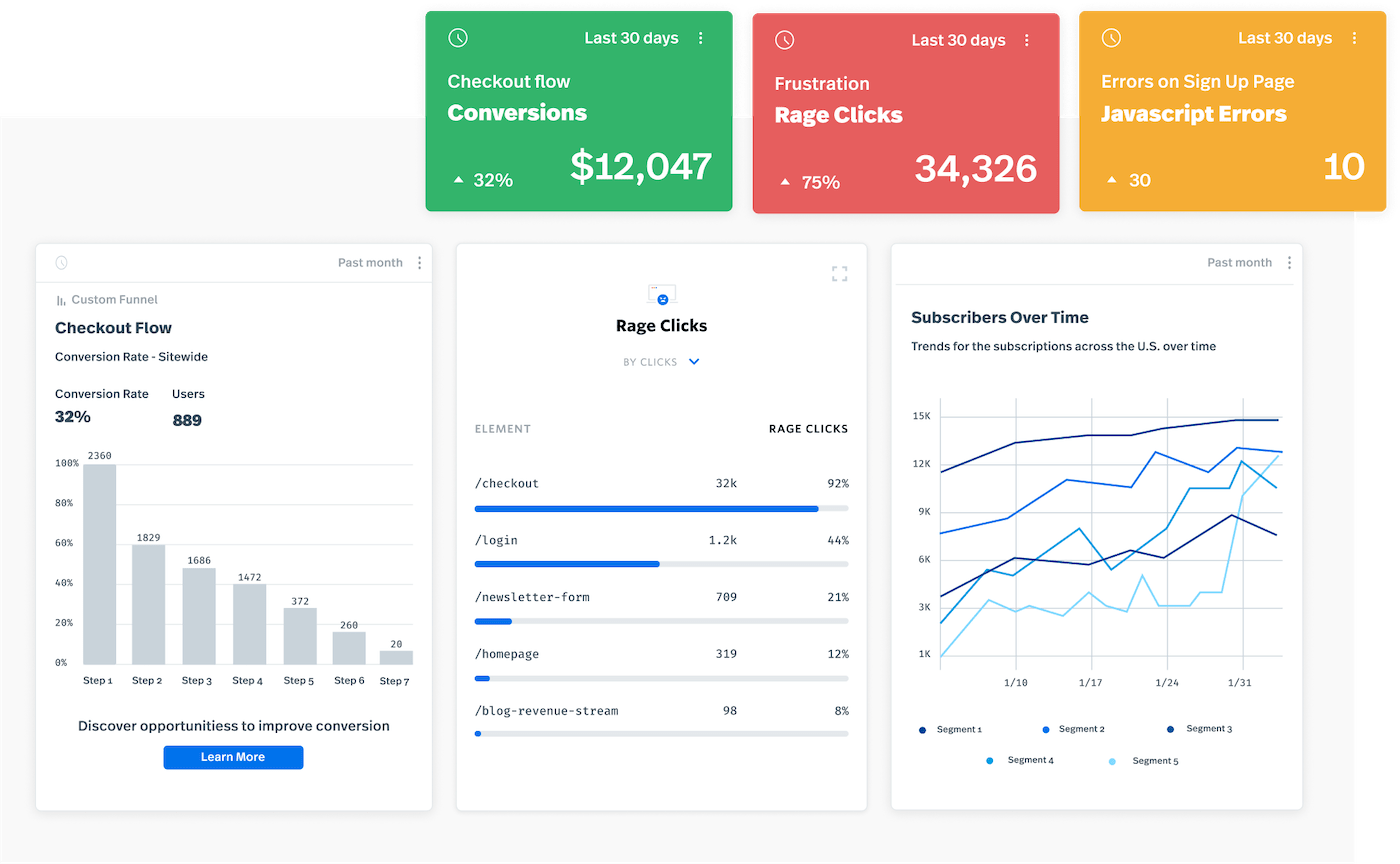
FullStory
Gain insights into user behavior and enhance digital experiences with FullStory's comprehensive analytics dashboard.
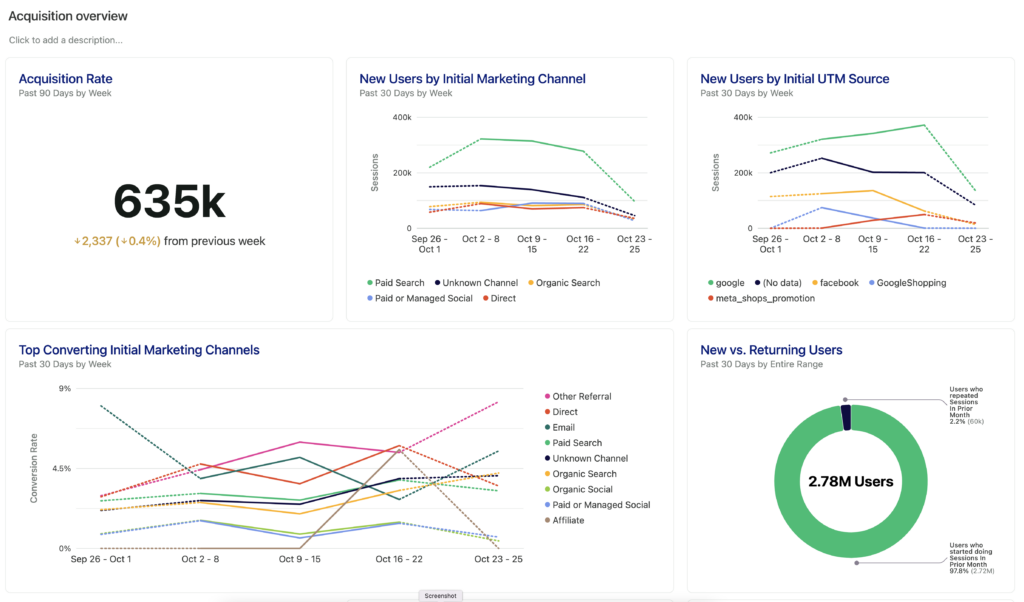
Heap
The Heap dashboard offers comprehensive analytics for tracking user interactions, providing insights to optimize user experience and drive business growth.

Hotjar
Gain insights into user behavior with Hotjar's dashboard, featuring heatmaps, session recordings, and feedback tools for data-driven decisions.
Kissmetrics
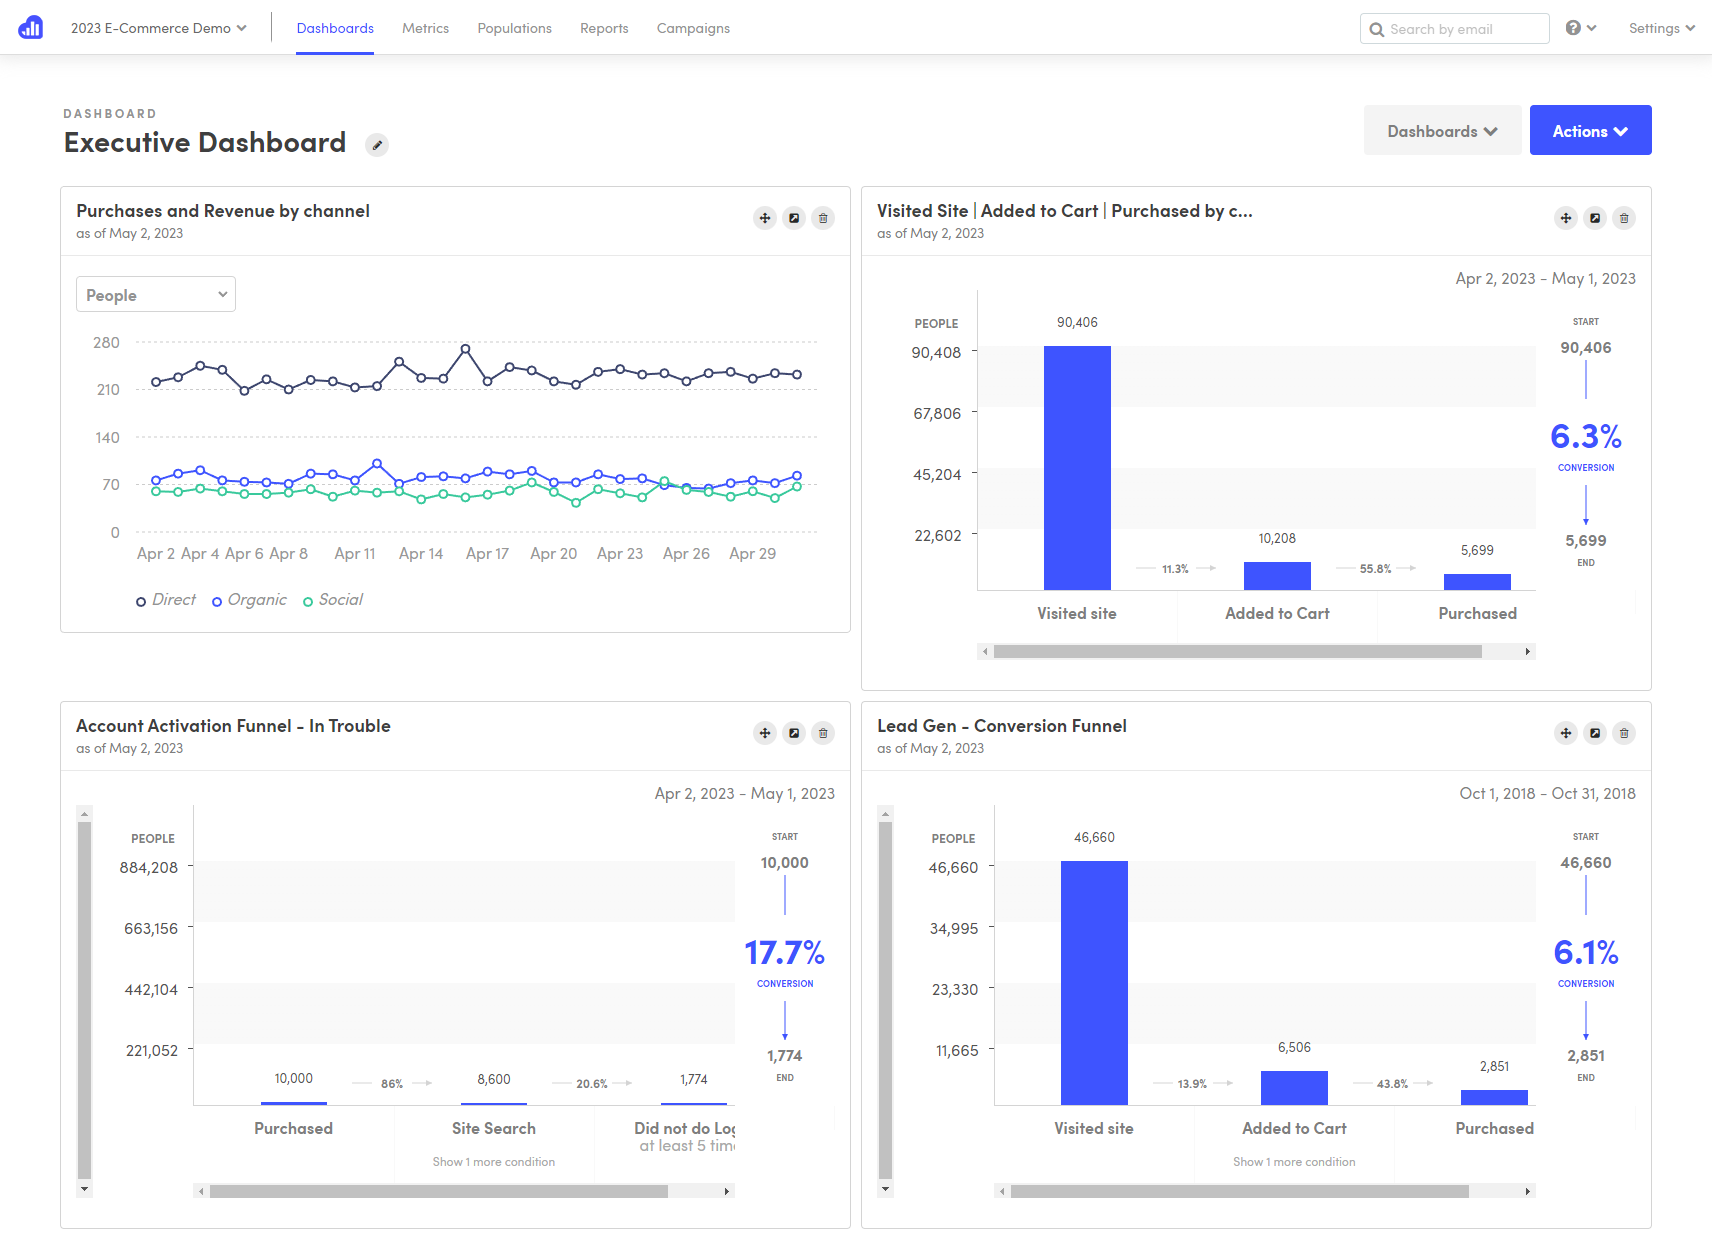
Track user behavior, analyze customer journeys, and optimize conversions with the Kissmetrics dashboard for actionable insights and growth.

LookML
Explore and analyze data with ease using the LookML dashboard, offering customizable insights and seamless integration for data-driven decisions.
Pendo
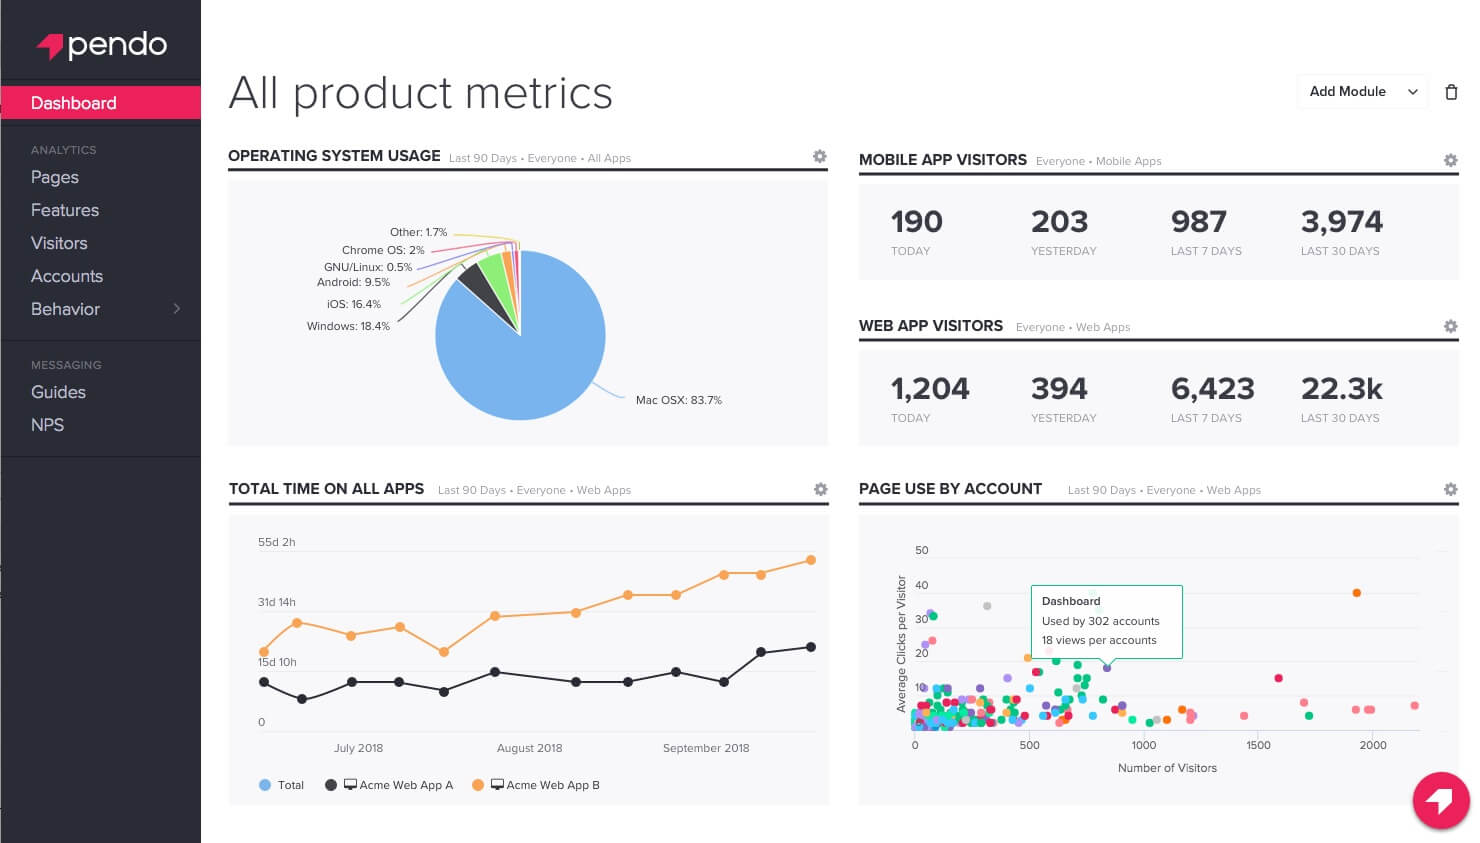
Gain insights into user behavior, product engagement, and feature adoption with the Pendo dashboard, designed for data-driven decision-making.

Periscope Data
The Periscope Data dashboard provides real-time analytics and visualization tools to transform raw data into actionable insights for businesses.

Quantum Metric
Gain real-time insights into user behavior and optimize digital experiences with the Quantum Metric dashboard, enhancing customer satisfaction and conversion.
UserTesting
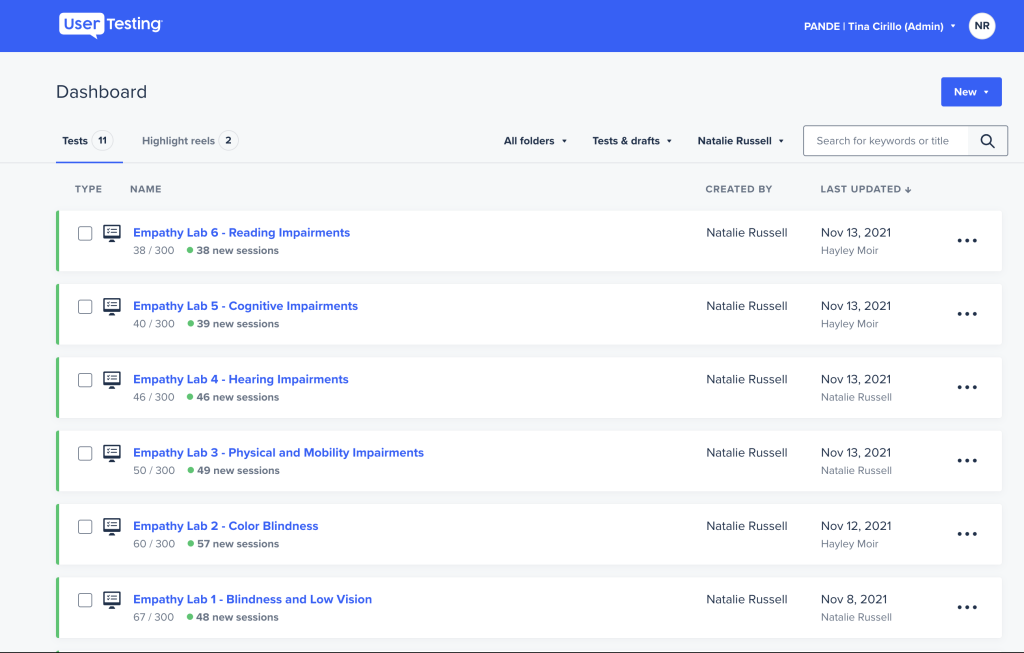
Gain insights into user behavior and feedback with the UserTesting dashboard, designed for streamlined analysis and improved user experience.
Woopra
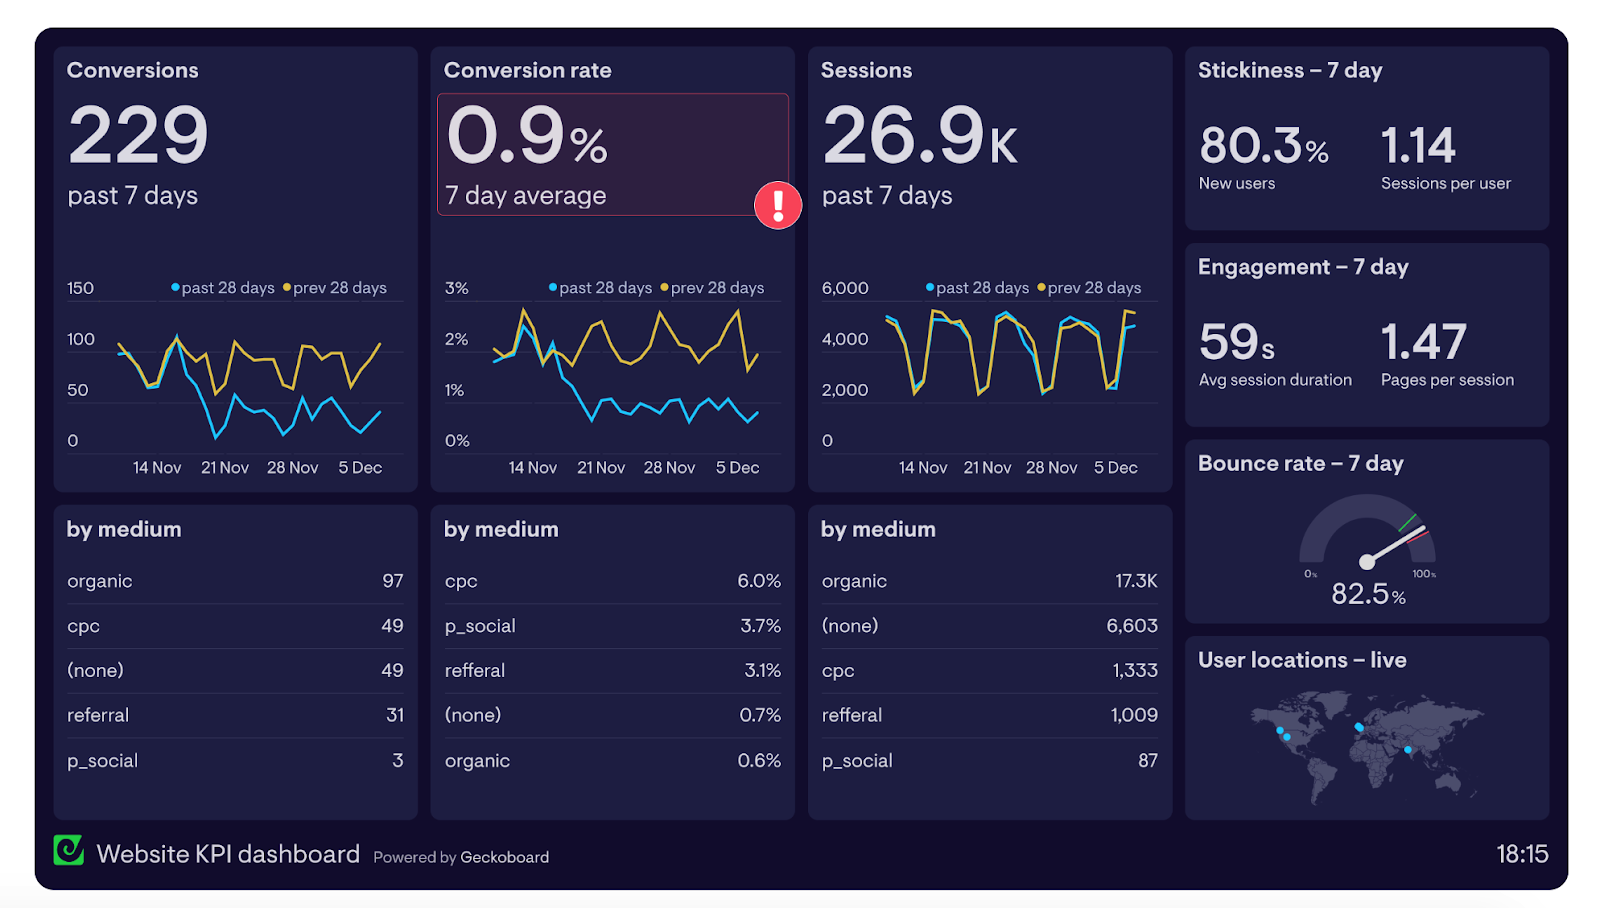
The Woopra dashboard offers real-time customer journey analytics, enabling businesses to track and optimize user engagement and conversion rates.
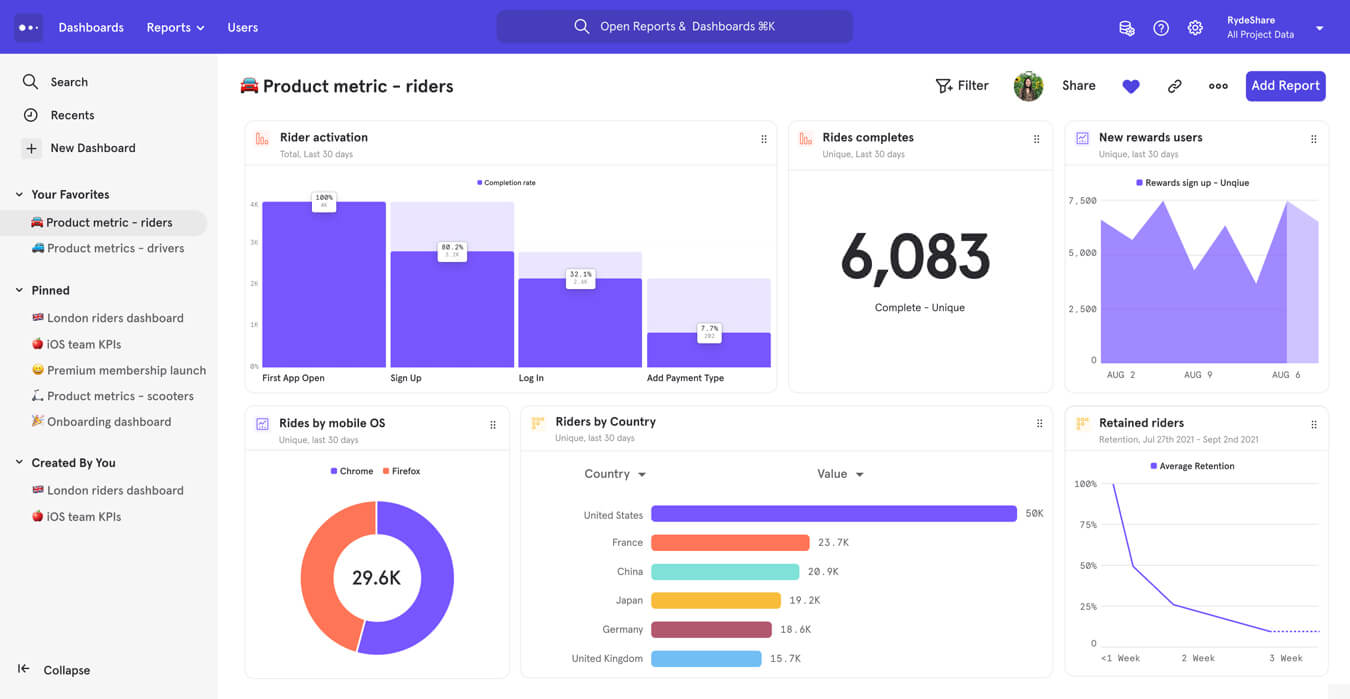
Mixpanel
Analyze user behavior, track engagement metrics, and optimize product strategies with the Mixpanel dashboard for data-driven decision-making.
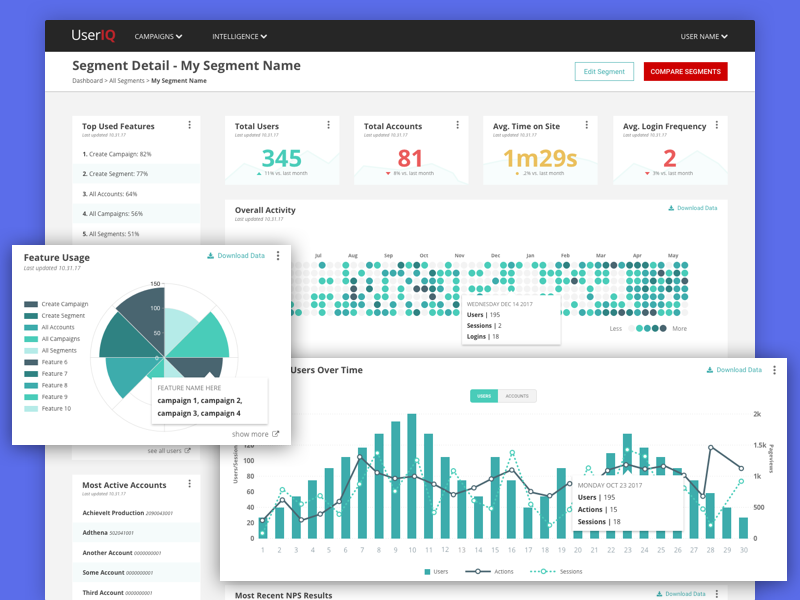
Segment
The Segment dashboard offers a comprehensive view of your customer data, enabling seamless integration and real-time insights to optimize marketing strategies.
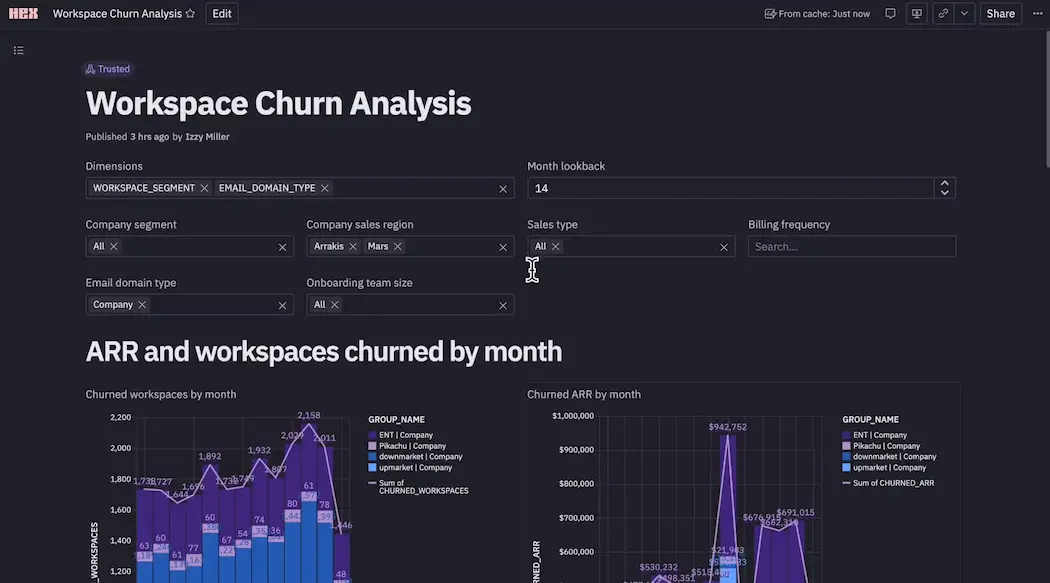
Hex
Explore data insights seamlessly with Hex, a powerful dashboard designed for interactive analysis and visualization, enhancing decision-making efficiency.
