


Power BI
Securely display your business dashboards on screens to unlock valuable data insights for your teams without compromising sensitive information.
About Power BI
Key Features
⭐Secure dashboard sharing
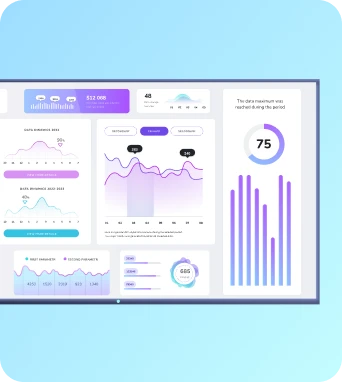
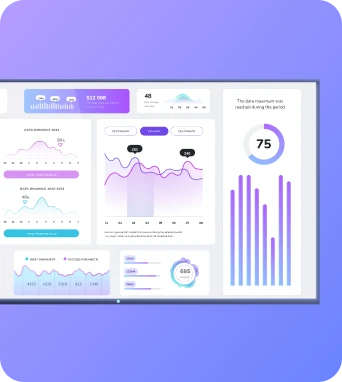
Securely display Power BI dashboards on your workplace TV screens without exposing sensitive credentials or requiring additional user seats.
⭐Flexible display options
Choose how your Power BI reports appear on screen, including full-screen views, automatic scrolling, and customized layouts.
⭐Targeted data filtering
Filter your displayed data using Power BI slicers to create tailored views that show the most relevant metrics for different audiences and locations.
See It In Action
Frequently Asked Questions
Can I display multiple dashboards or reports across different screens?
How often does my dashboard refresh on screen?
Will my dashboard work if my screen’s browser is outdated?
What if my dashboard or report contains too much information to fit on one screen?
Related Guides
Displaying Apps via Screenshots
Learn how Fugo’s screenshotting feature helps you display content from apps like Power BI, even on older devices or restricted networks. This guide walks you through setup and best practices.
Read Guide →5 Ways to Share Power BI Dashboards
From embedding dashboards in tools your team already uses to displaying them on workplace screens, this article covers the best ways to securely share Power BI insights with your broader team.
Read Guide →BI Dashboards for TV Screens
Not sure which dashboard & reporting tools will have the biggest impact on your digital signage? This guide highlights the most effective business intelligence dashboards for workplace screens.
Read Guide →Explore More Apps
View all apps.png)

Ready to get going with your digital signage?
Start managing your screens today with a free trial, or book a demo to find out how Fugo can work for your organization.